Chart reference
Every chart you can add to a dashboard, with an example of each and a page on its data and options.
1 min read
On this page
Every chart you can add to a dashboard, grouped the way the widget library groups them. Each page shows an example you can open as a live chart, the data the chart needs, and every option it has. For the styling every chart shares, see Chart styling.
Time series#
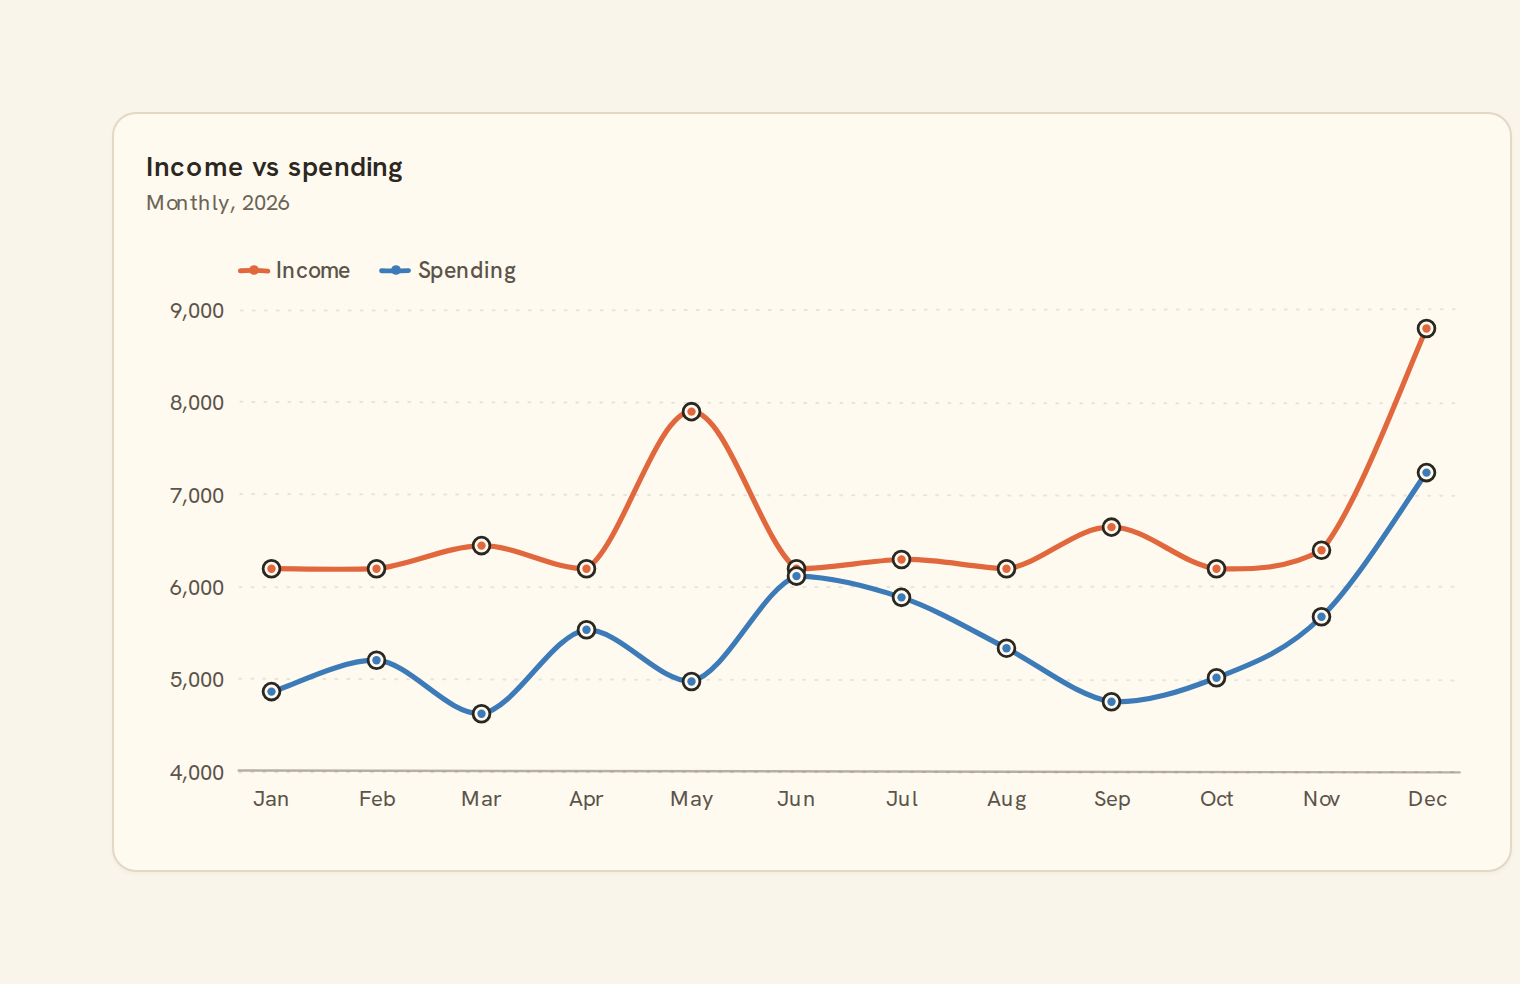
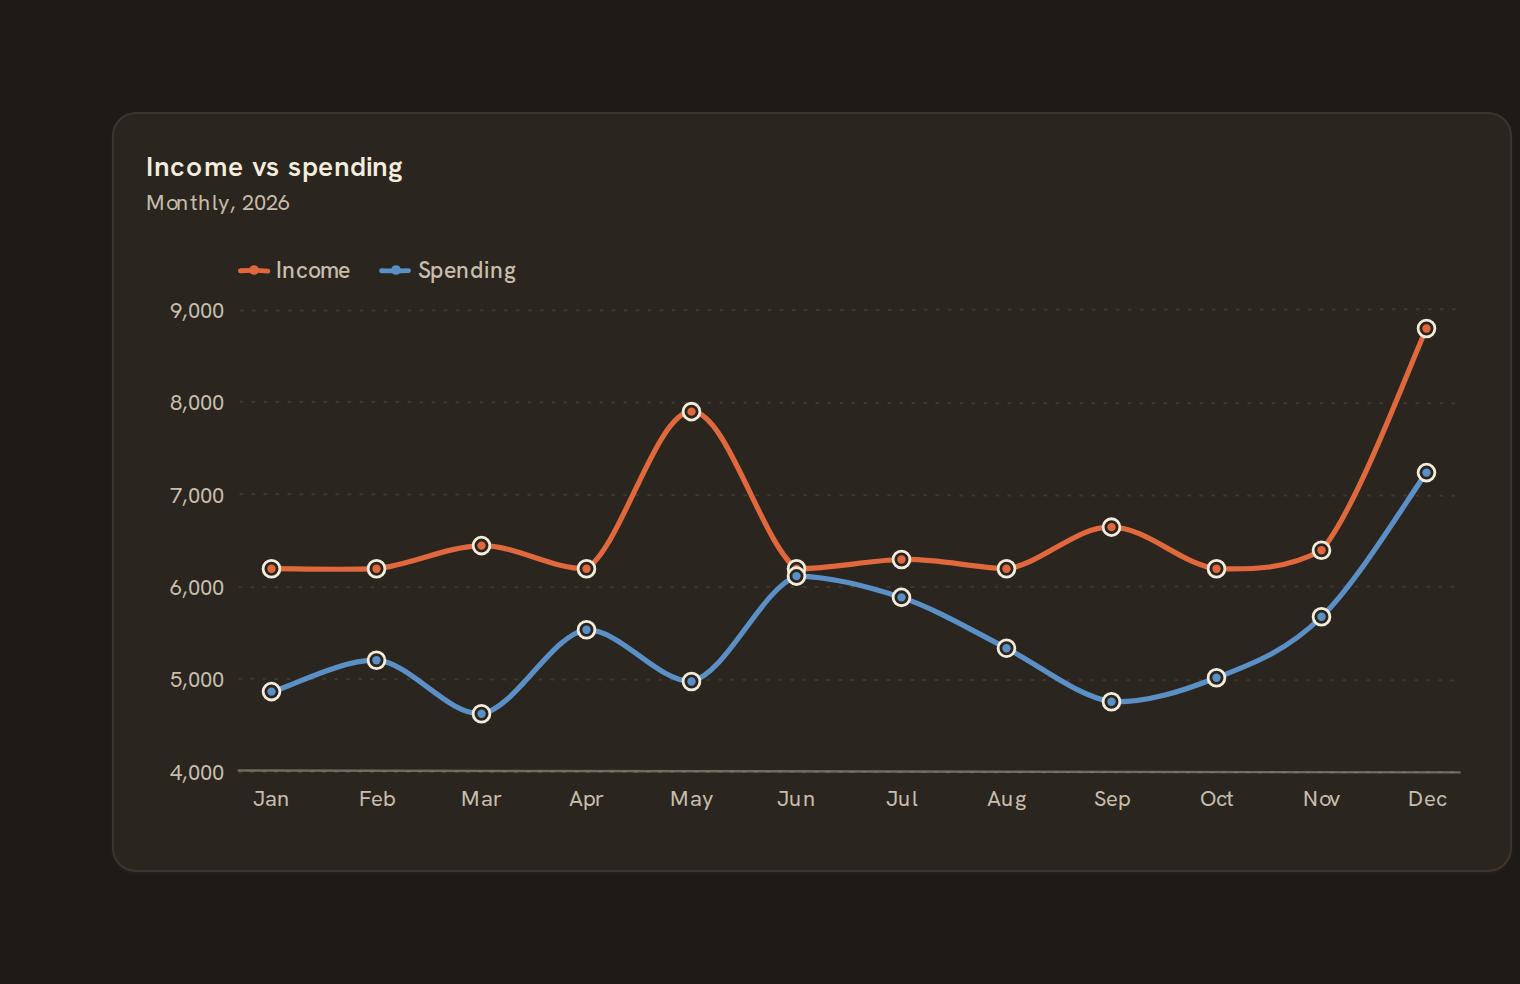 Line chartTime series over any field
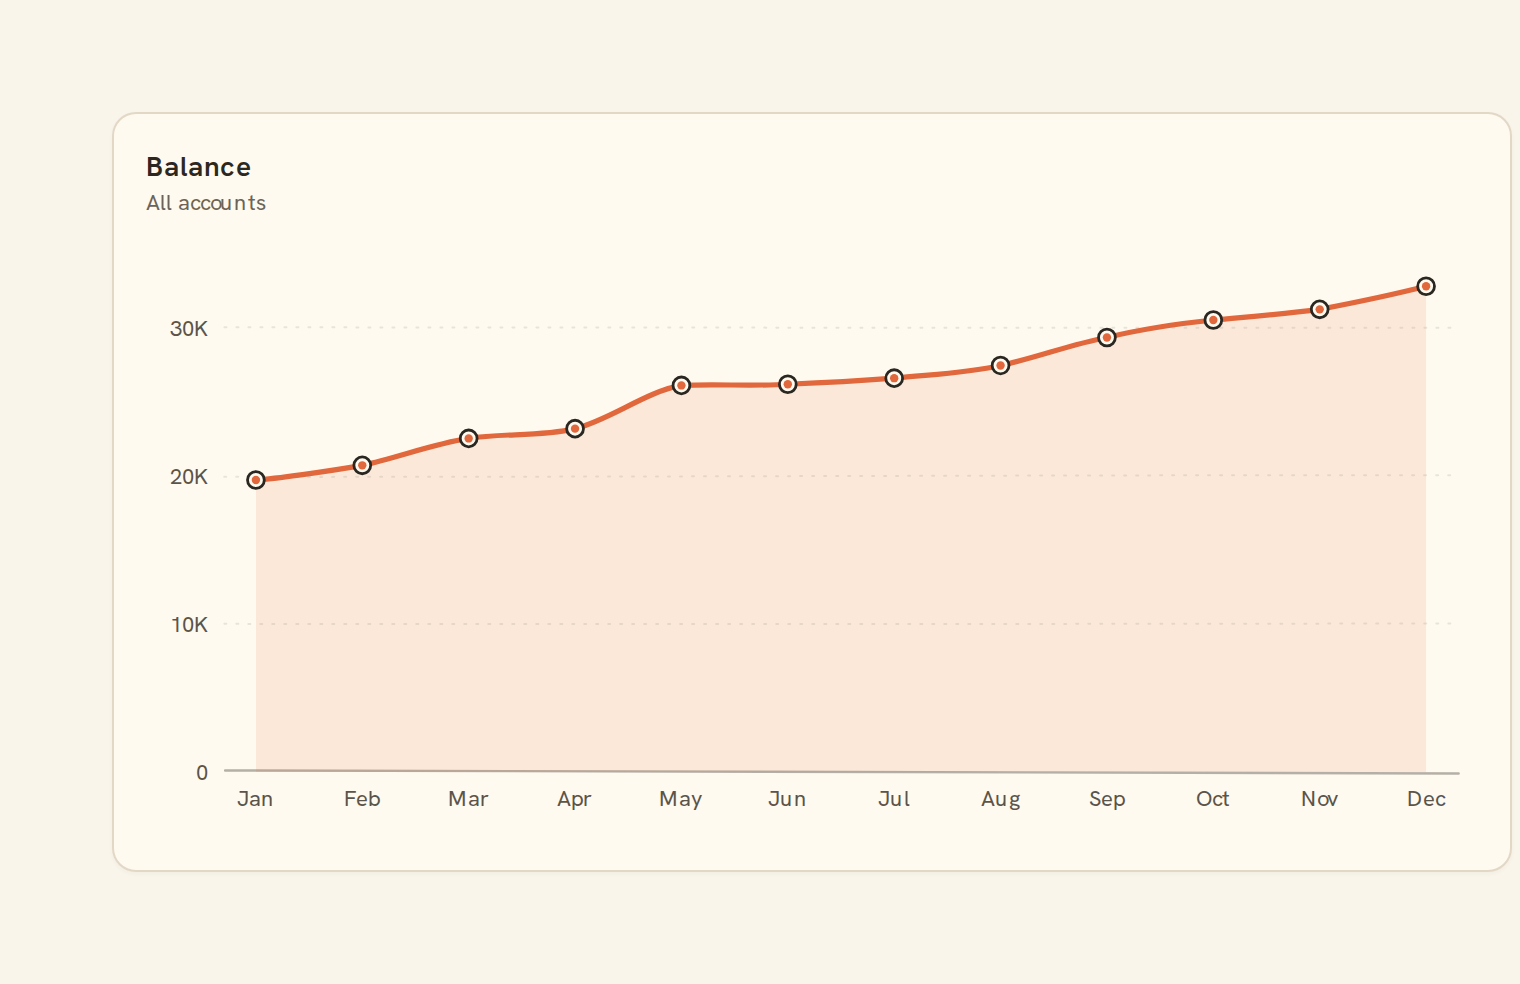
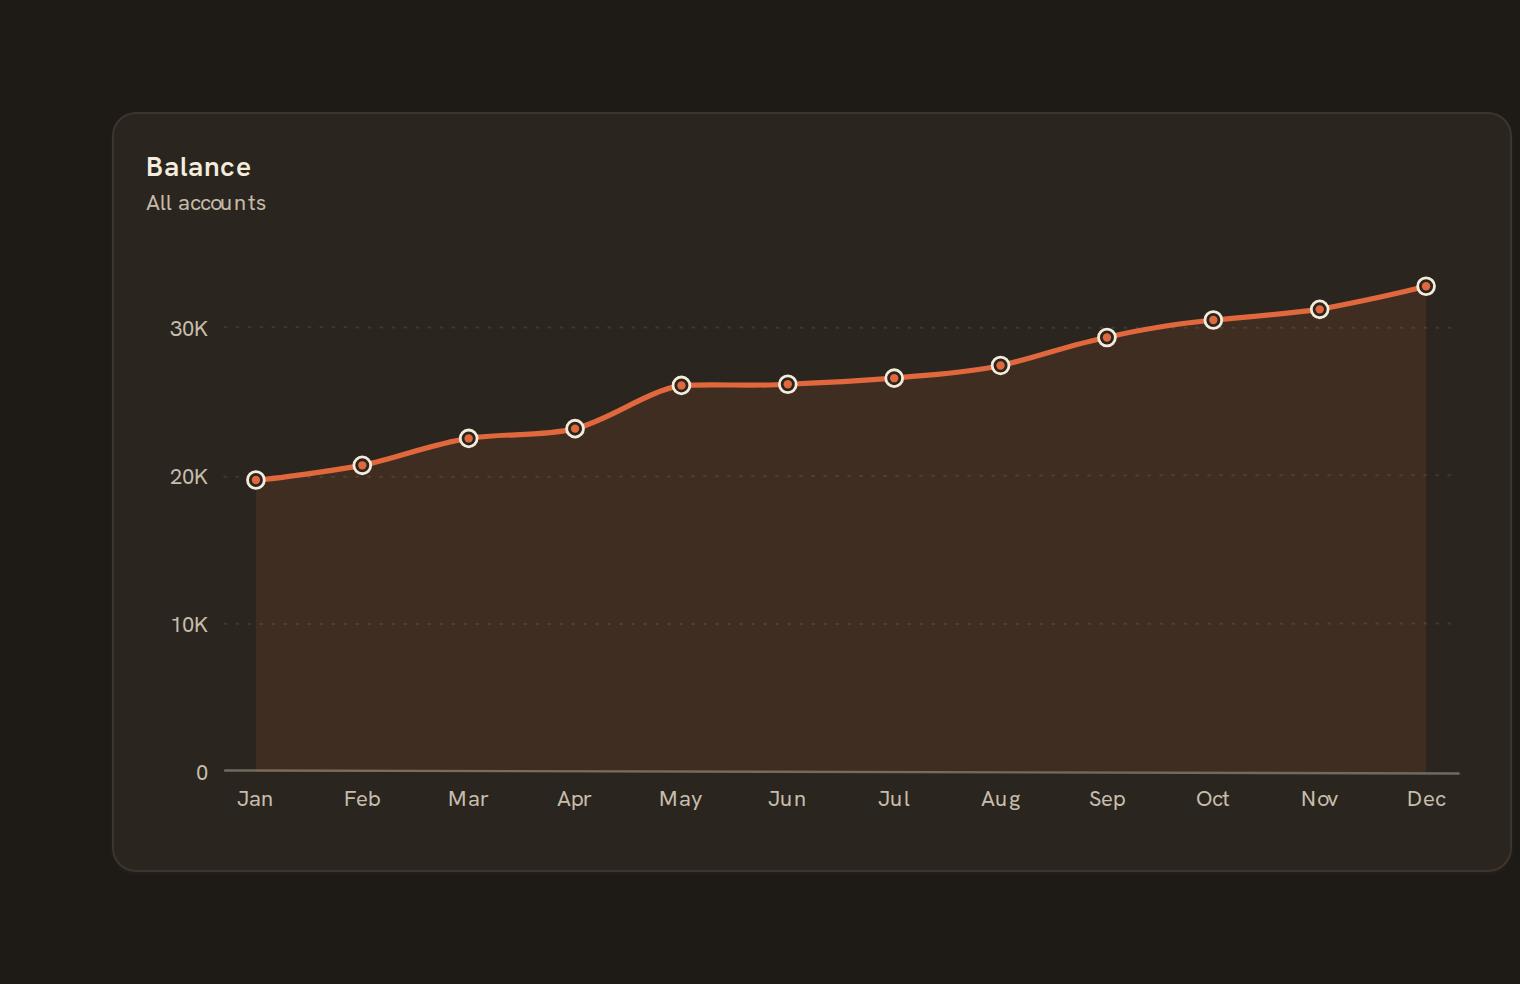 Area chartStacked or overlaid area
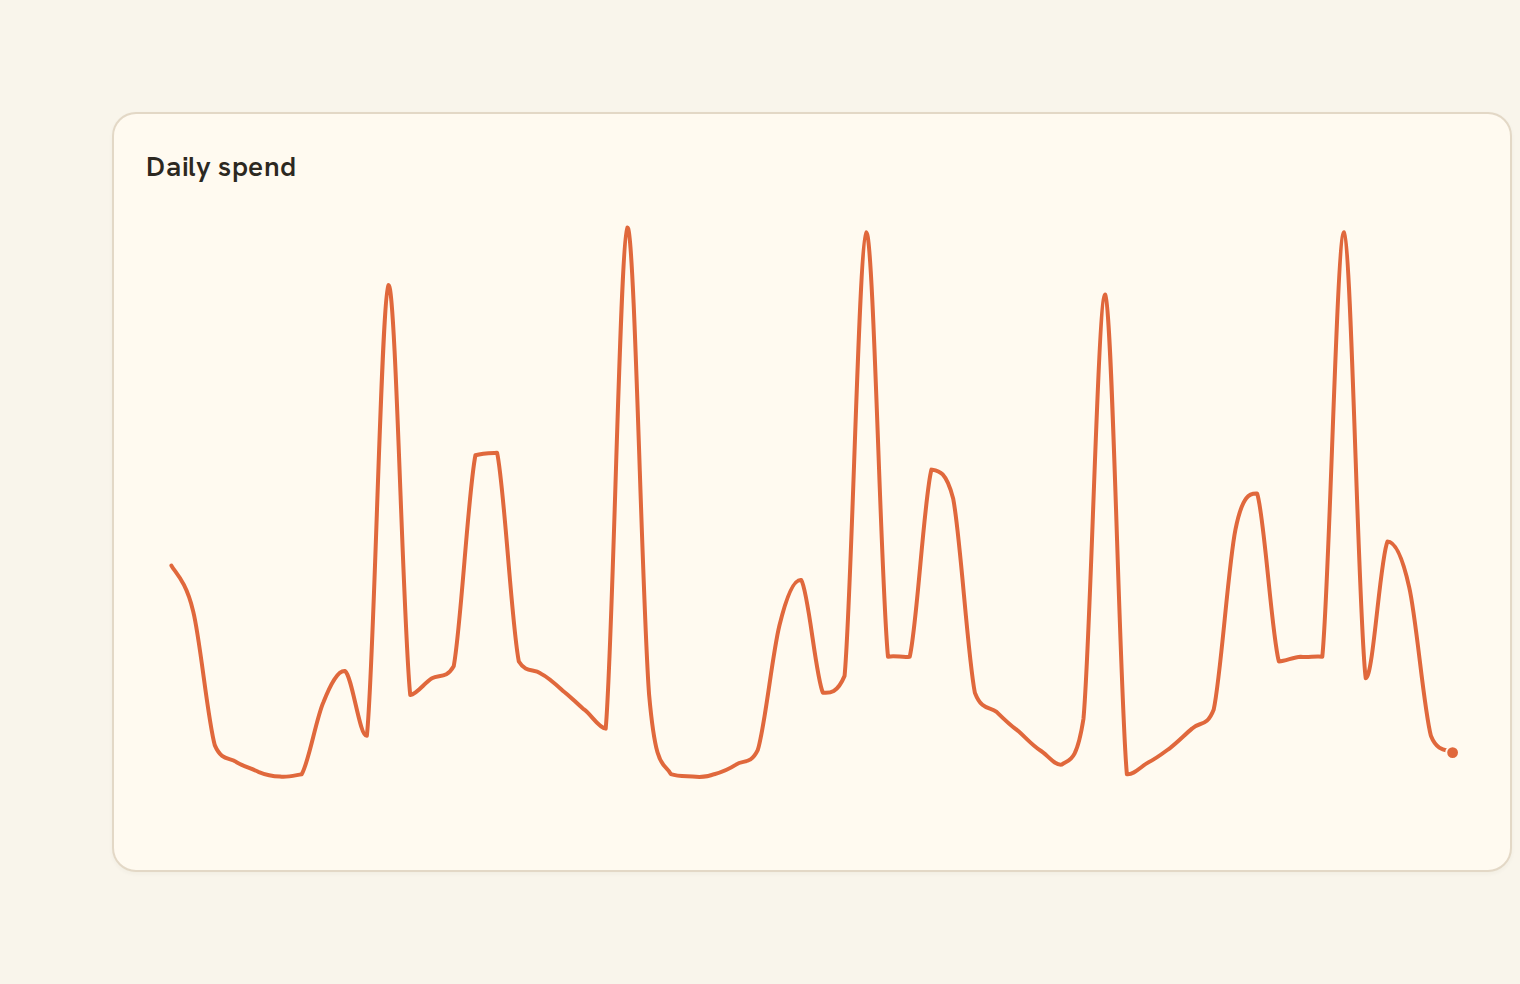
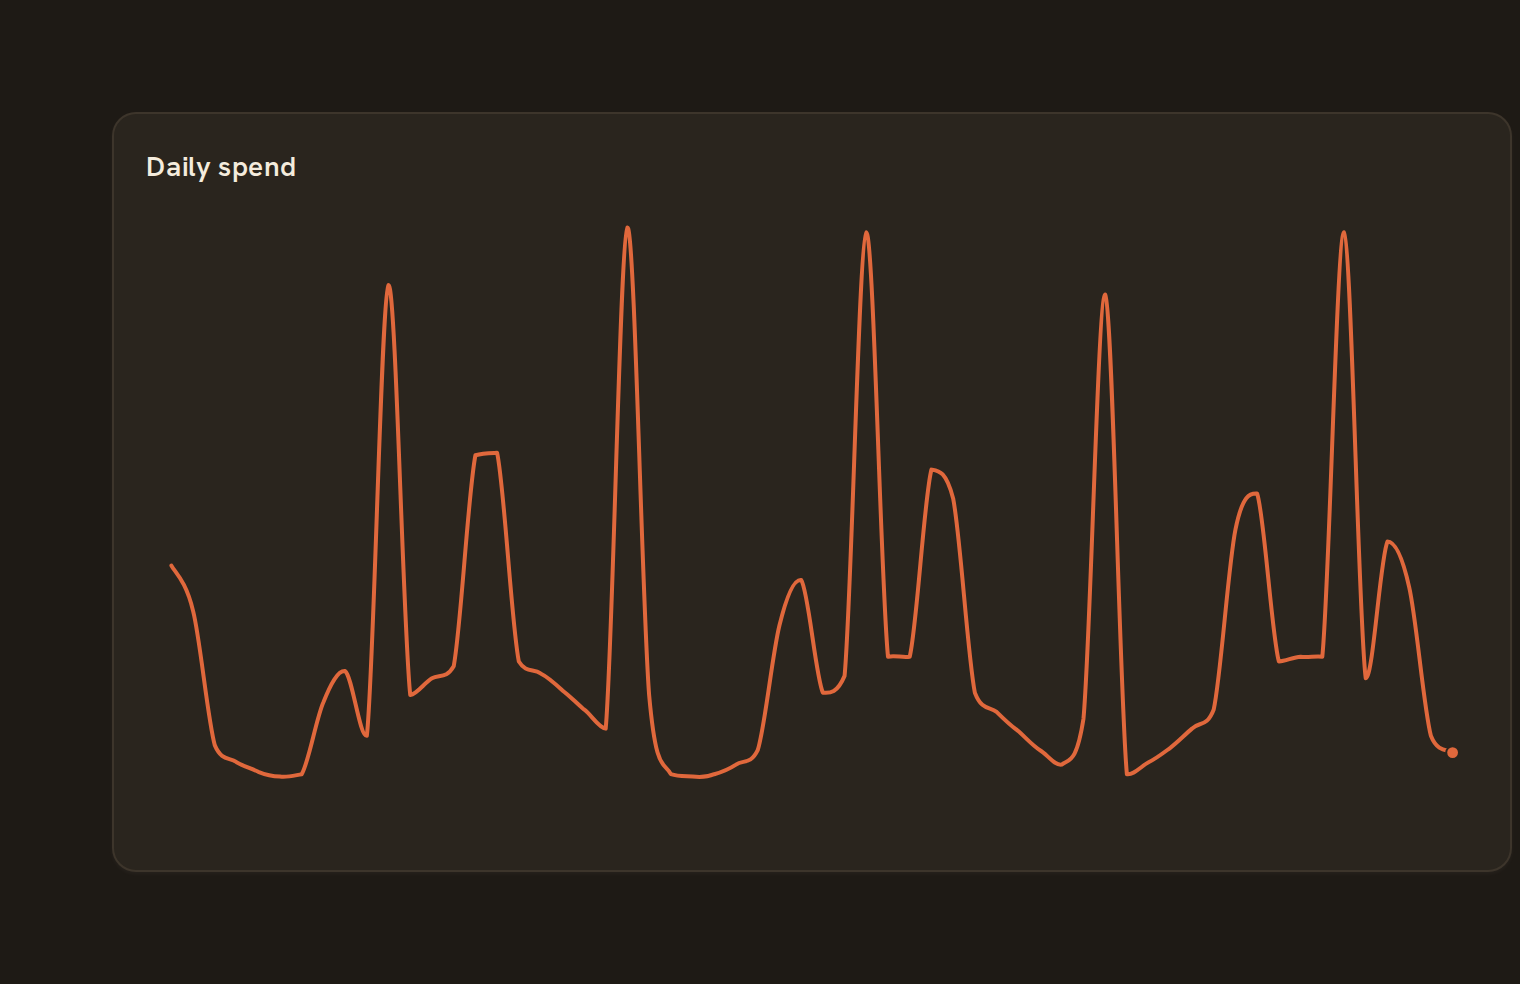 SparklineTiny inline trend
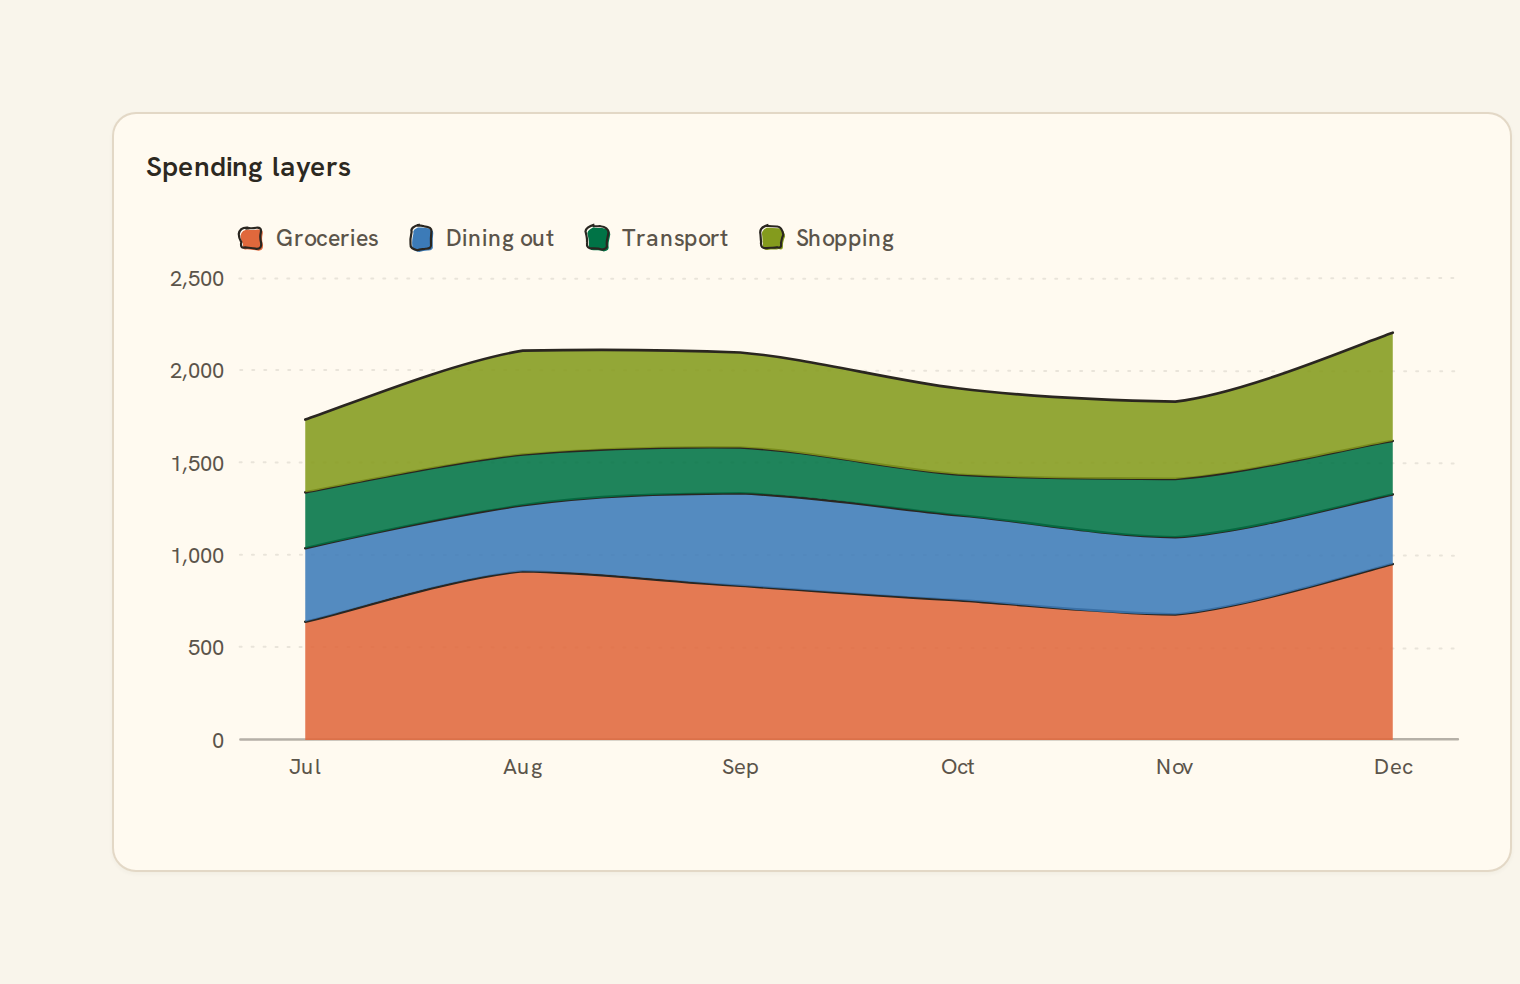
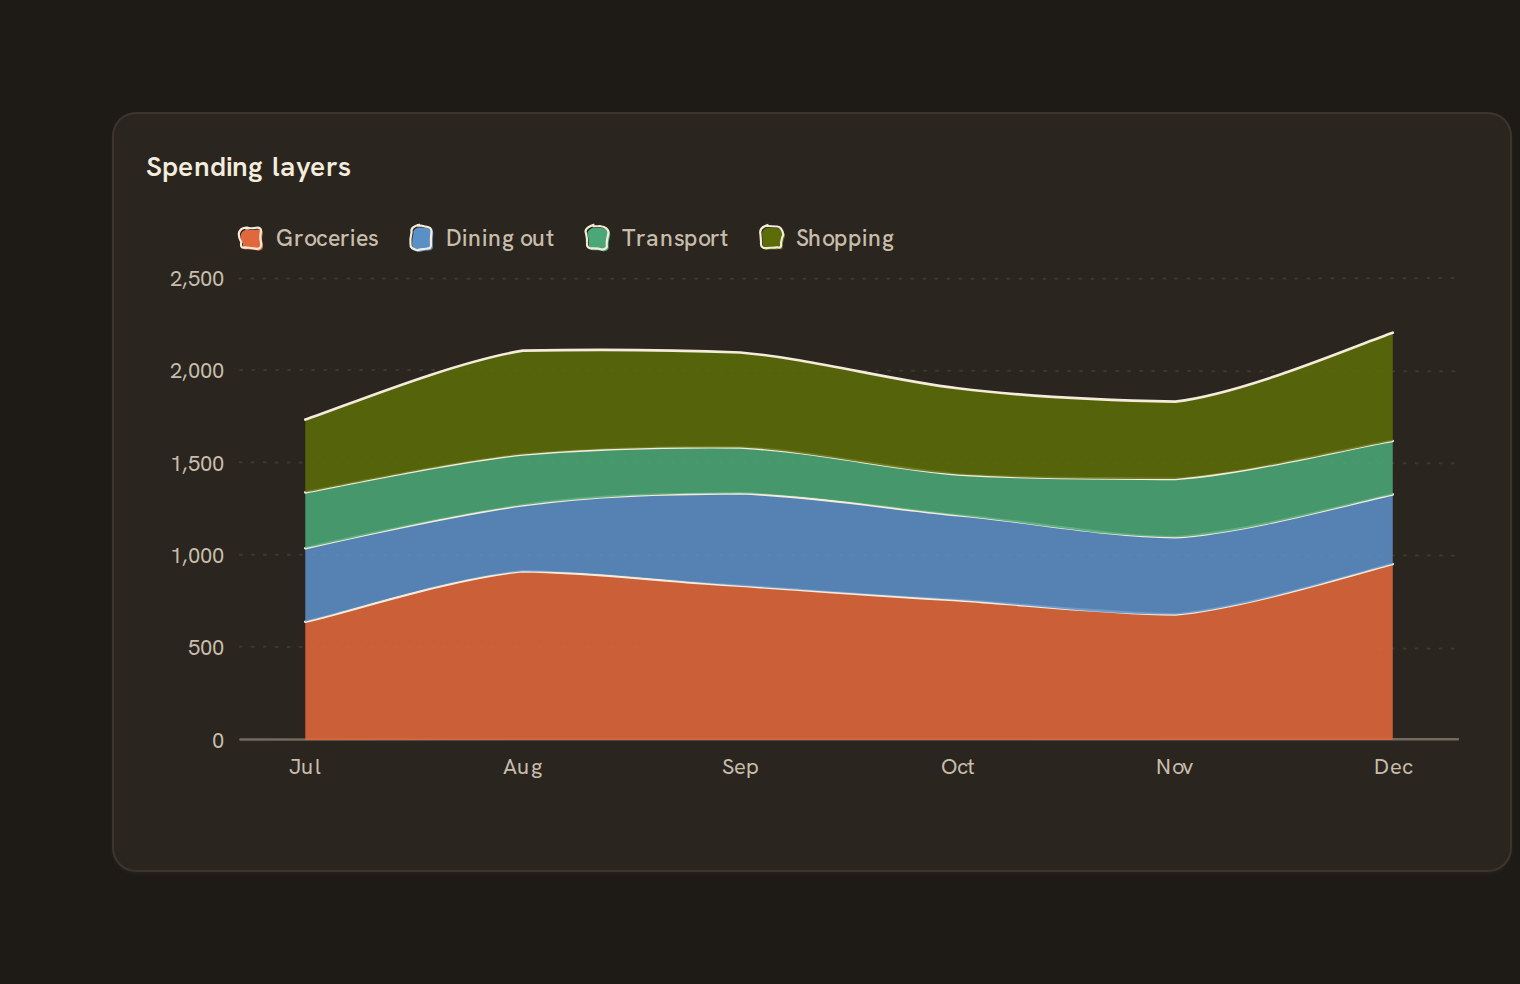 Stacked areaSeries stacked over time
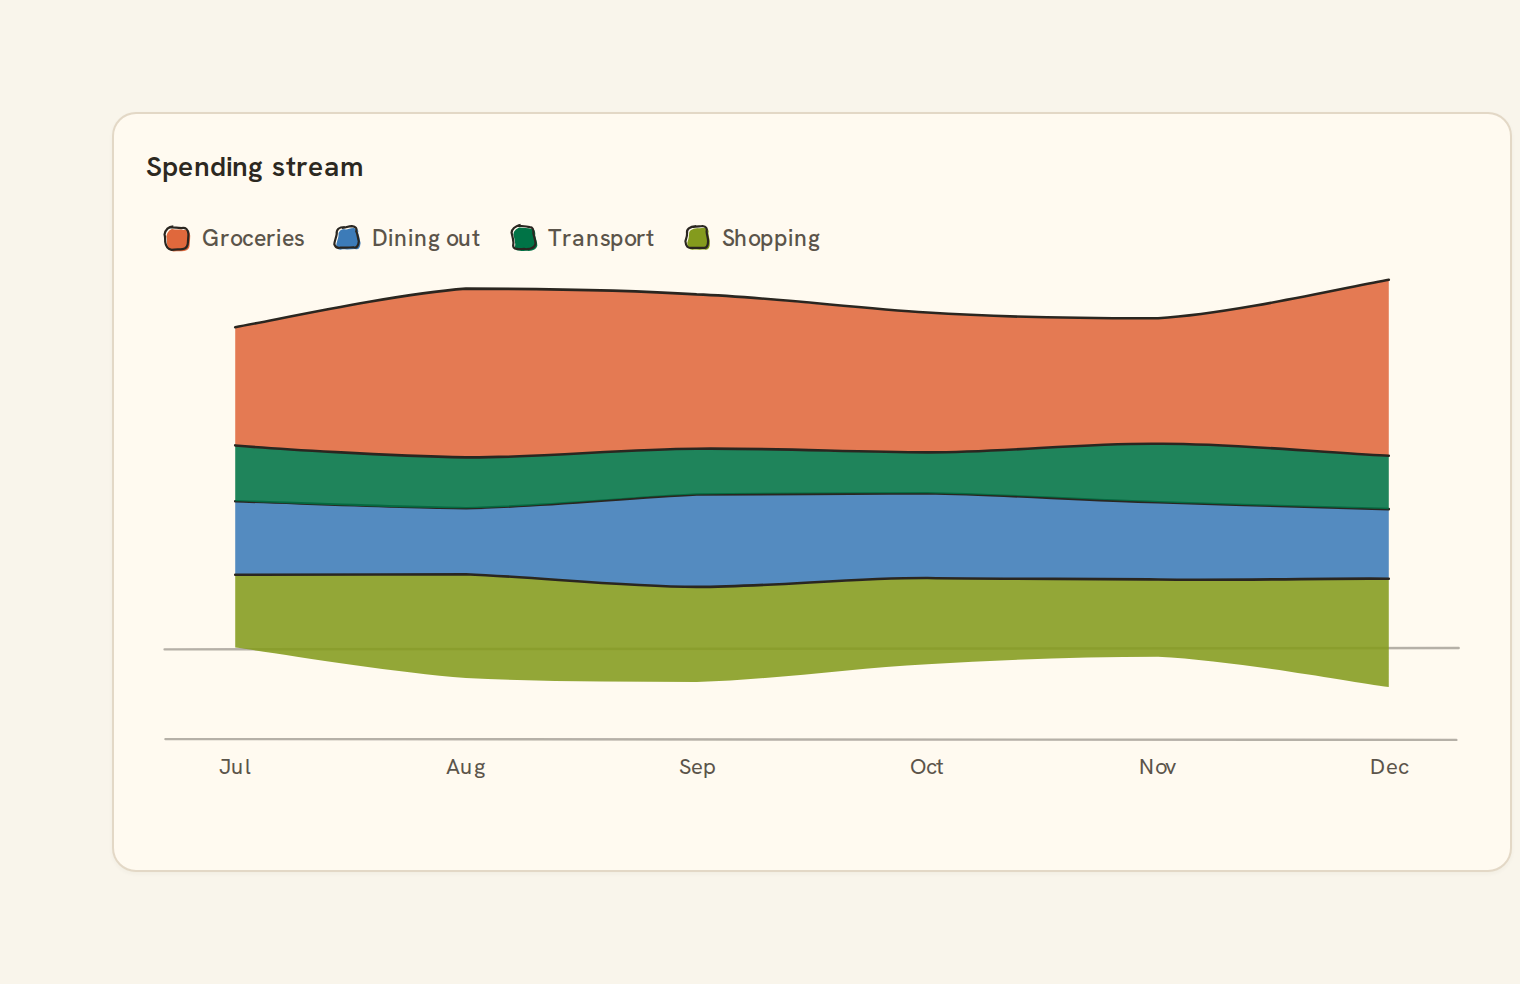
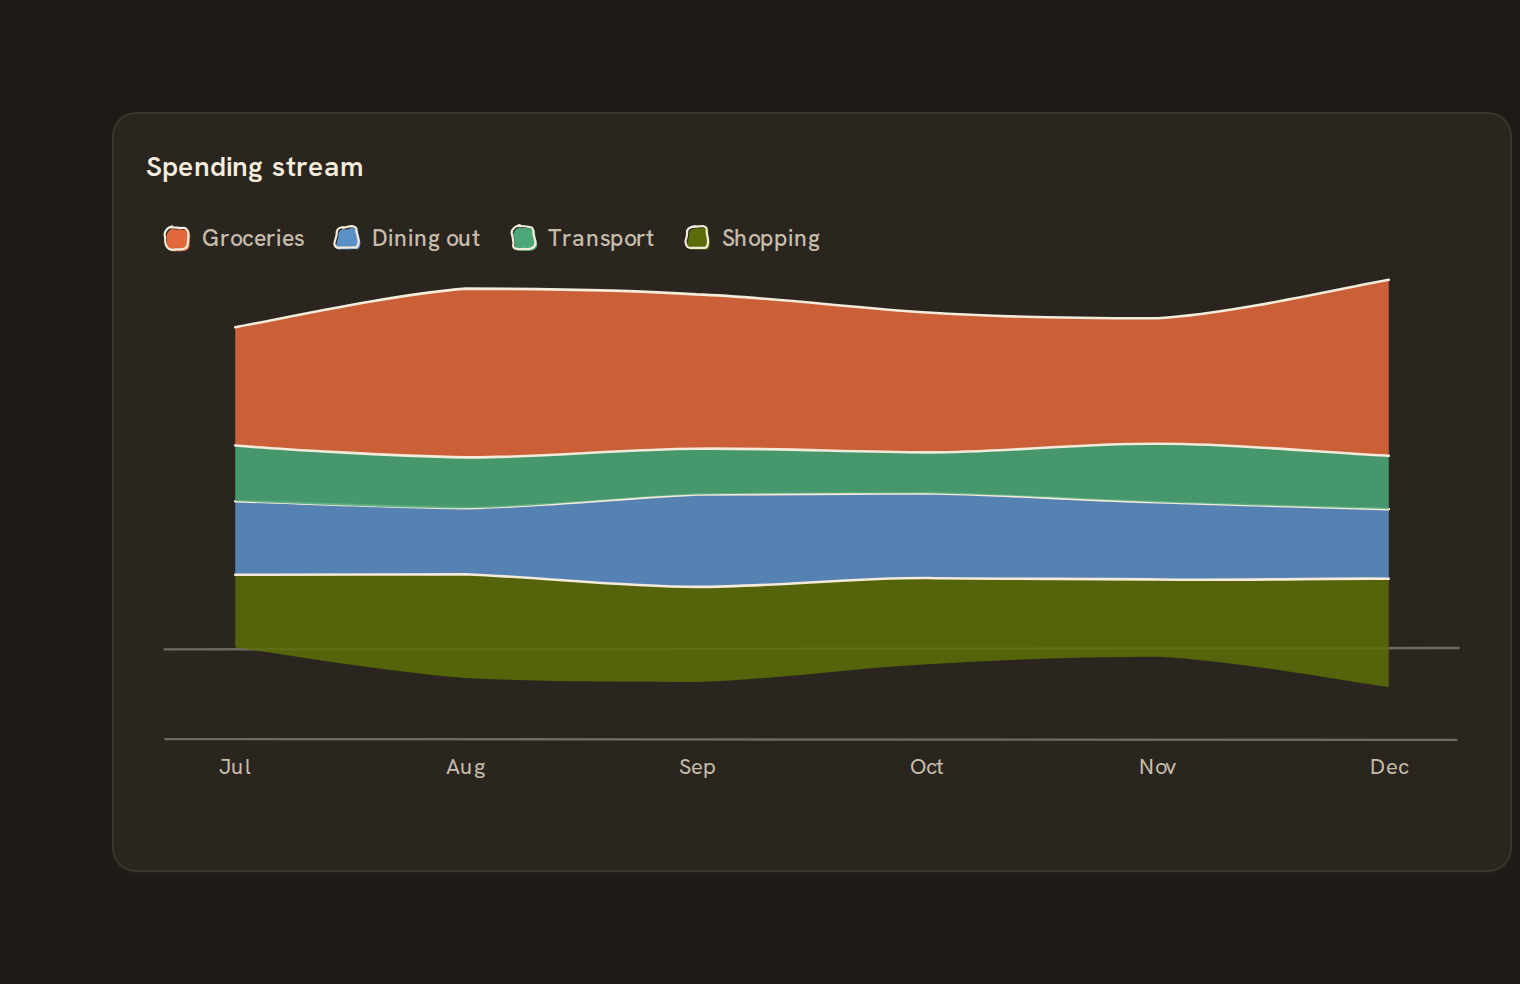 Stream graphCentered stacked area
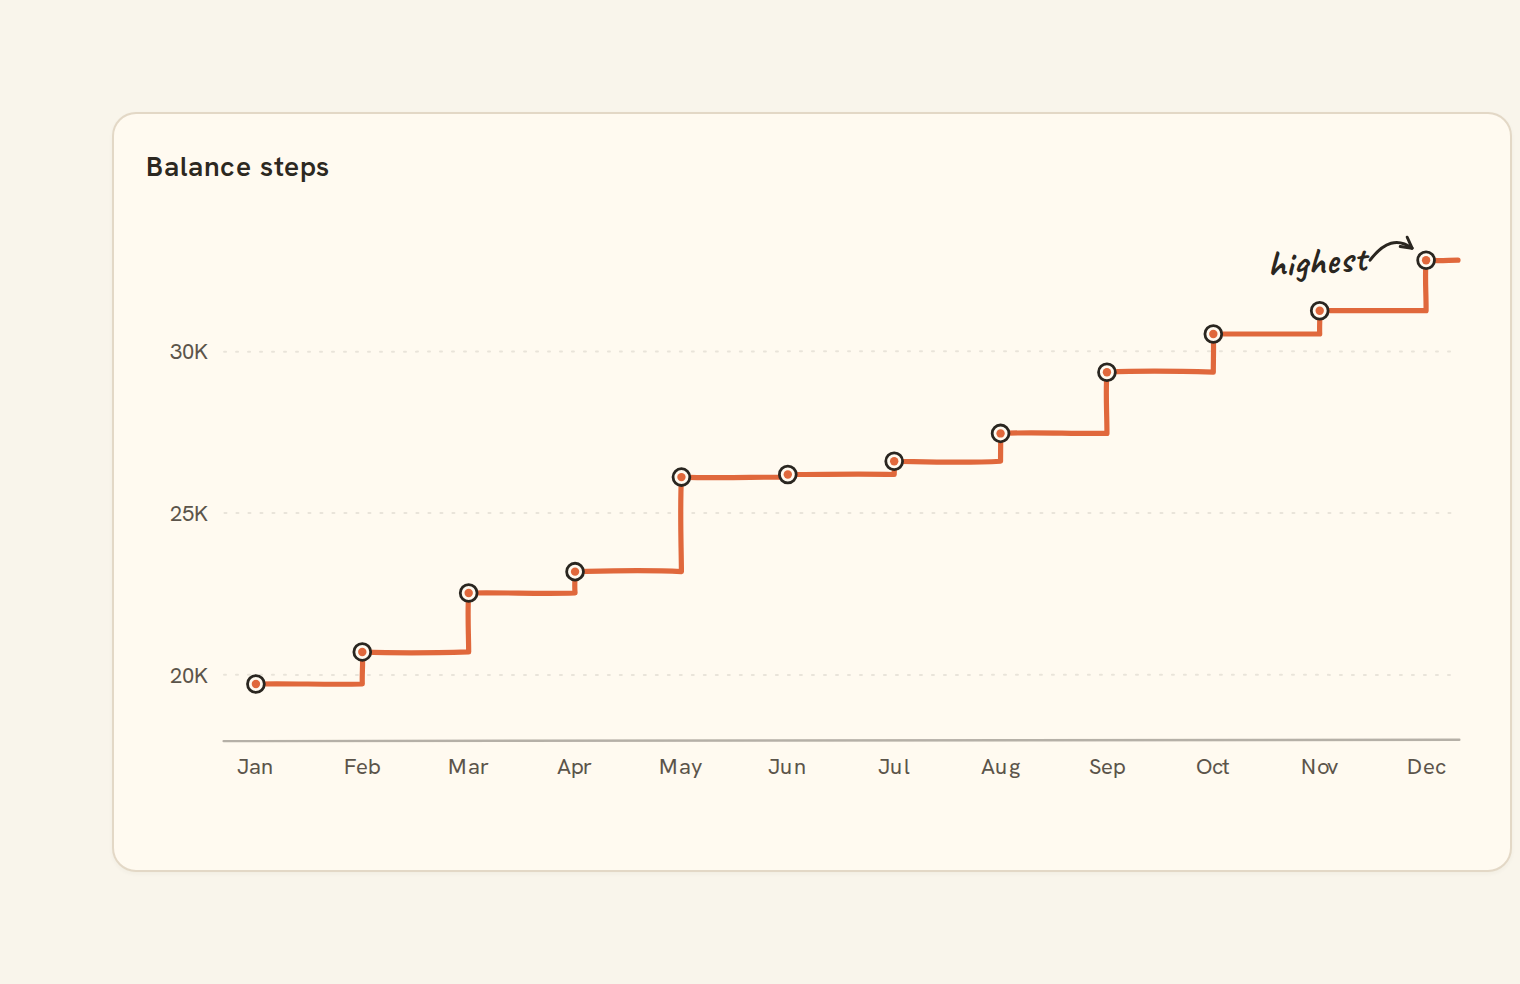
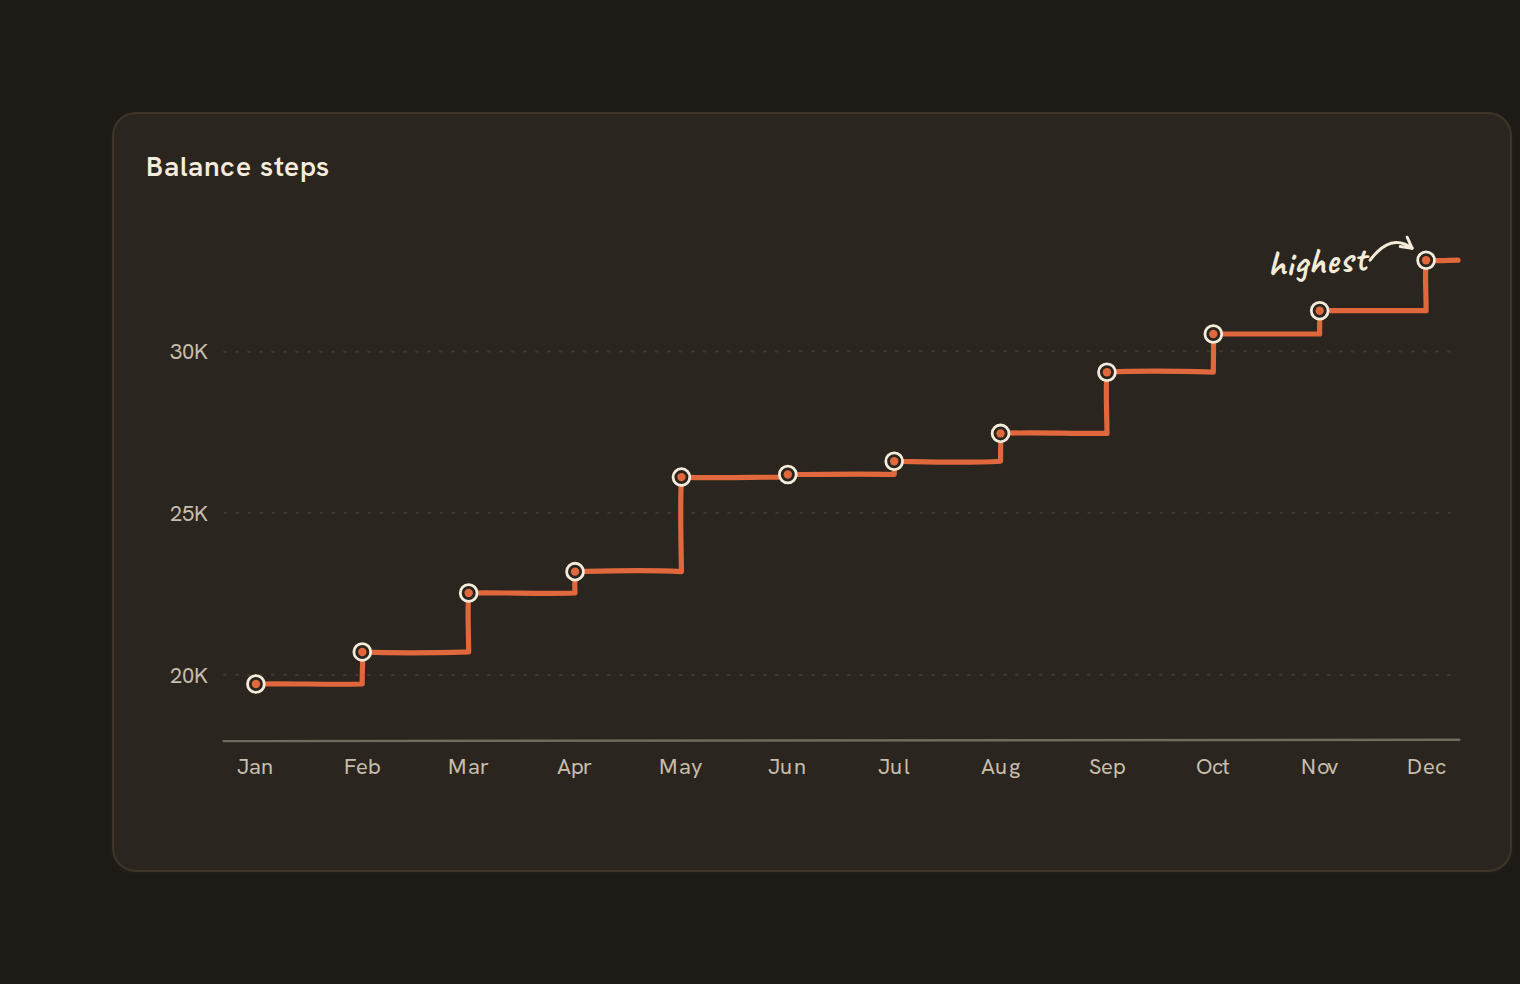 Step lineDiscrete jumps over time
Comparison#
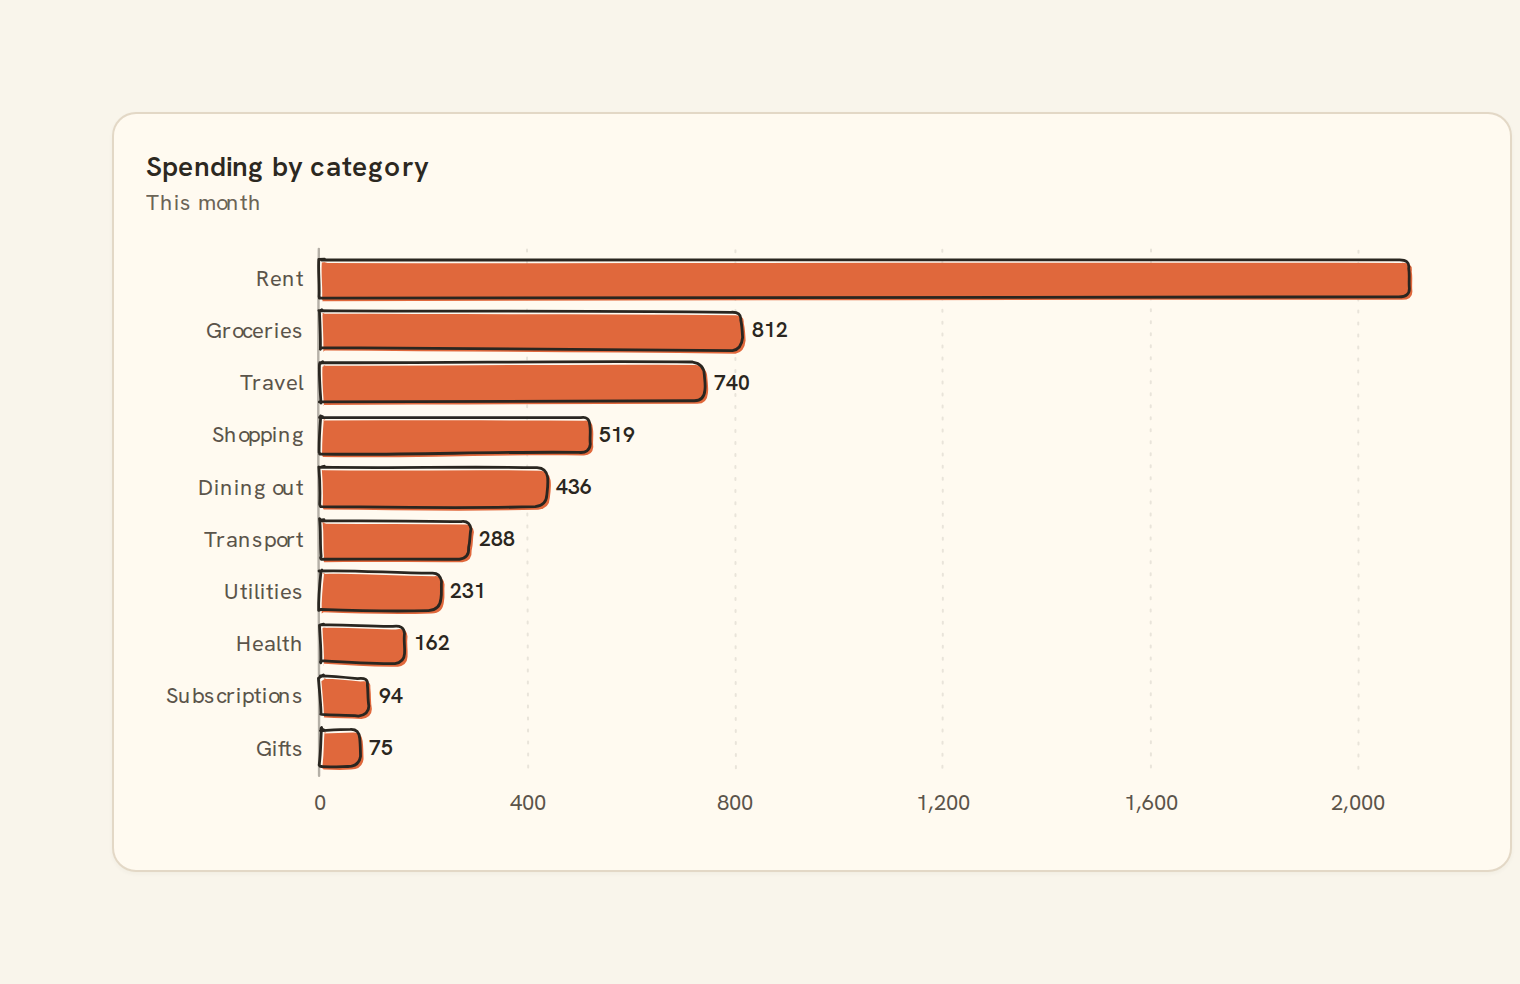
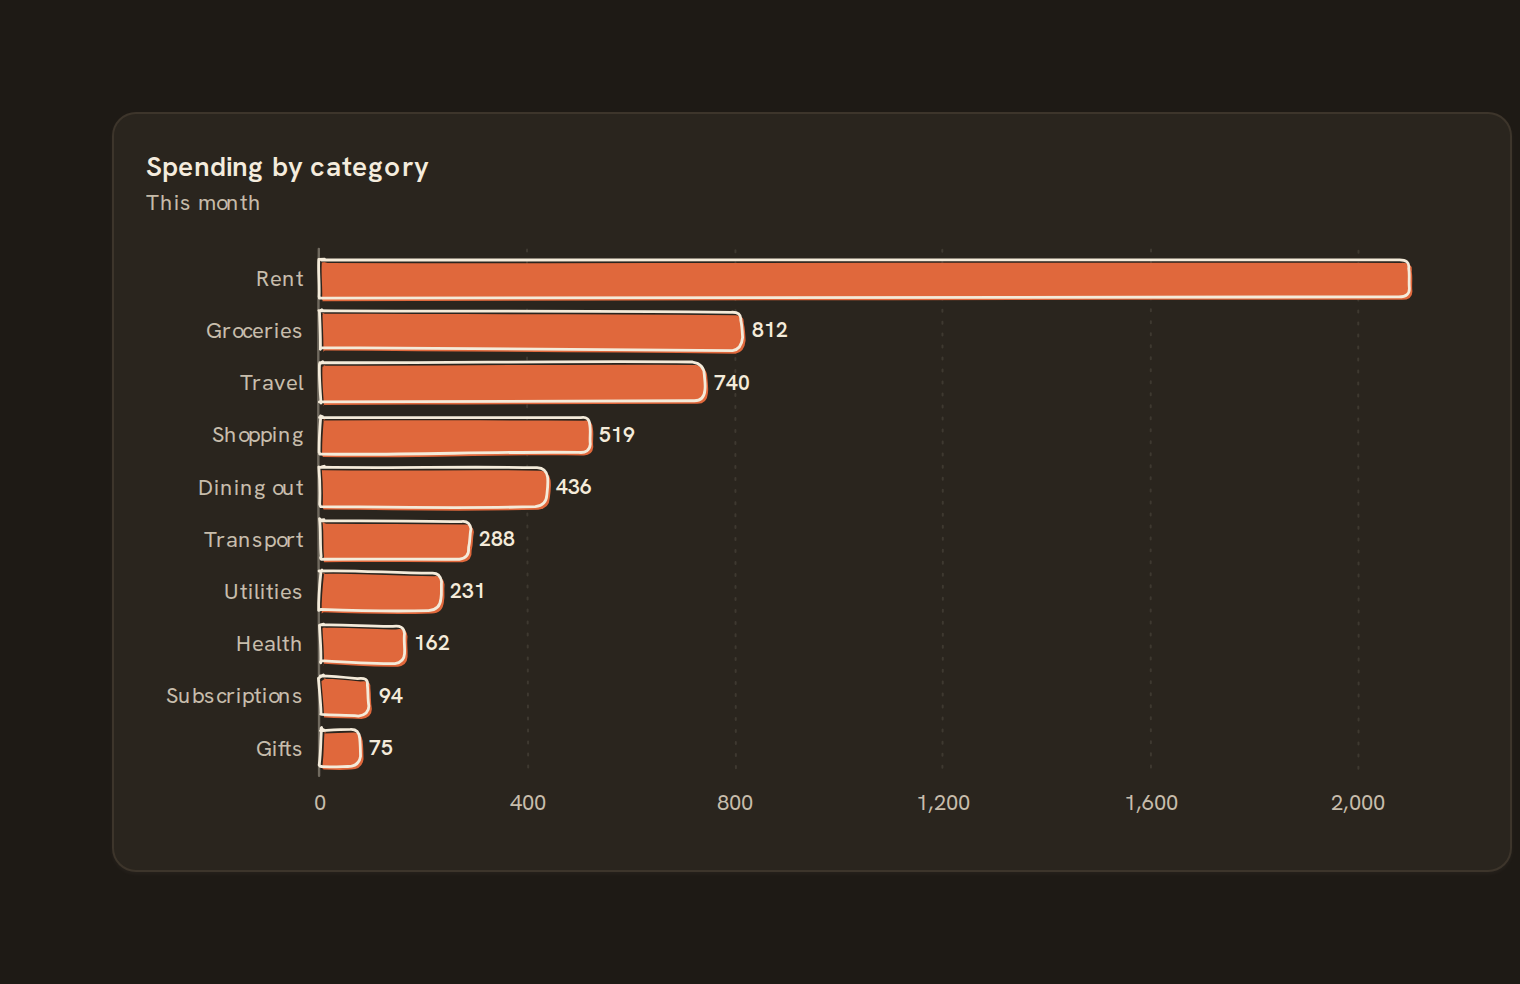 Bar chartHorizontal categorical bars
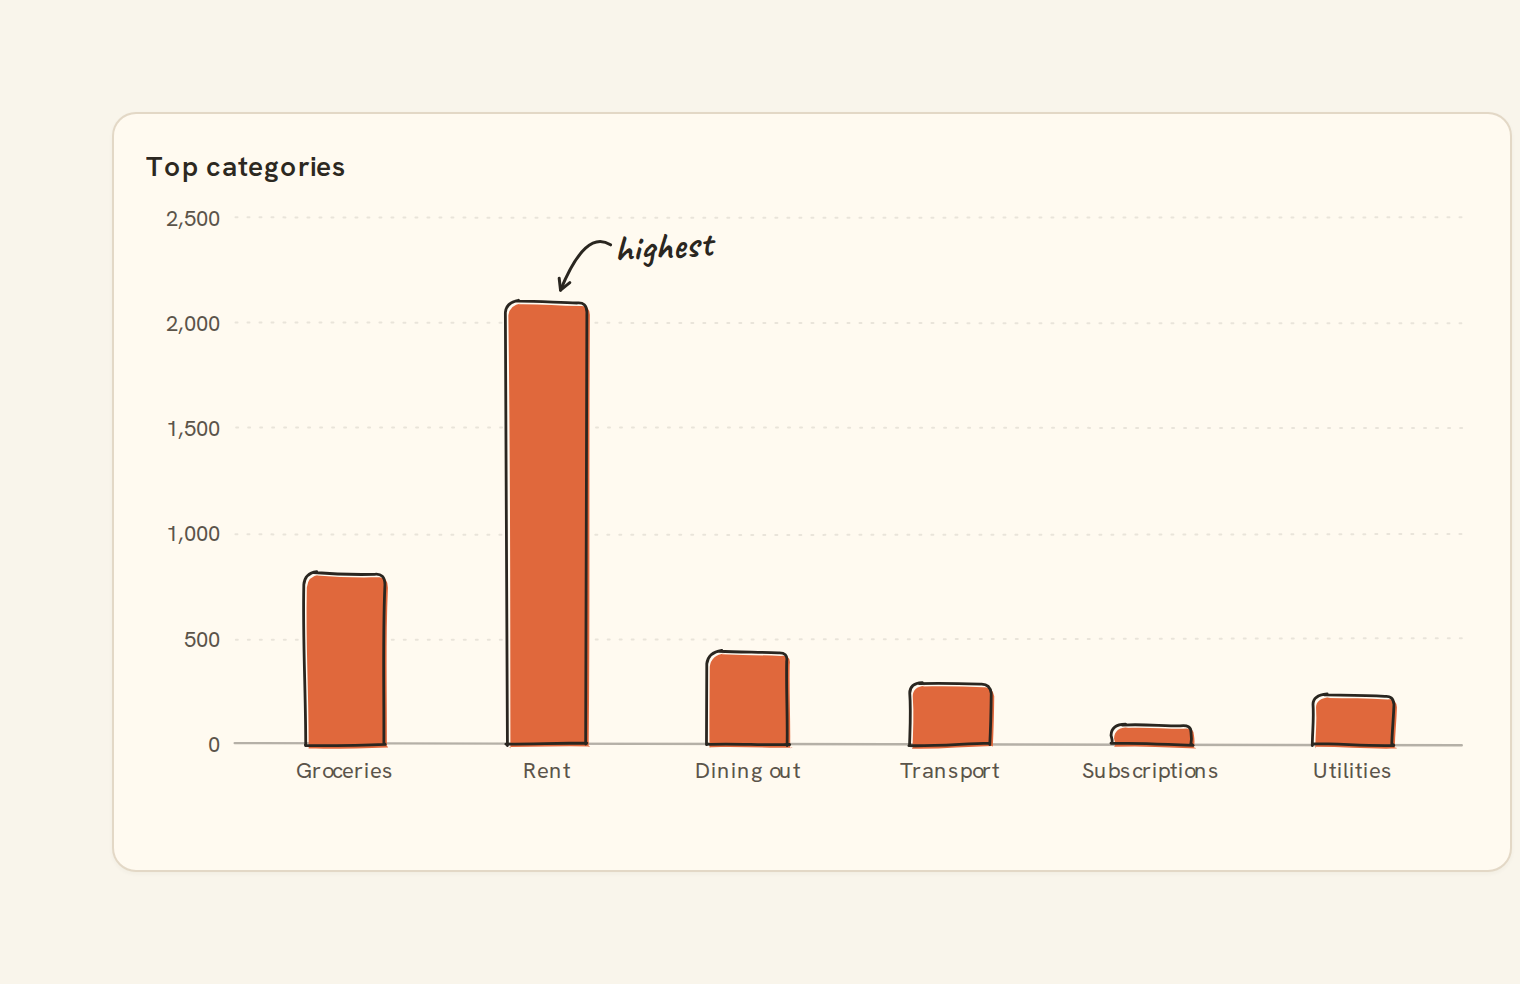
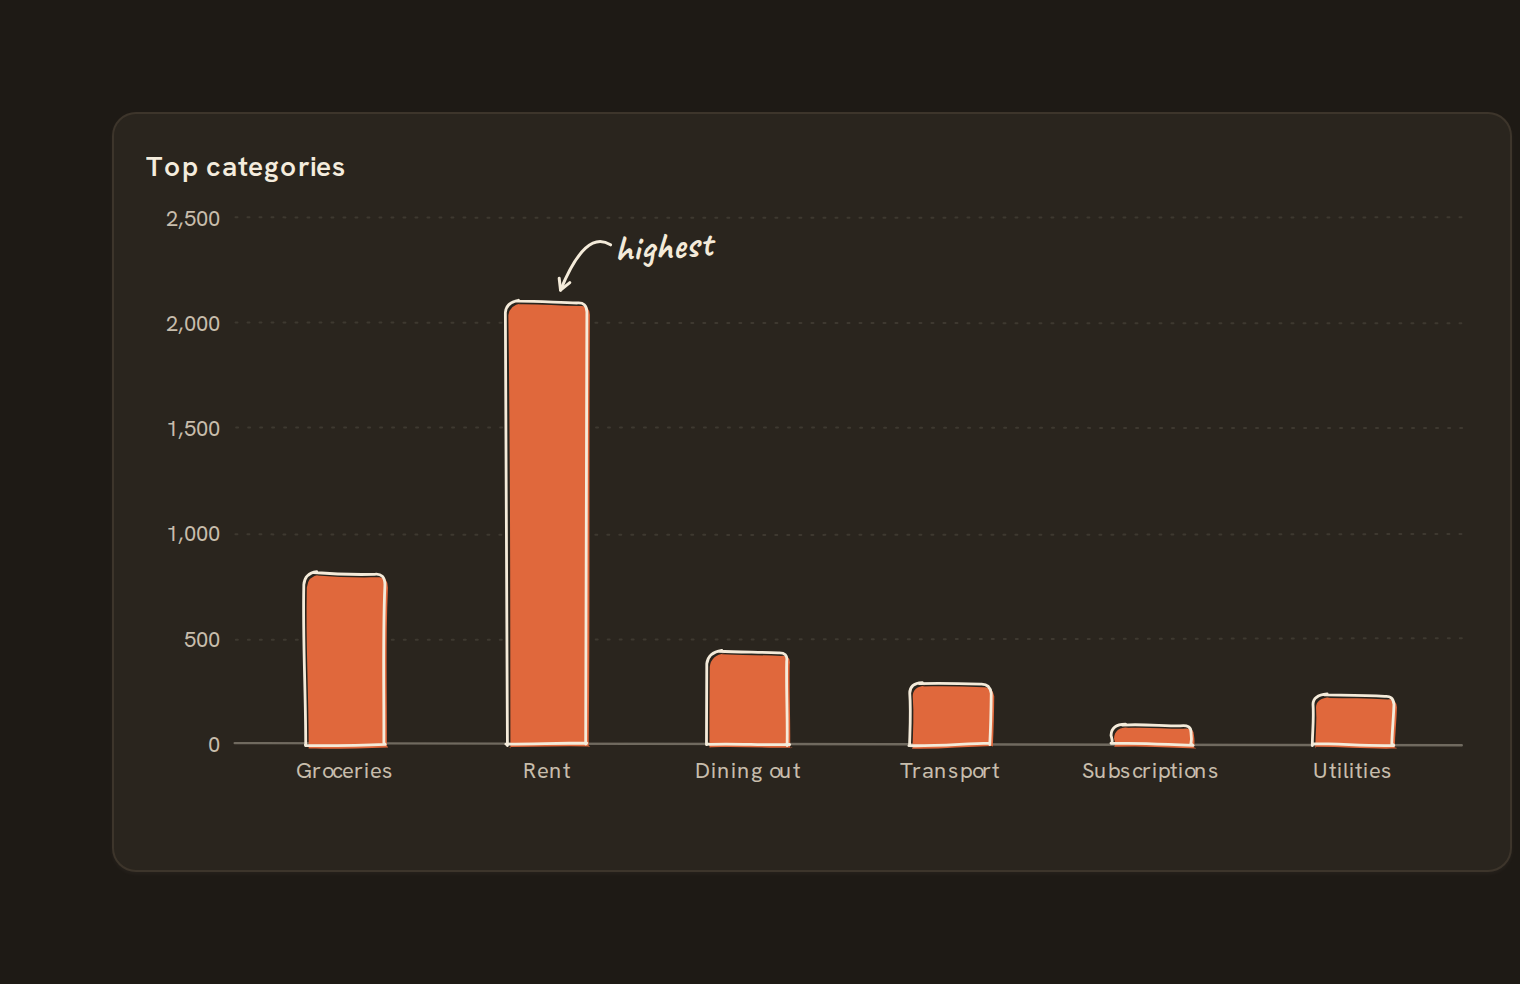 Column chartVertical categorical bars
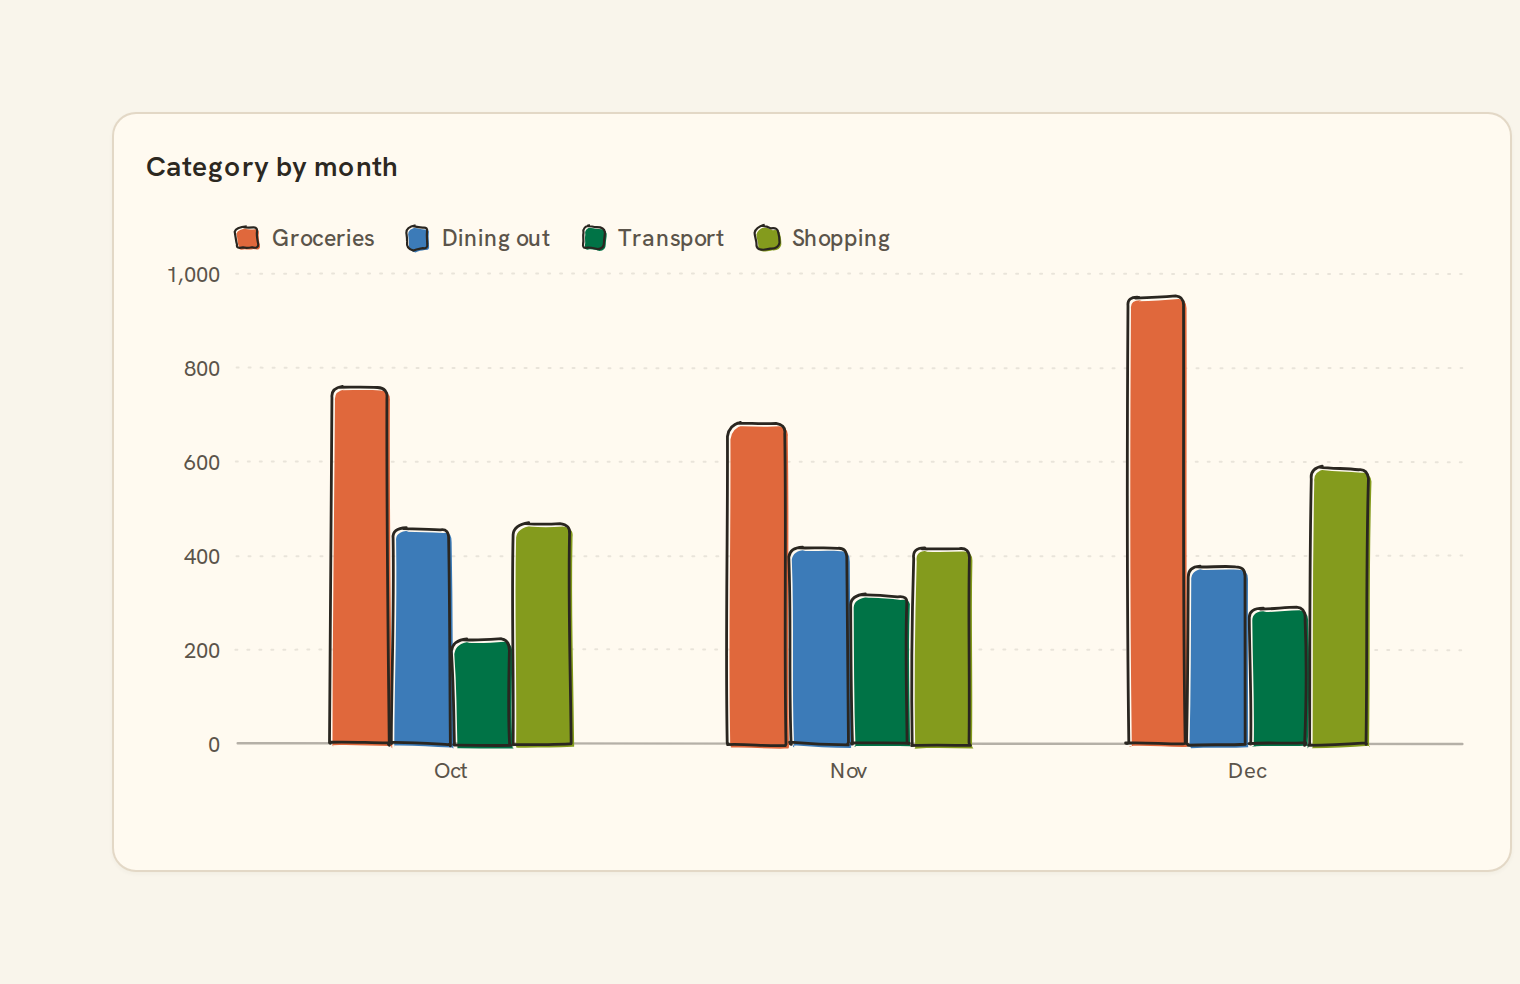
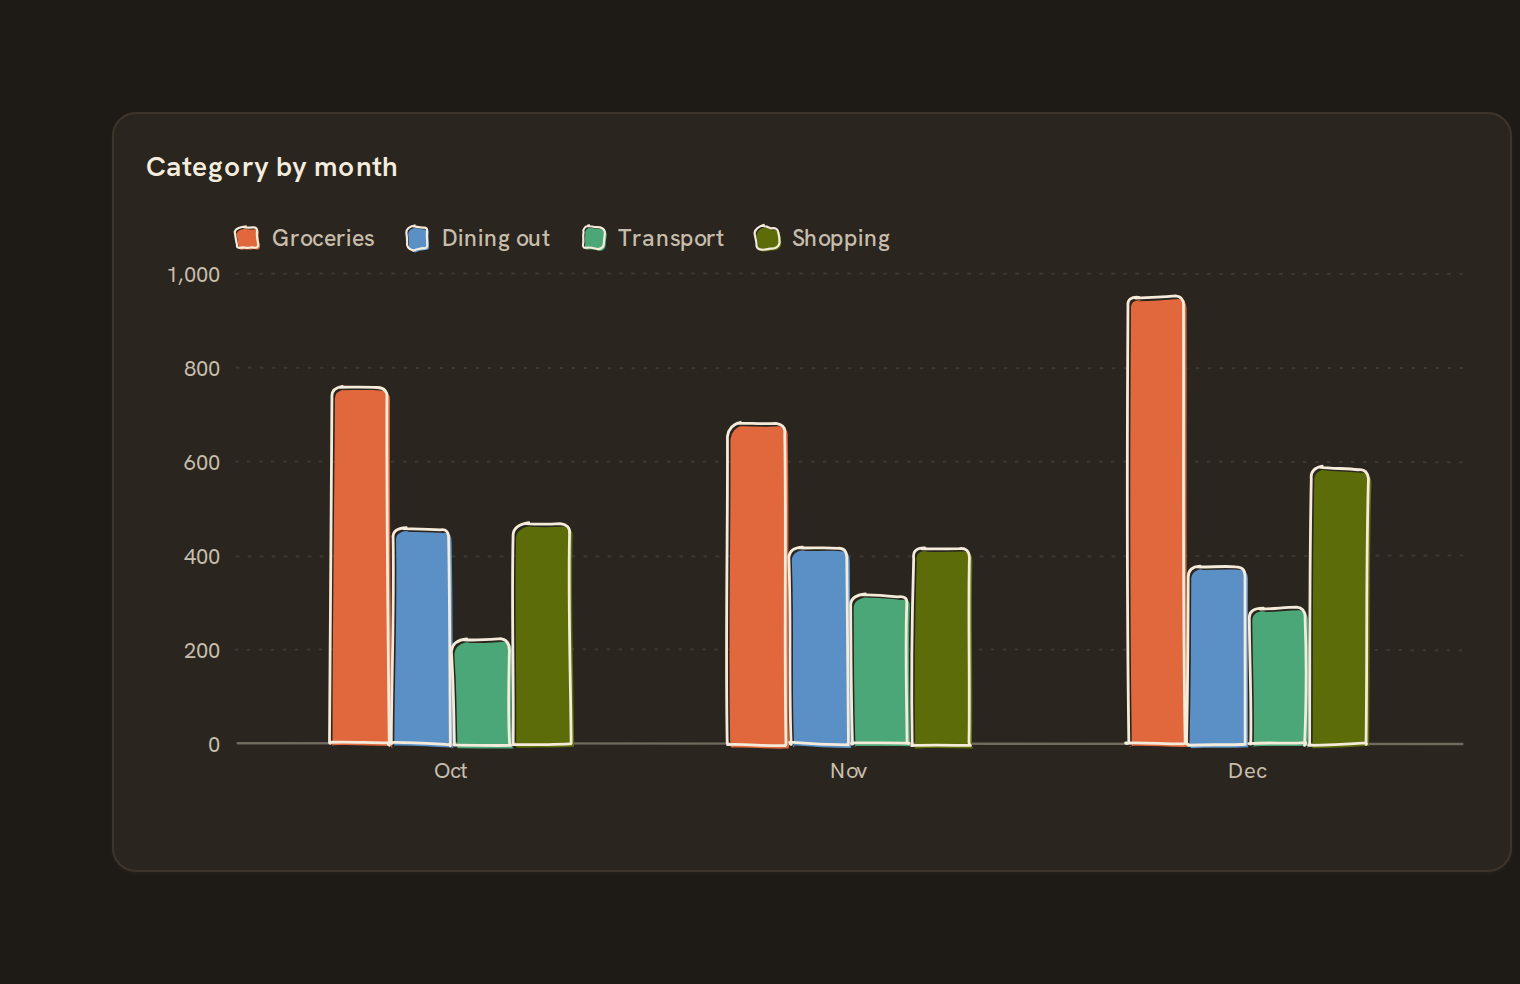 Grouped barSide-by-side bars per series
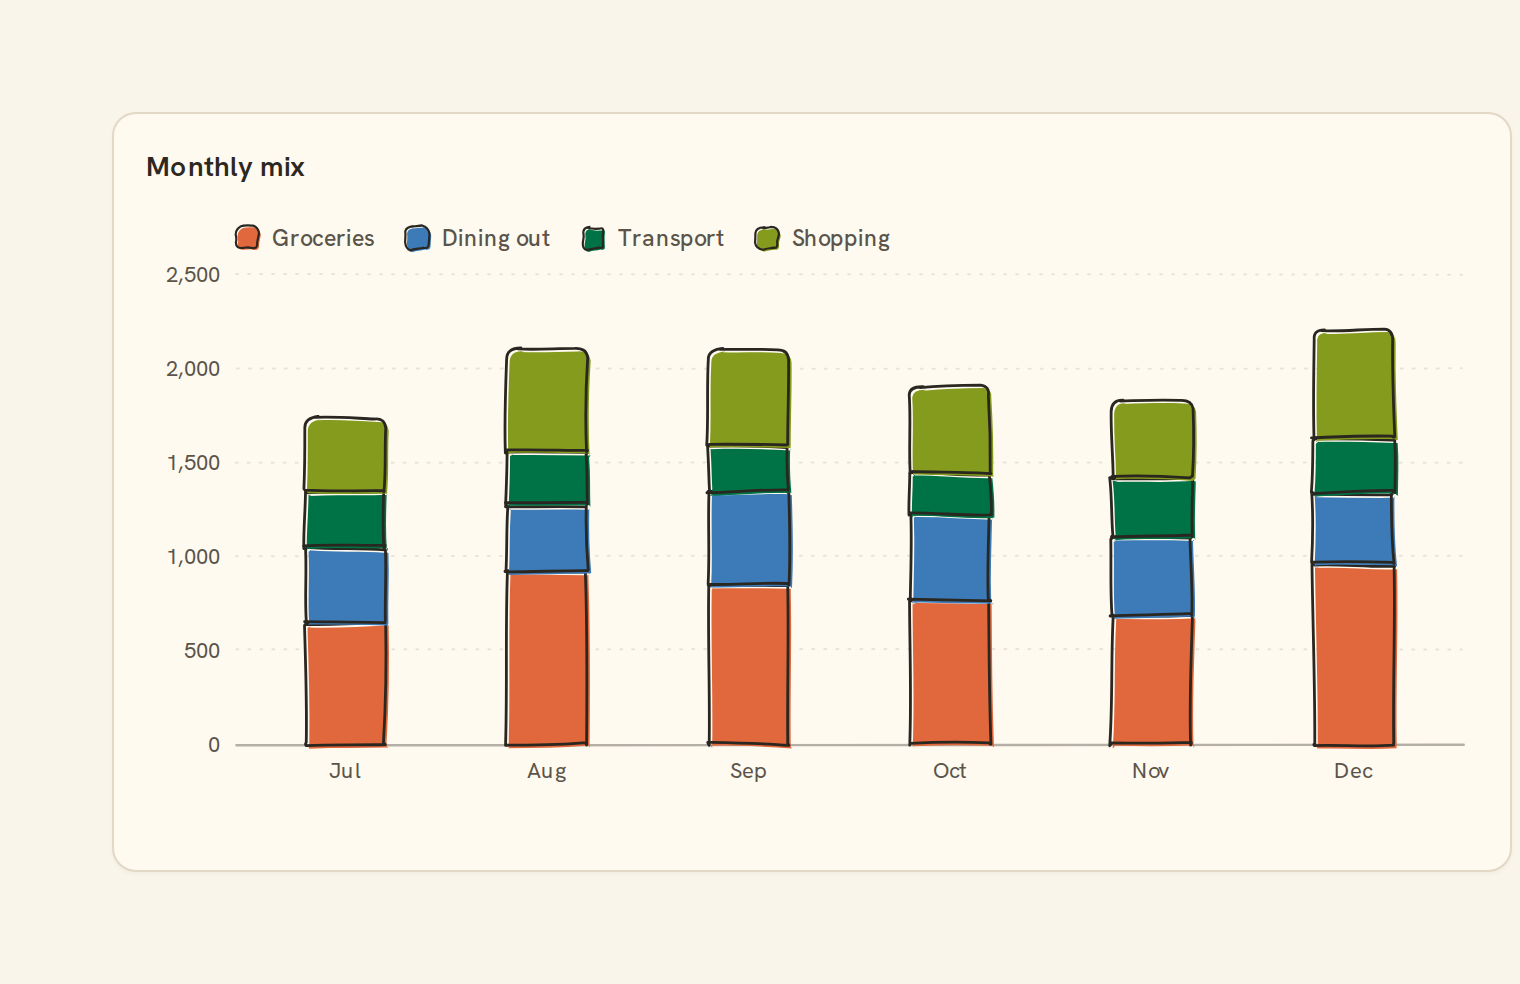
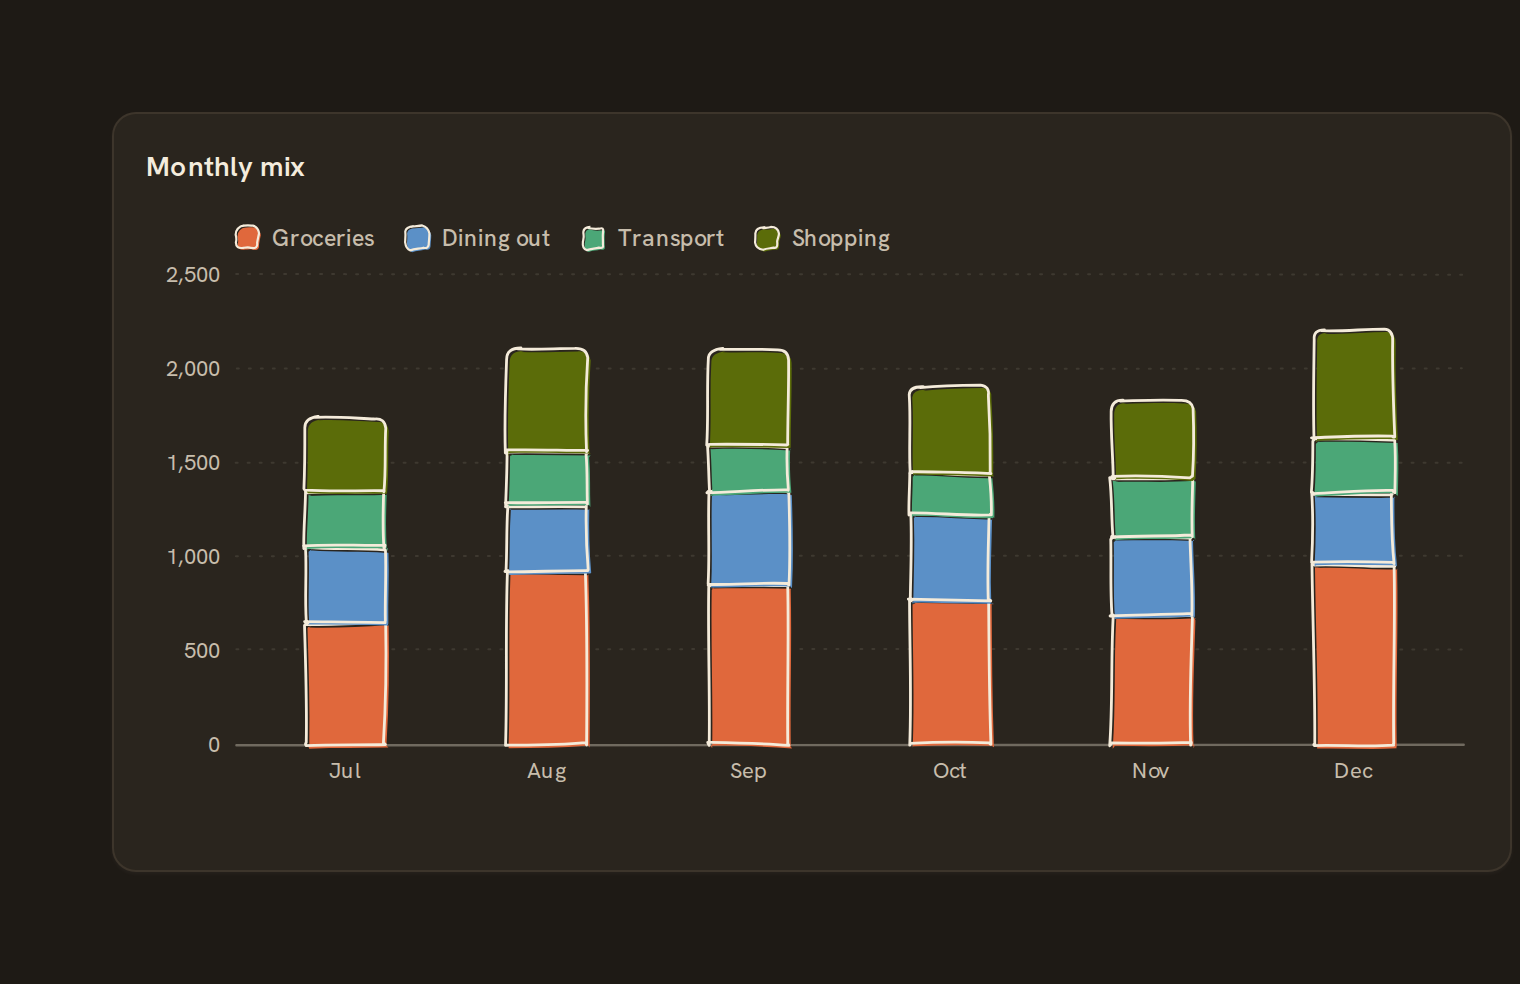 Stacked barComposition per category
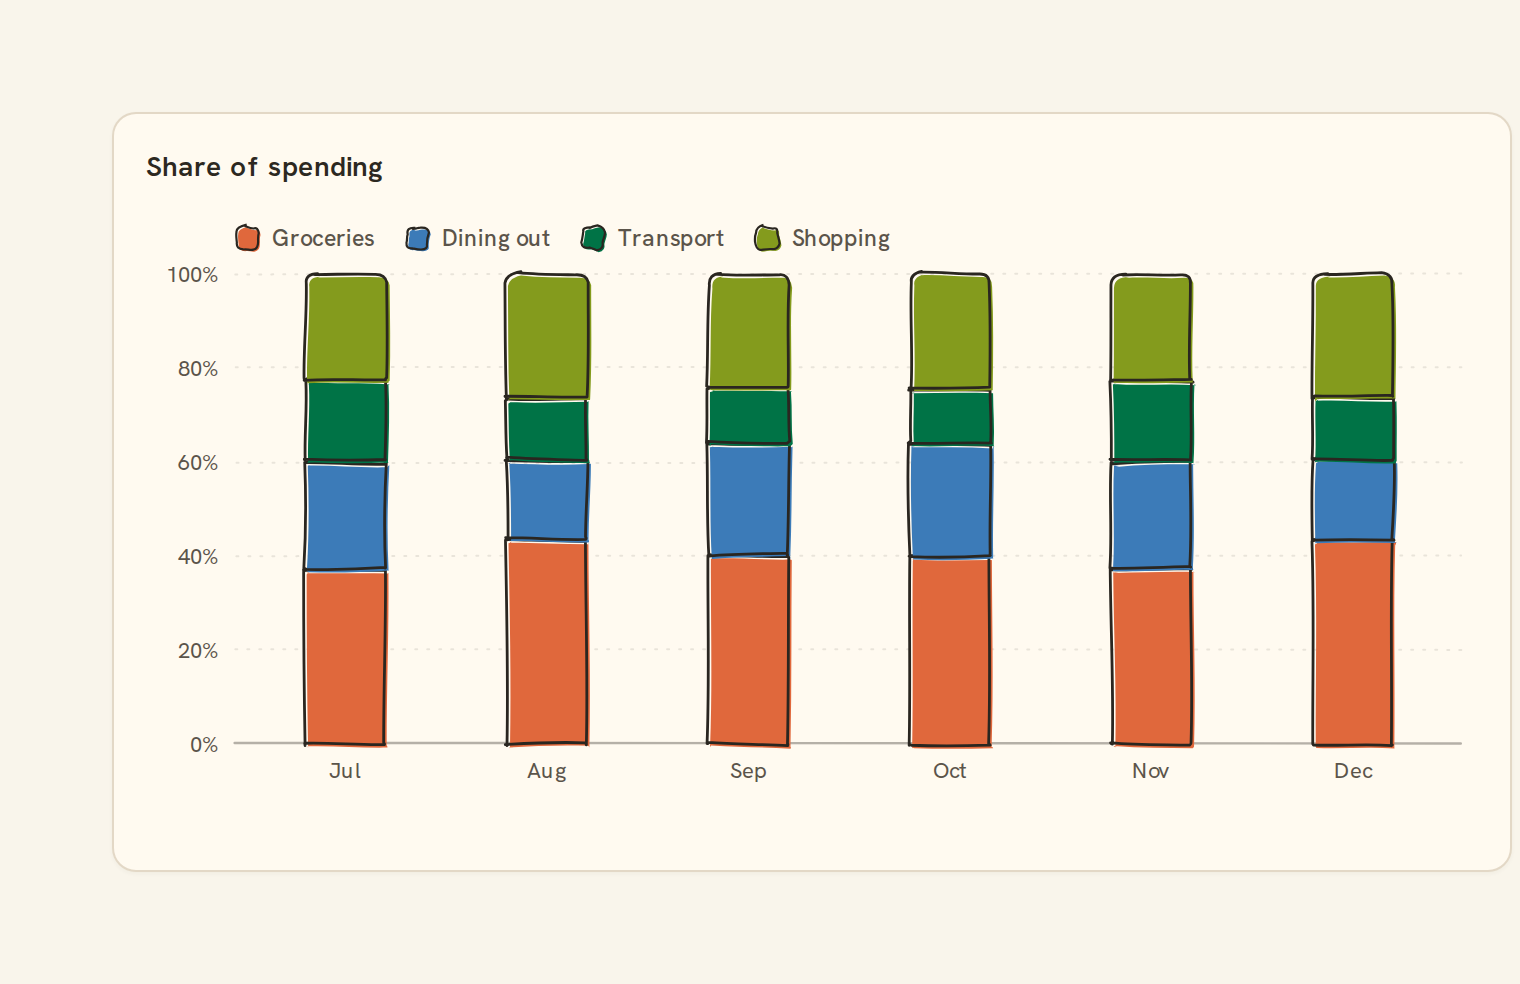
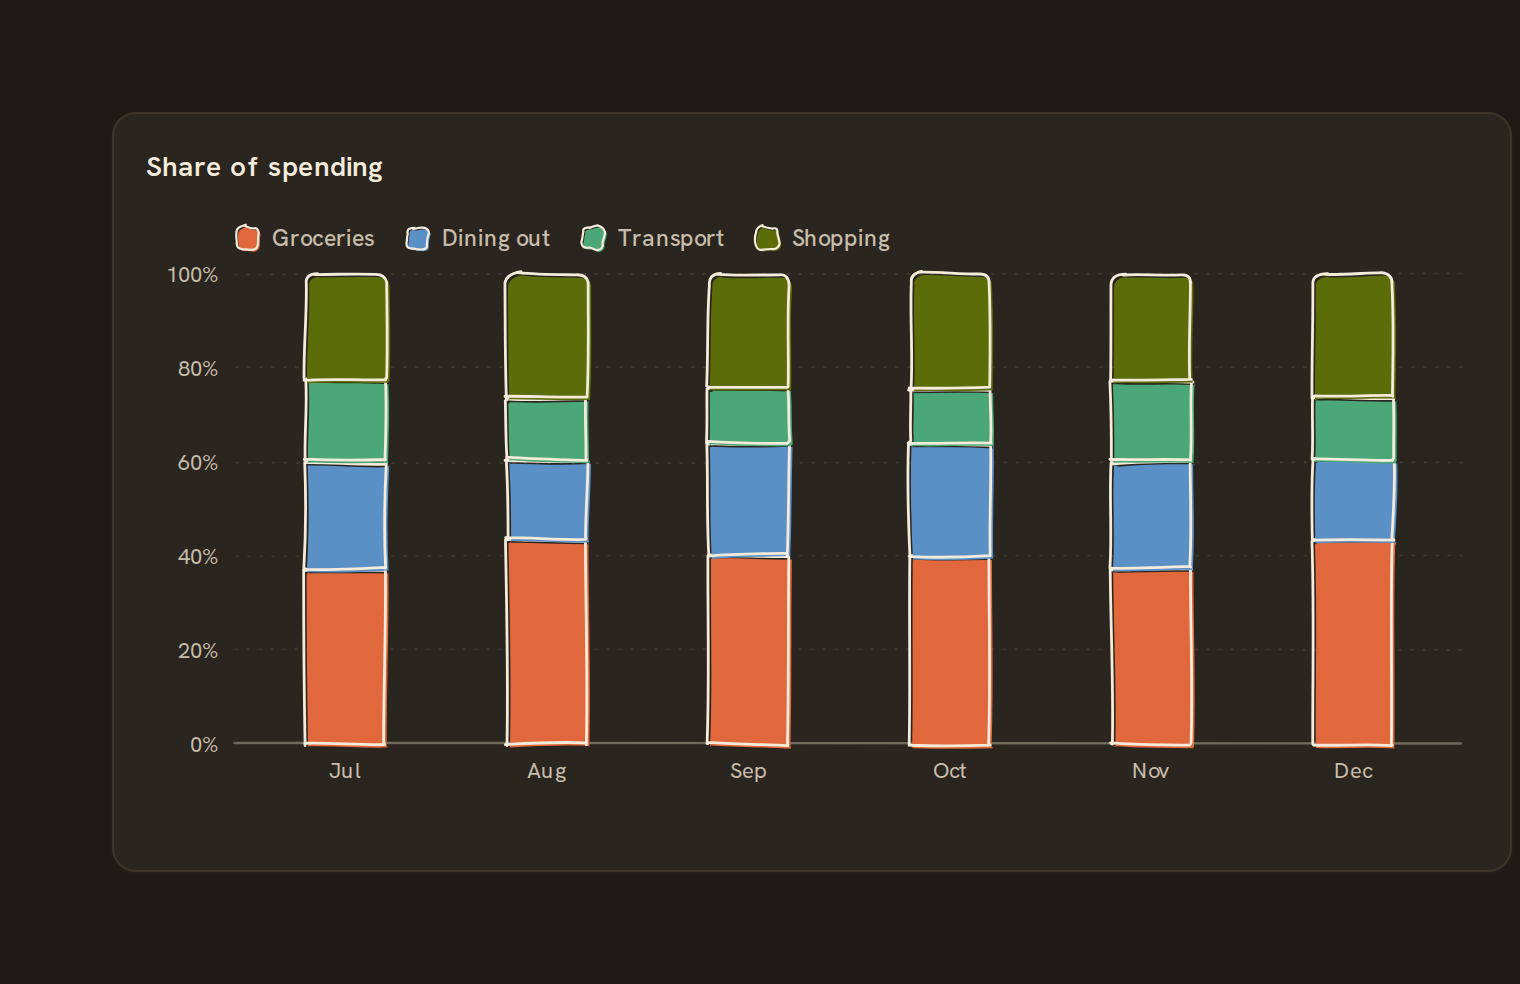 100% stacked barComposition as percentage
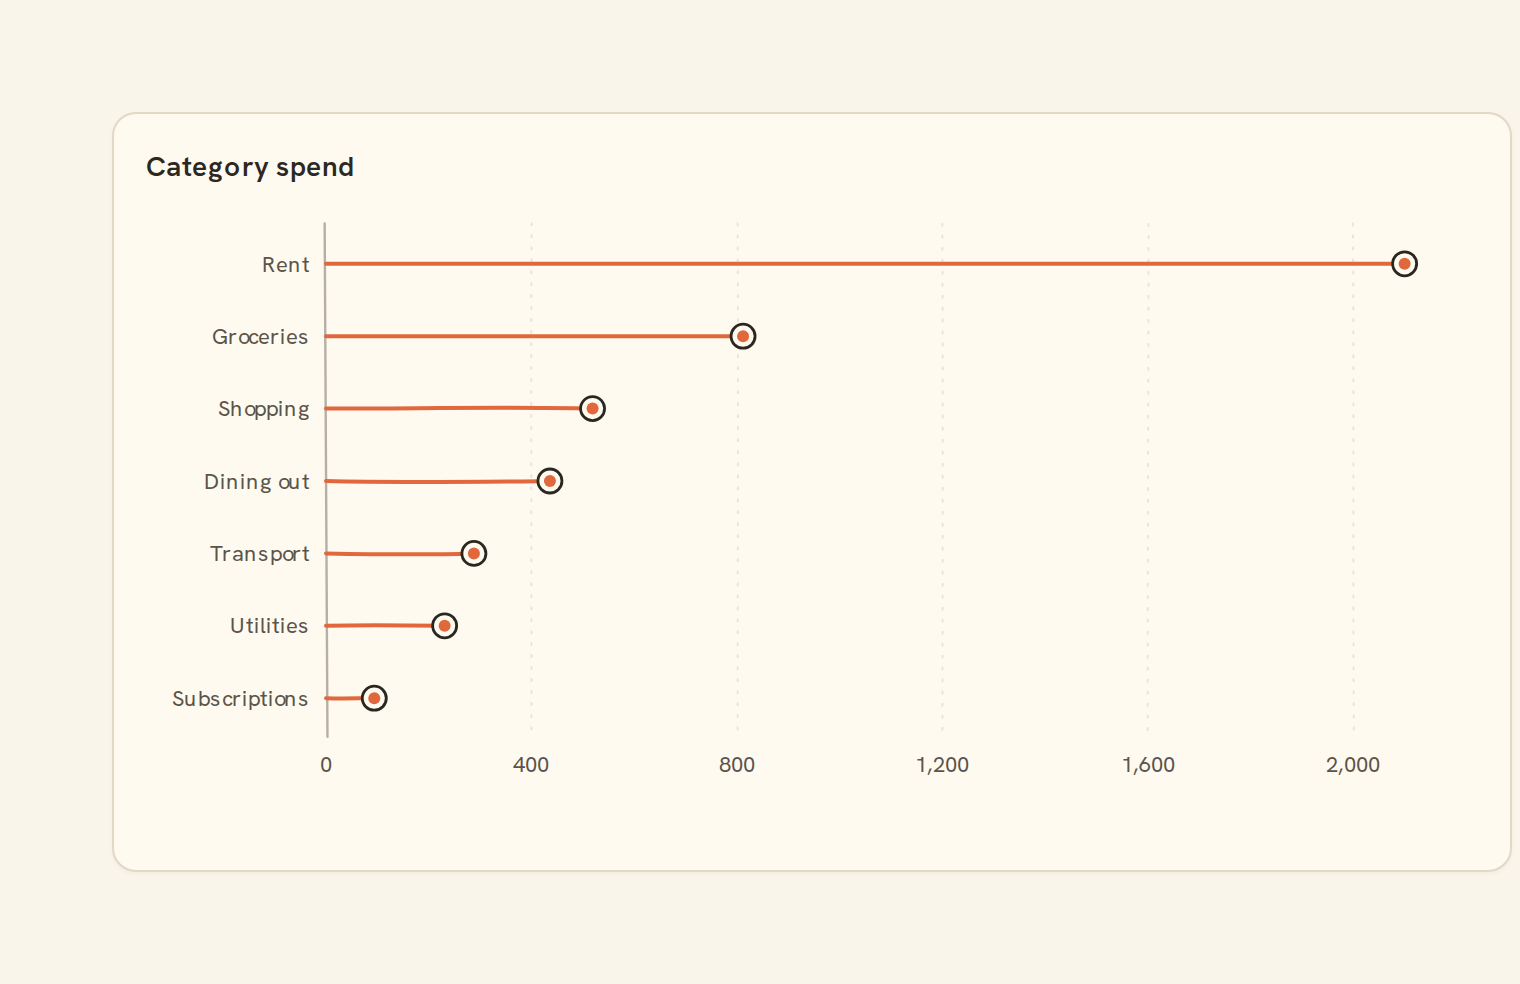
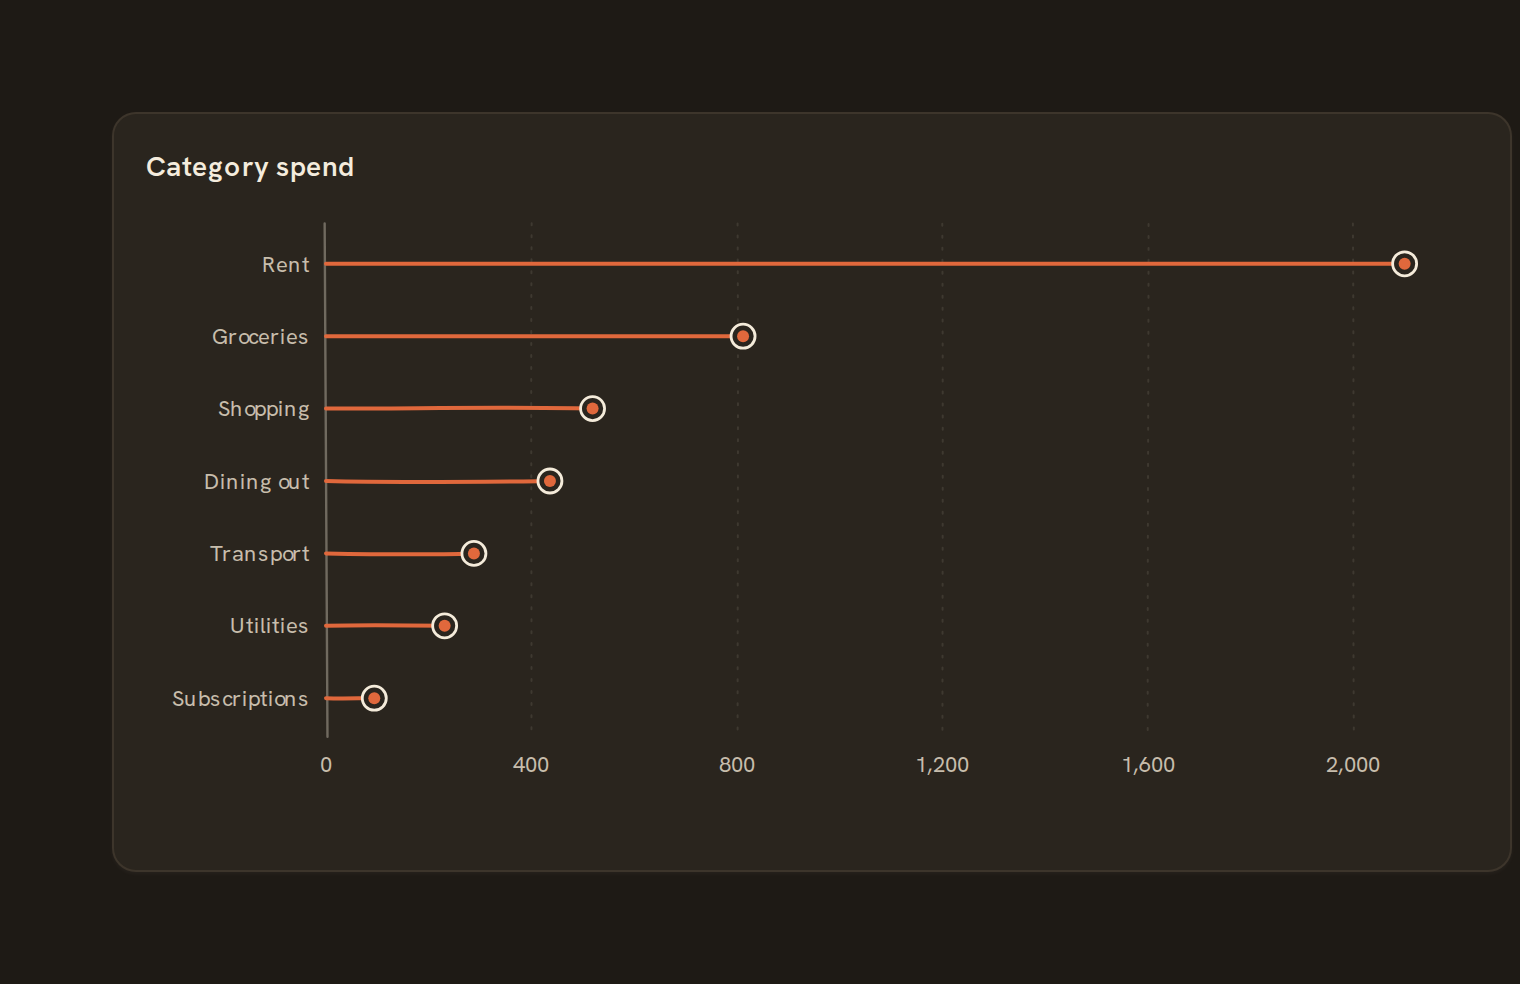 LollipopBars with circle endpoints
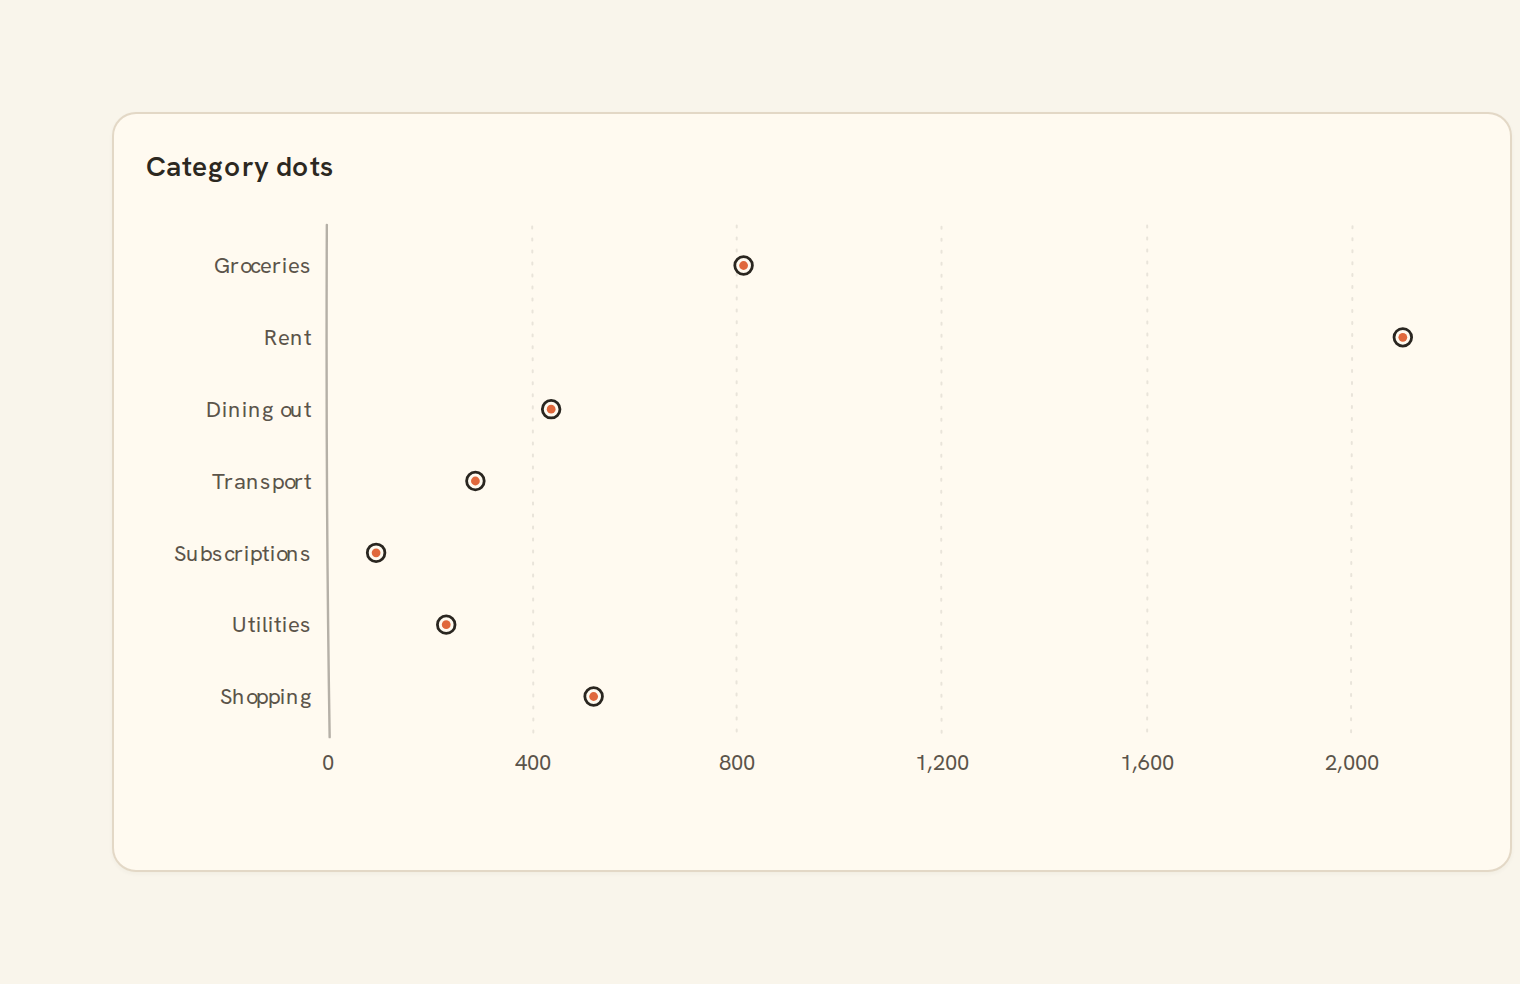
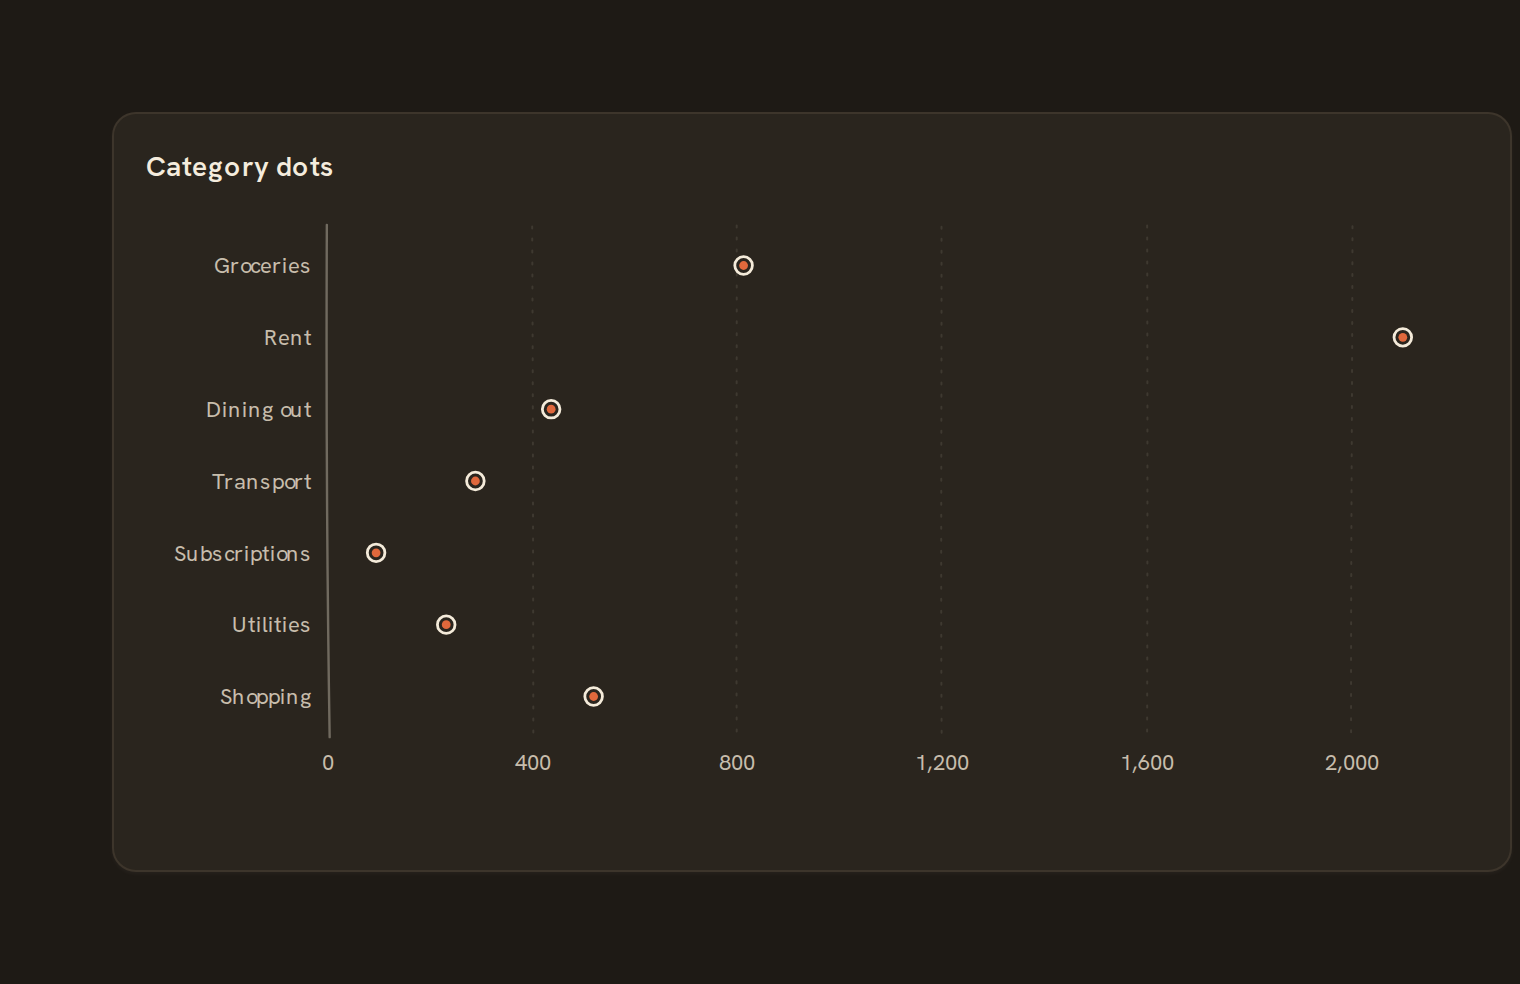 Dot plotDiscrete category dots
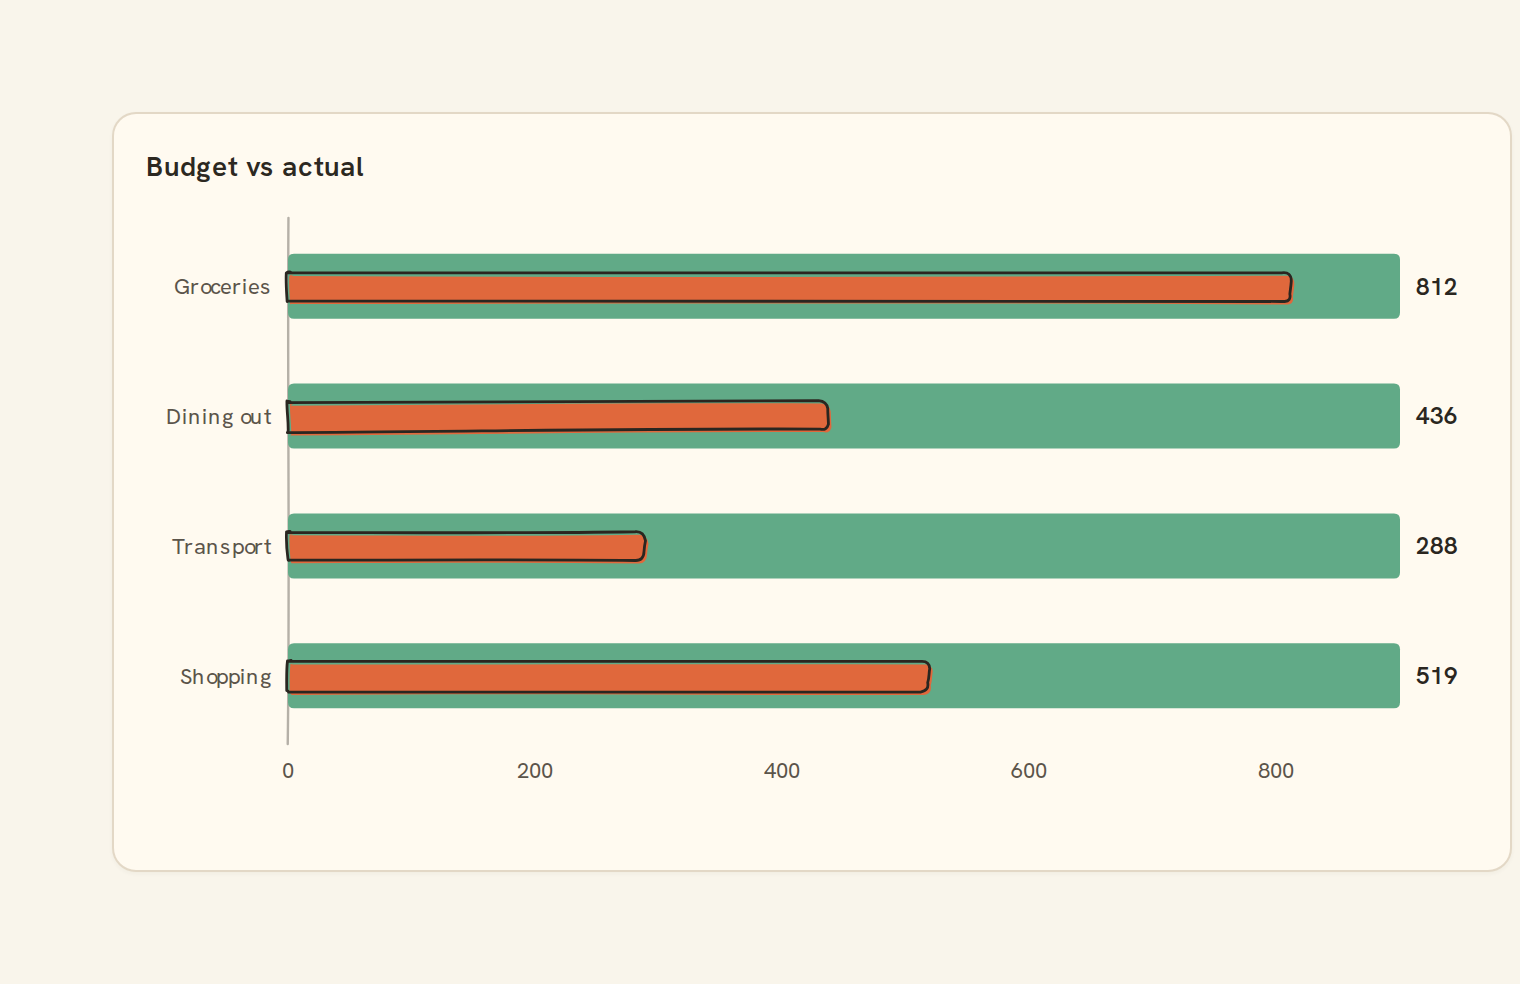
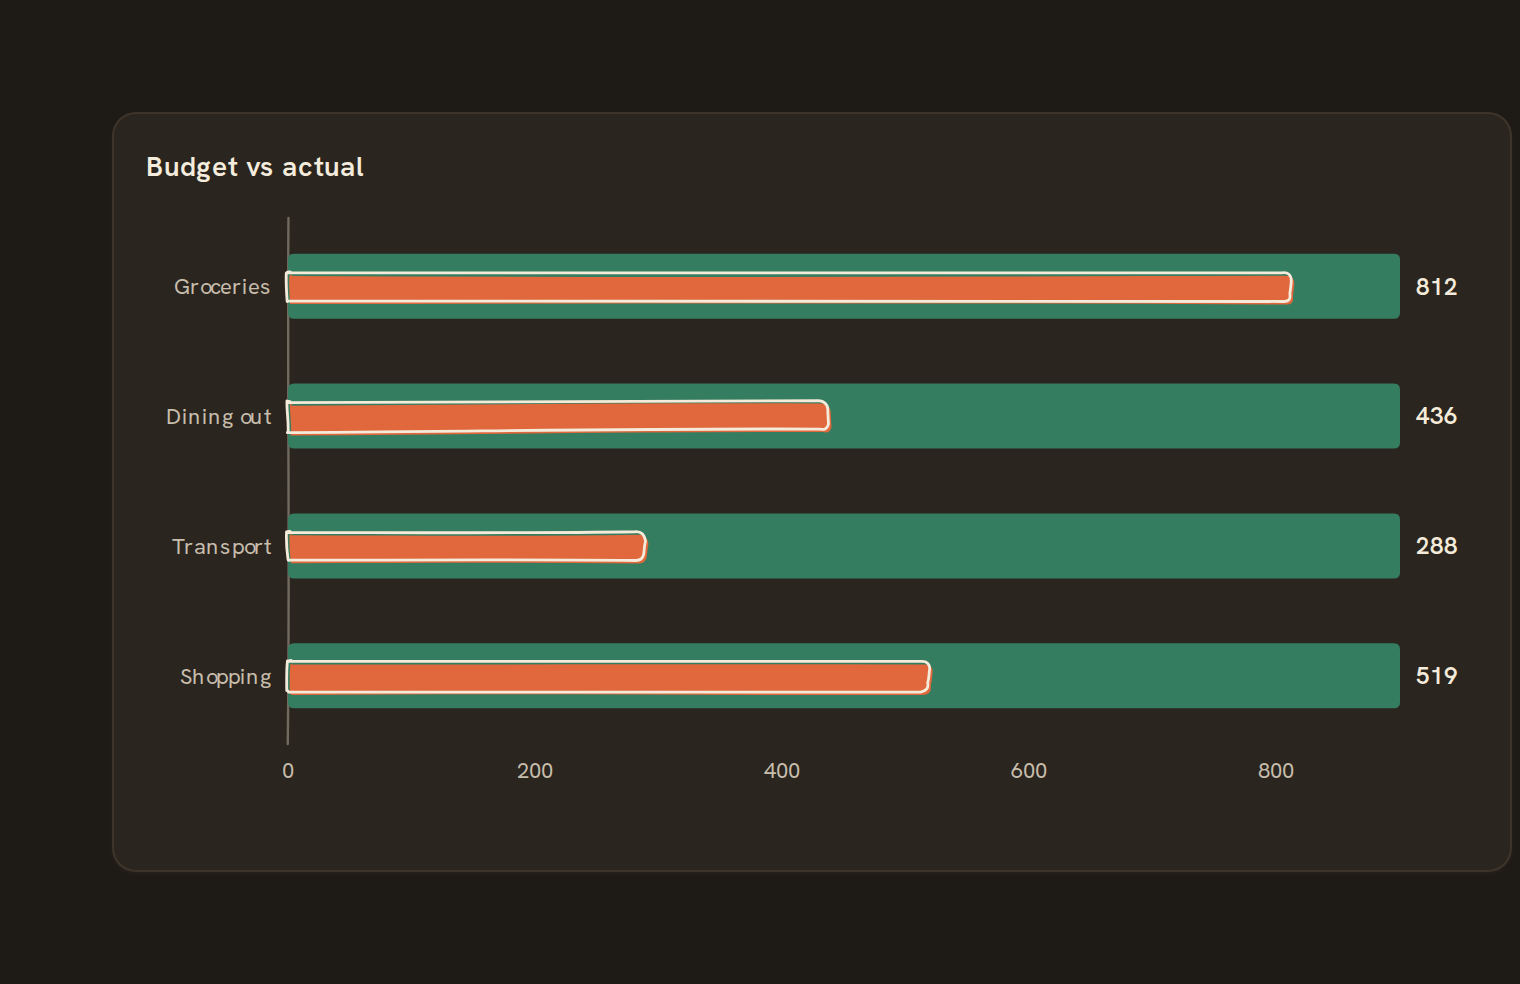 Bullet chartSingle value with target bands
Distribution#
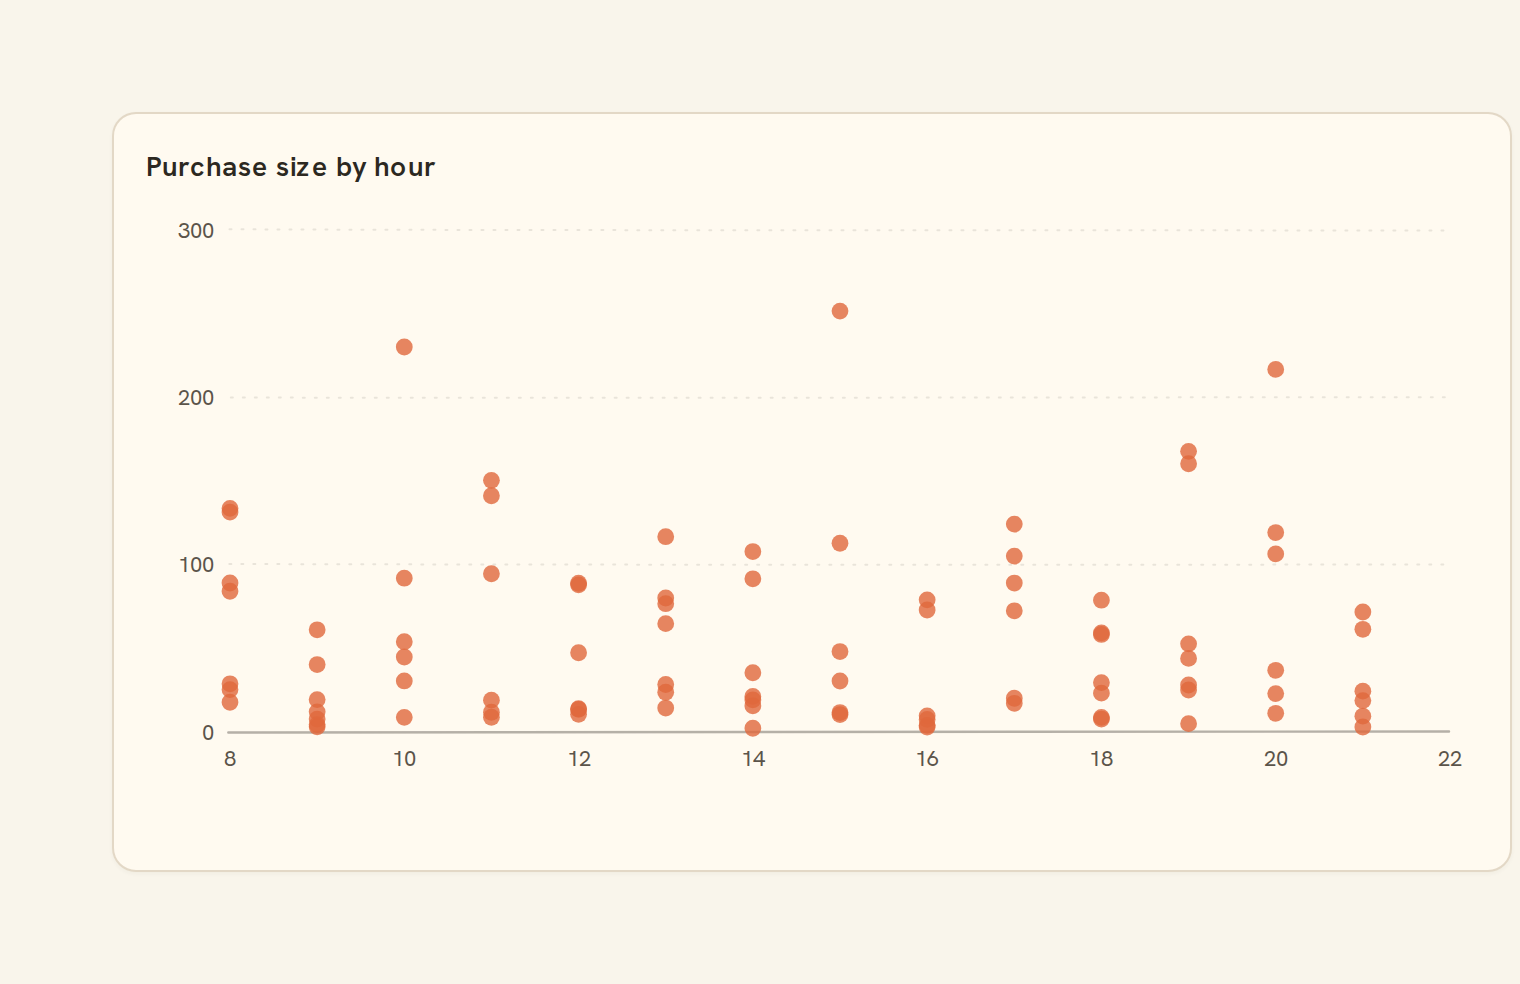
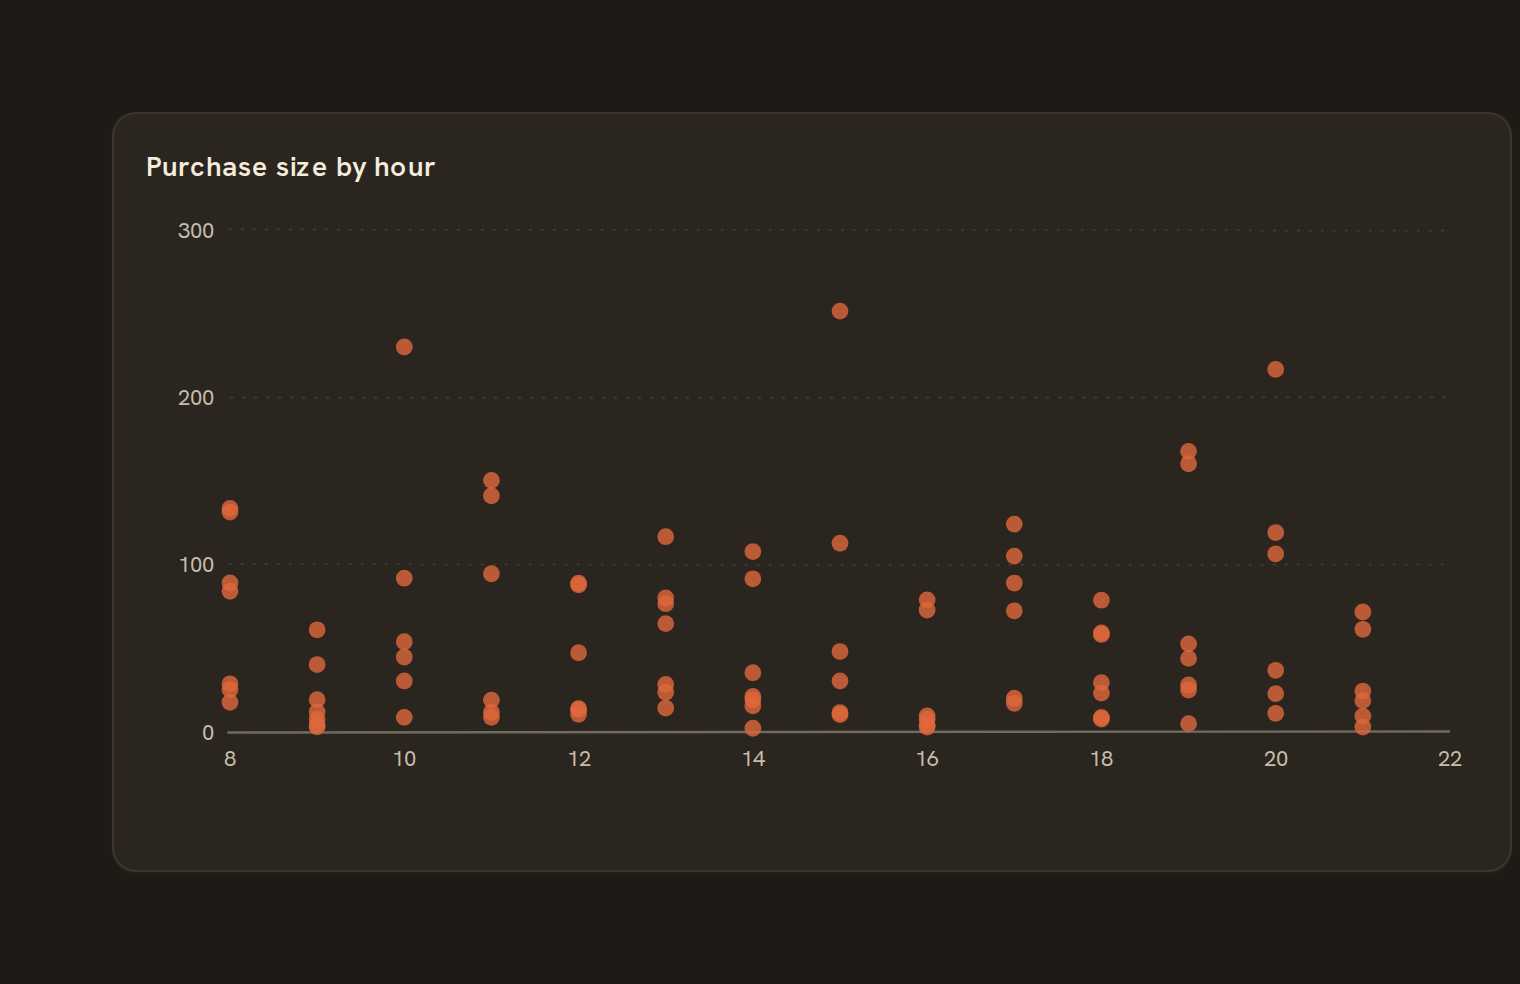 Scatter plotTwo measures on x/y
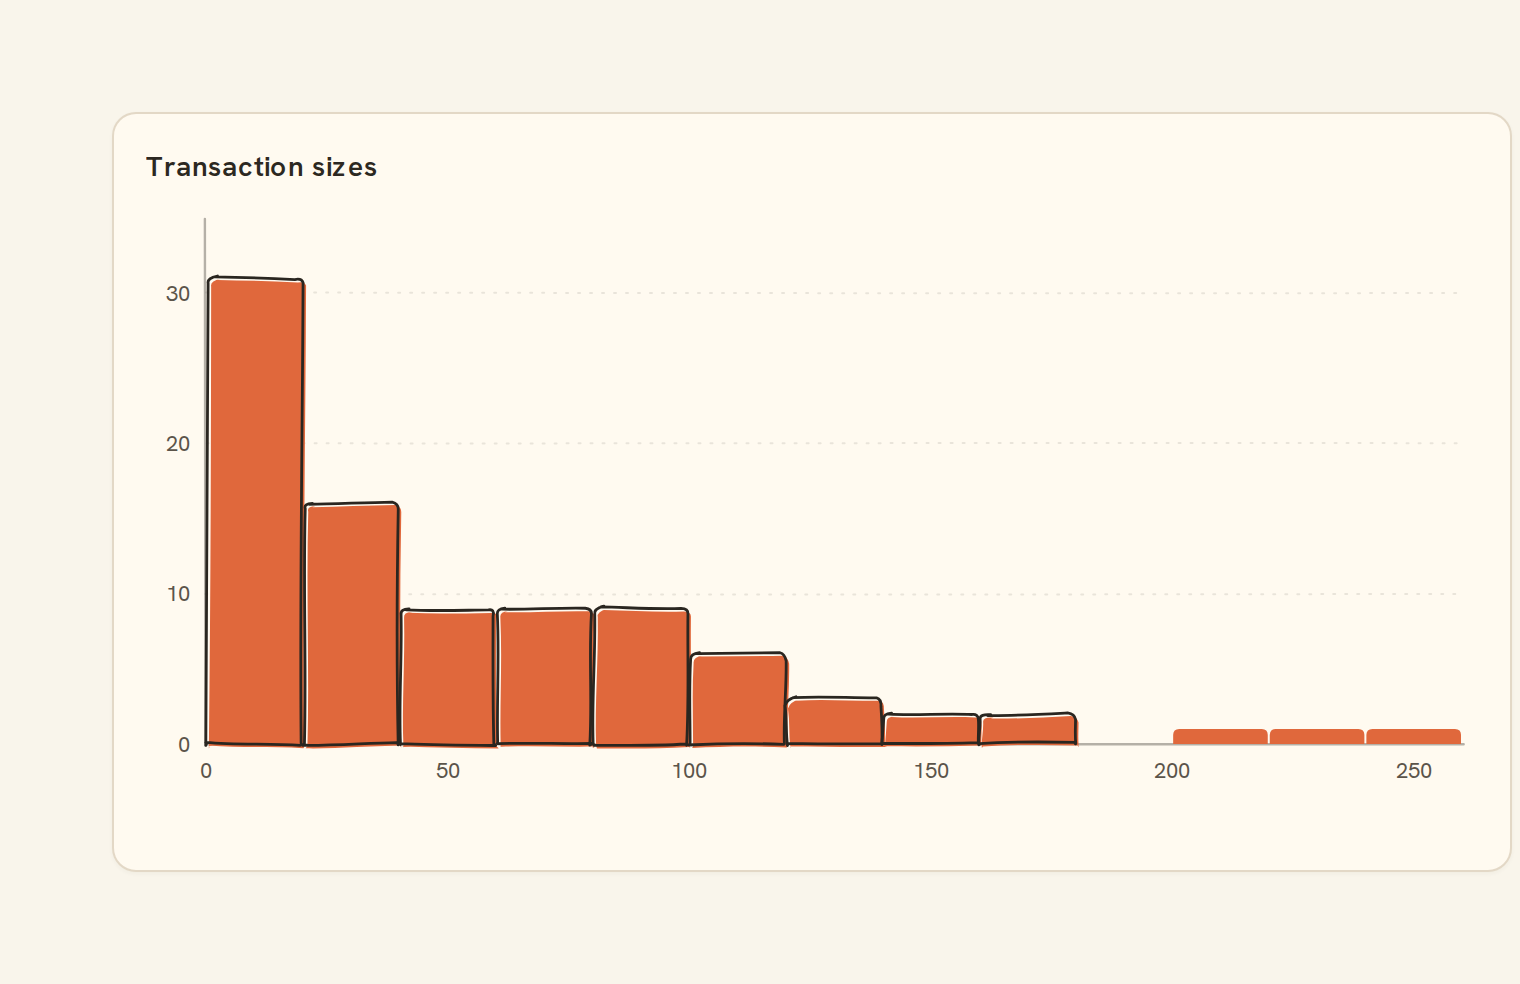
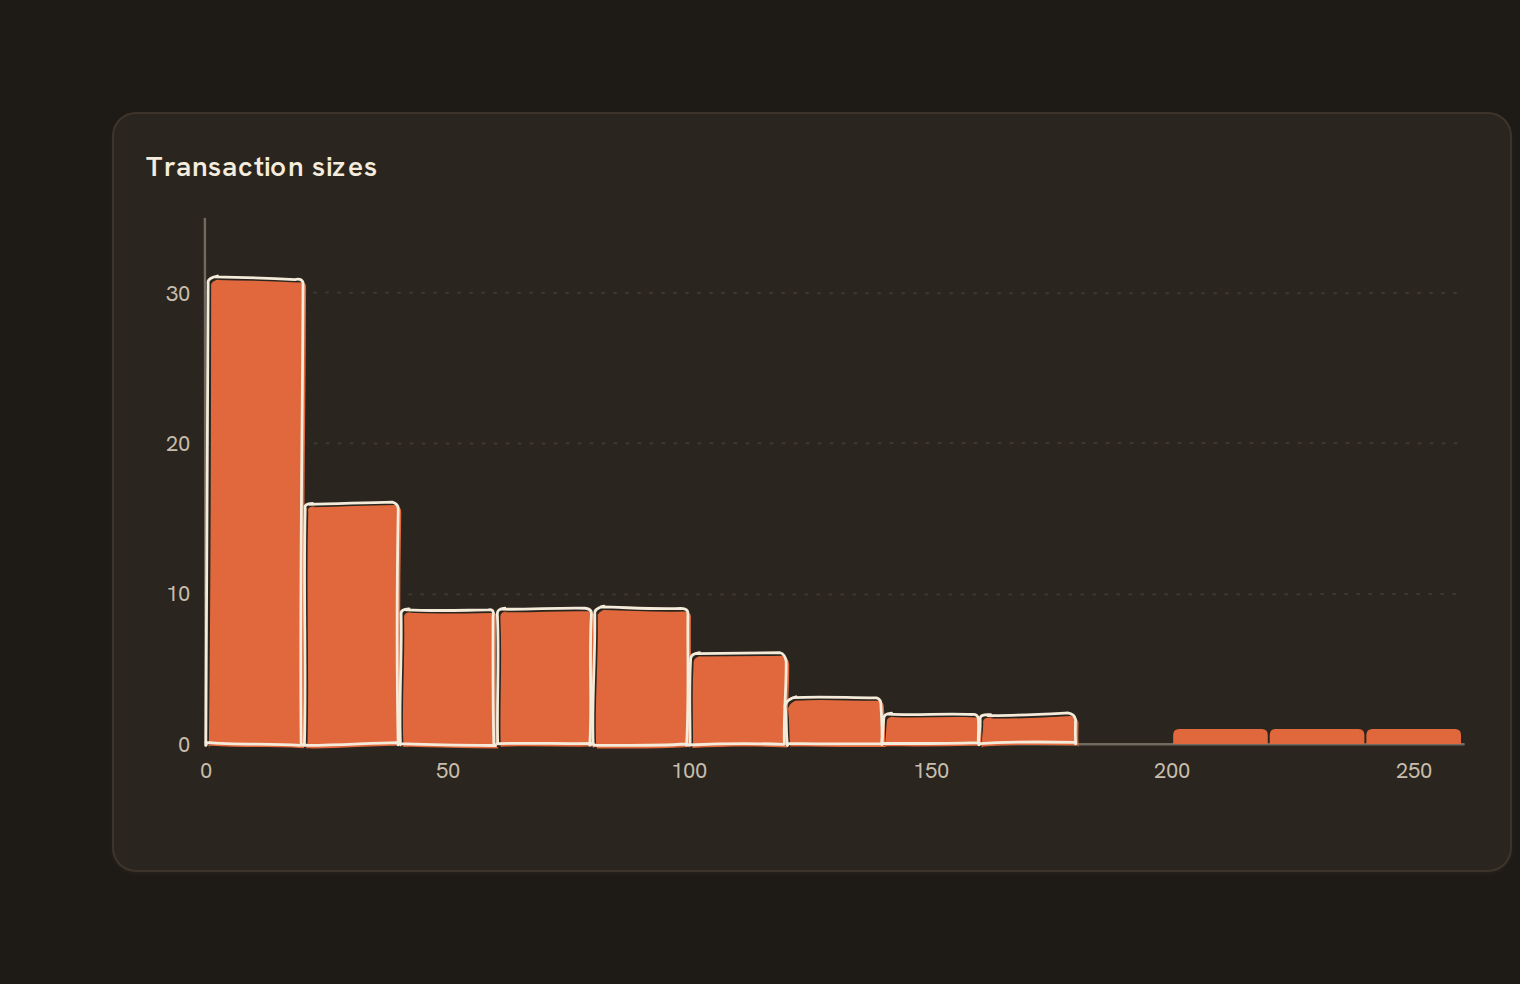 HistogramDistribution of one measure
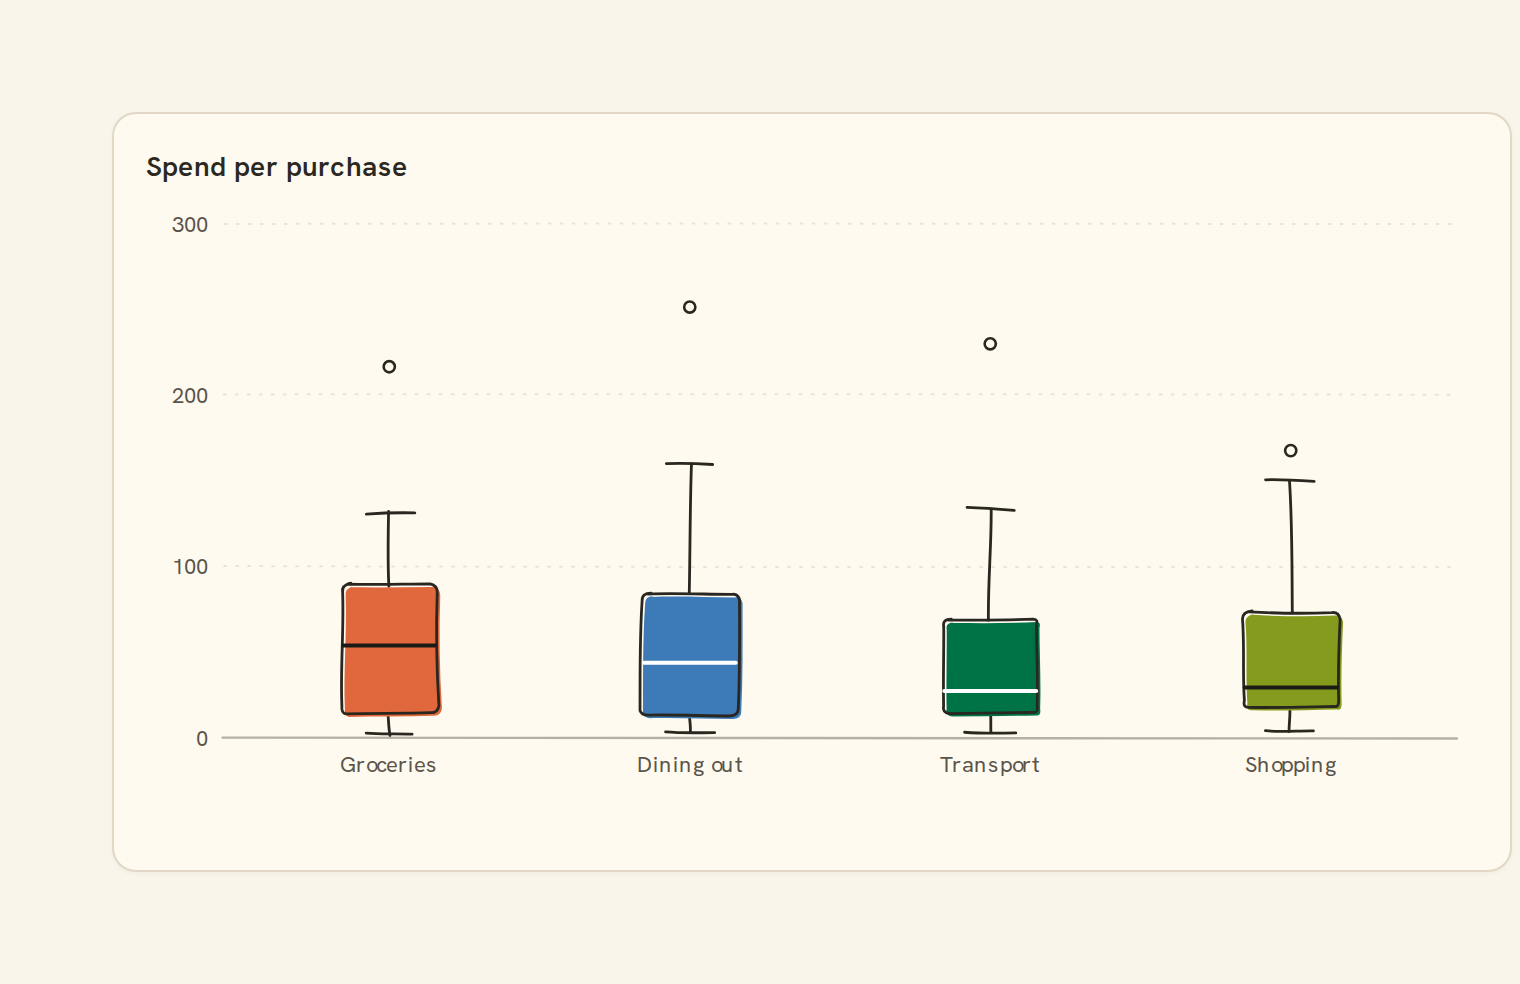
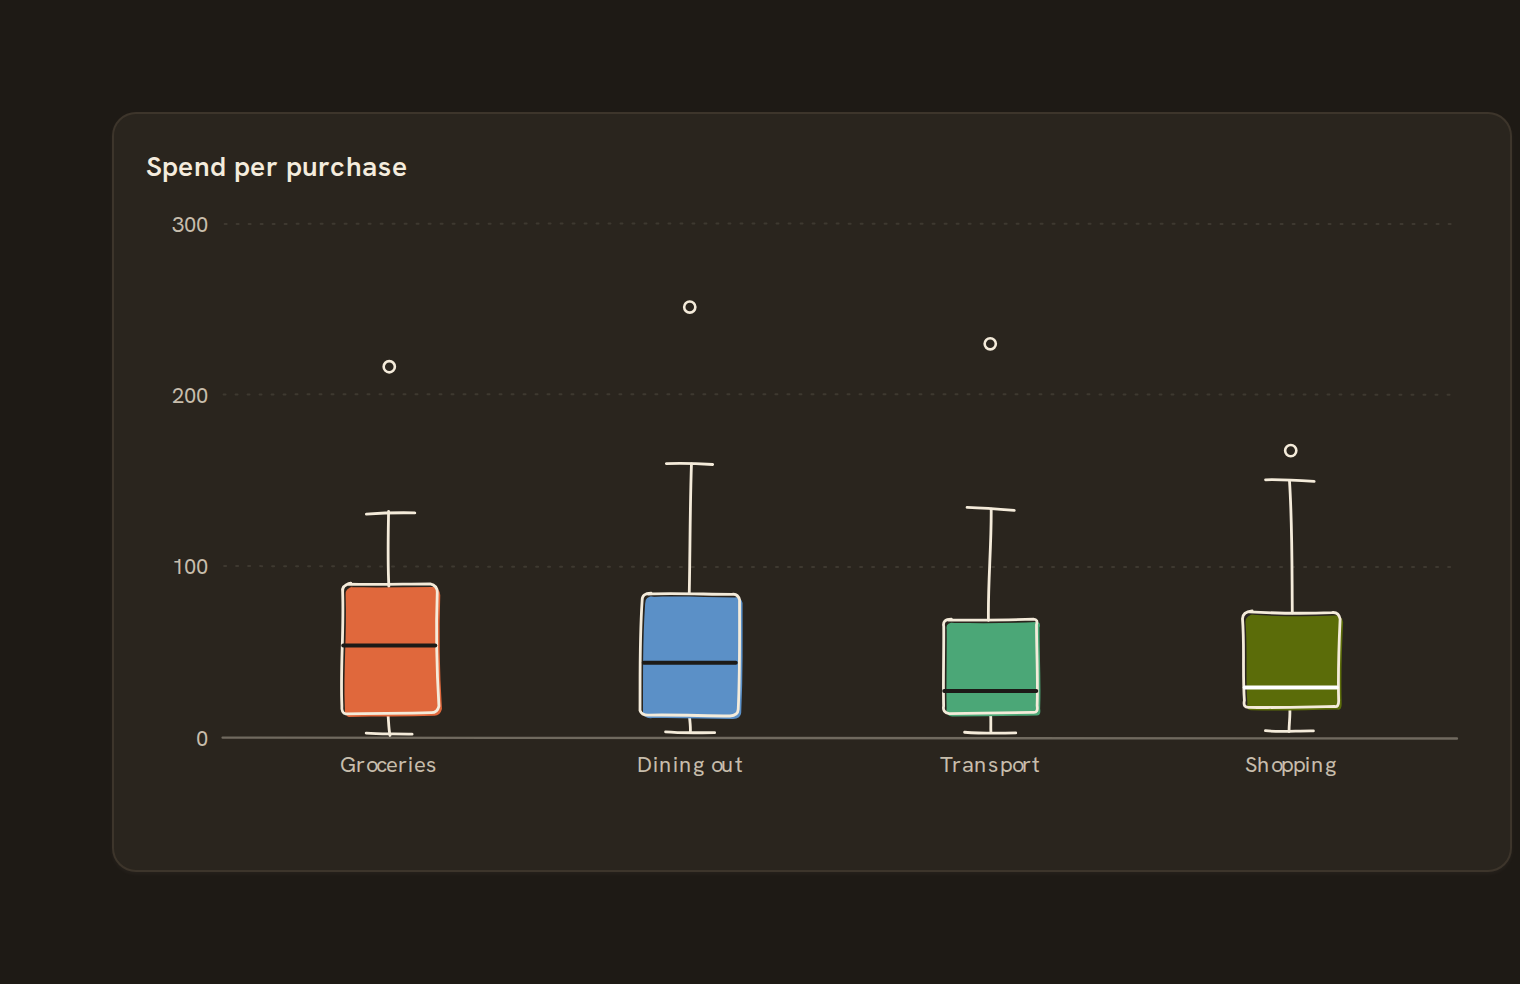 Box plotQuartiles with whiskers
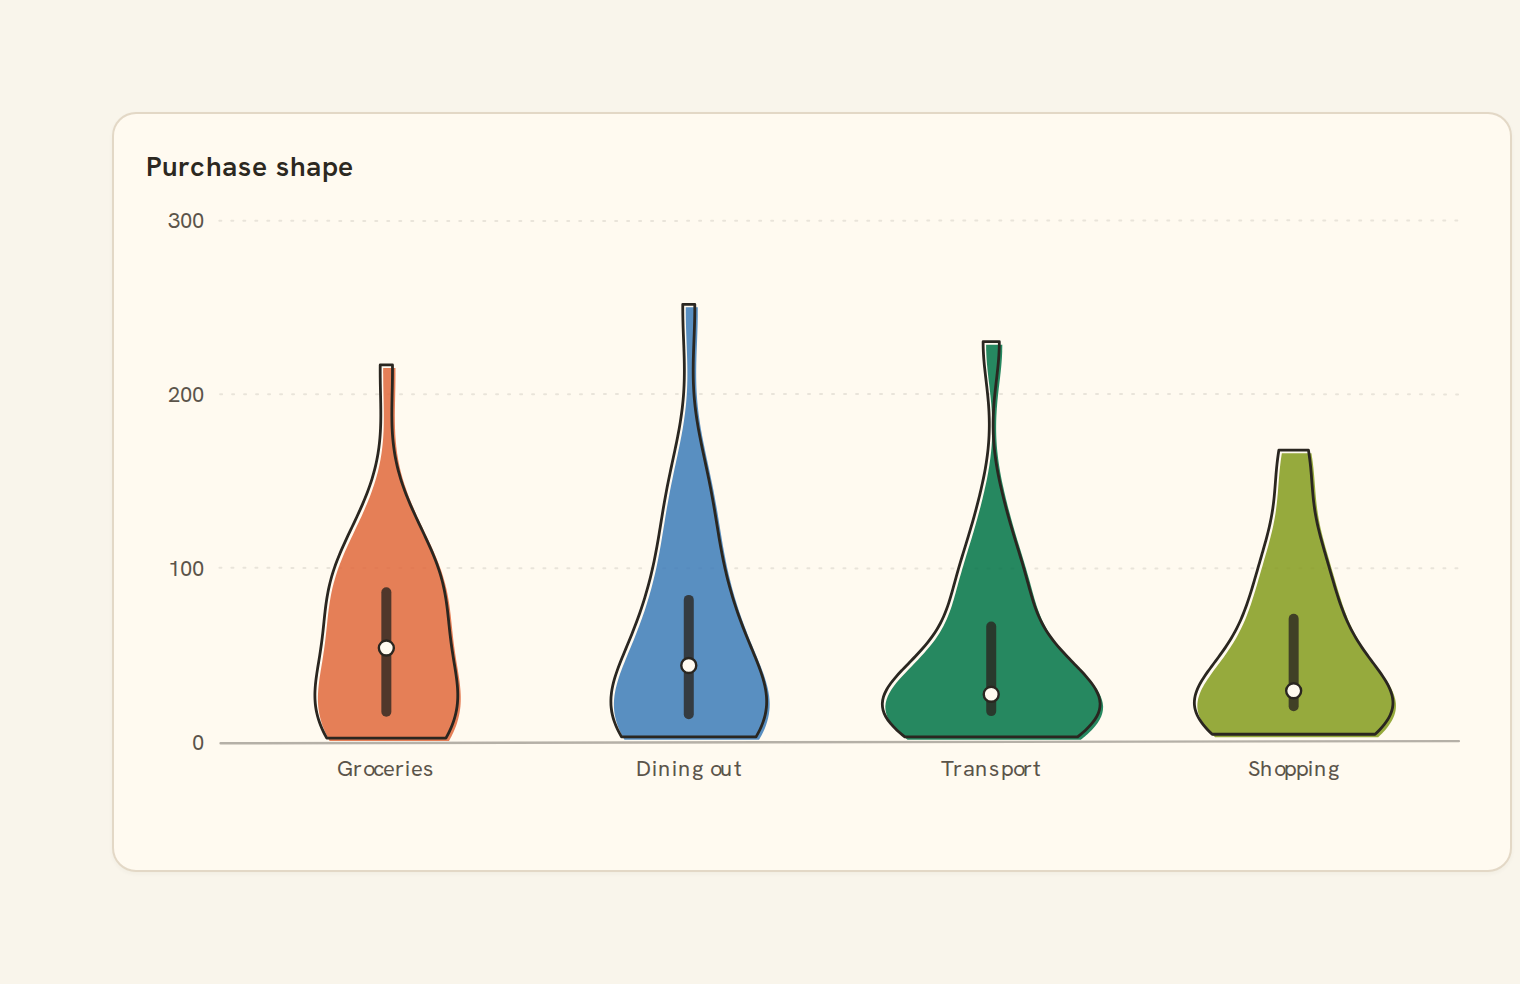
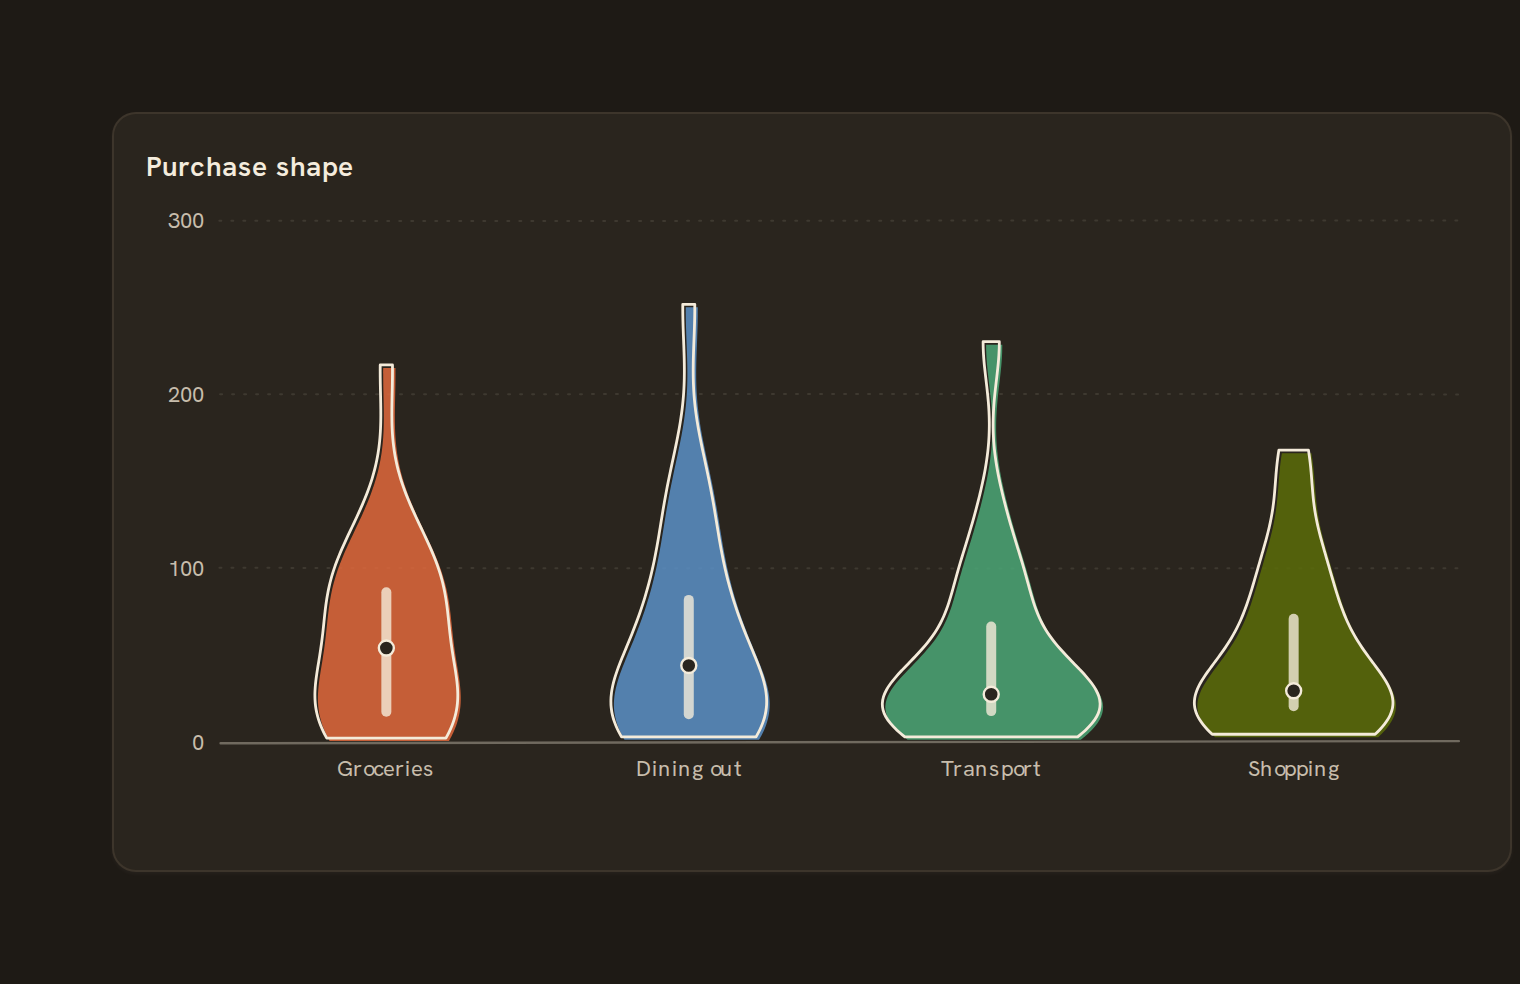 ViolinDensity per category
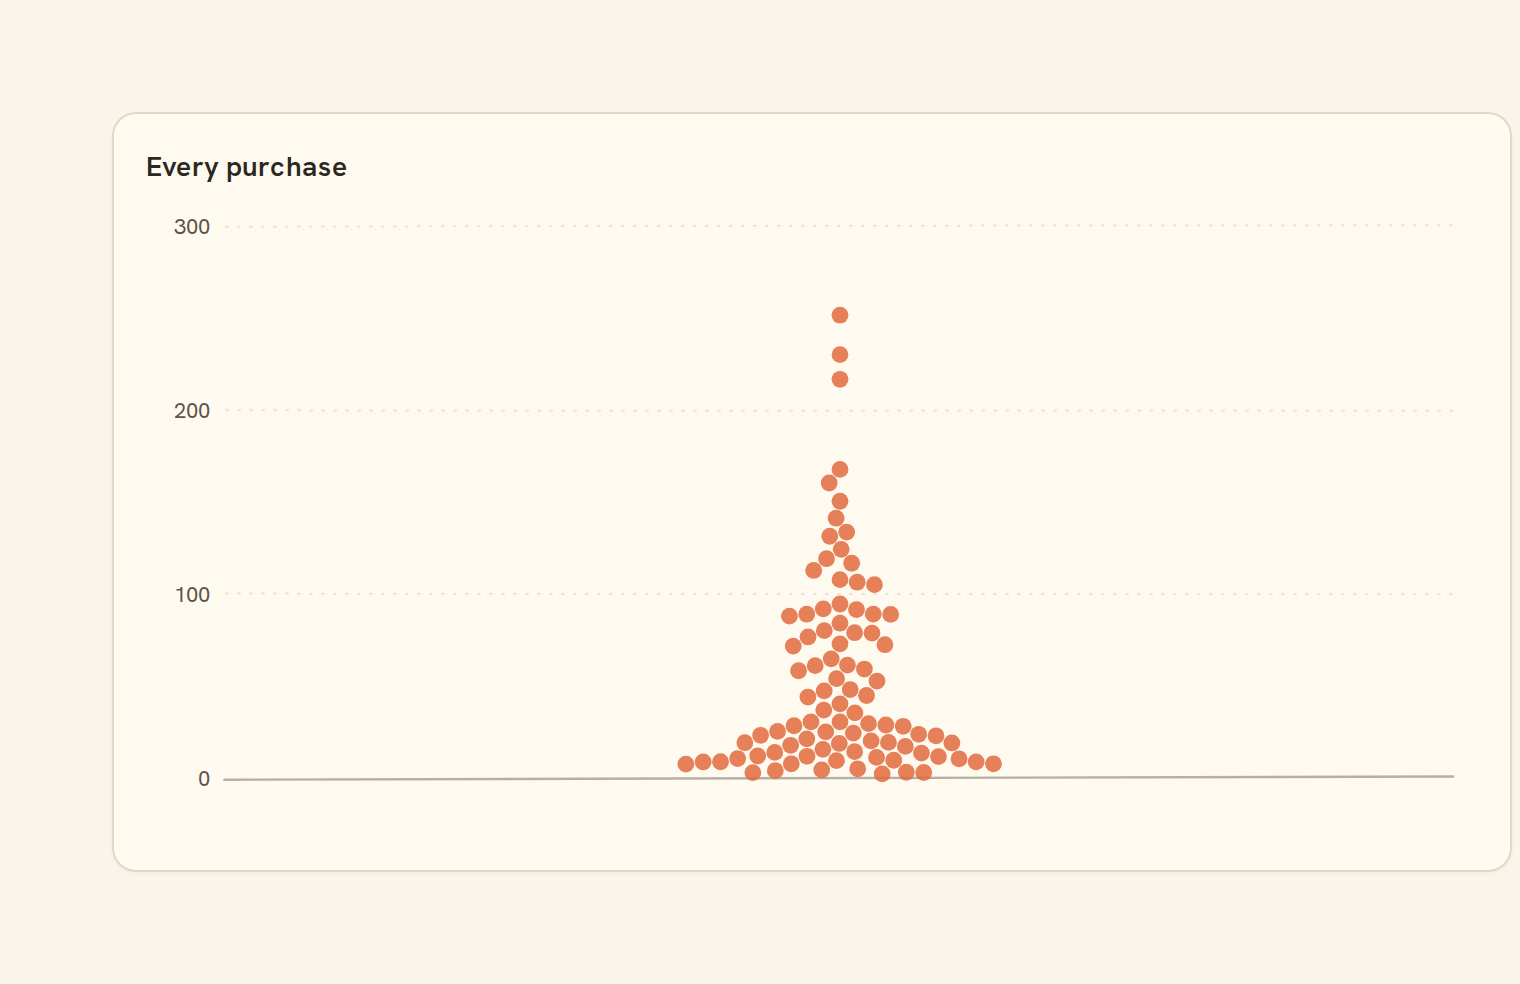
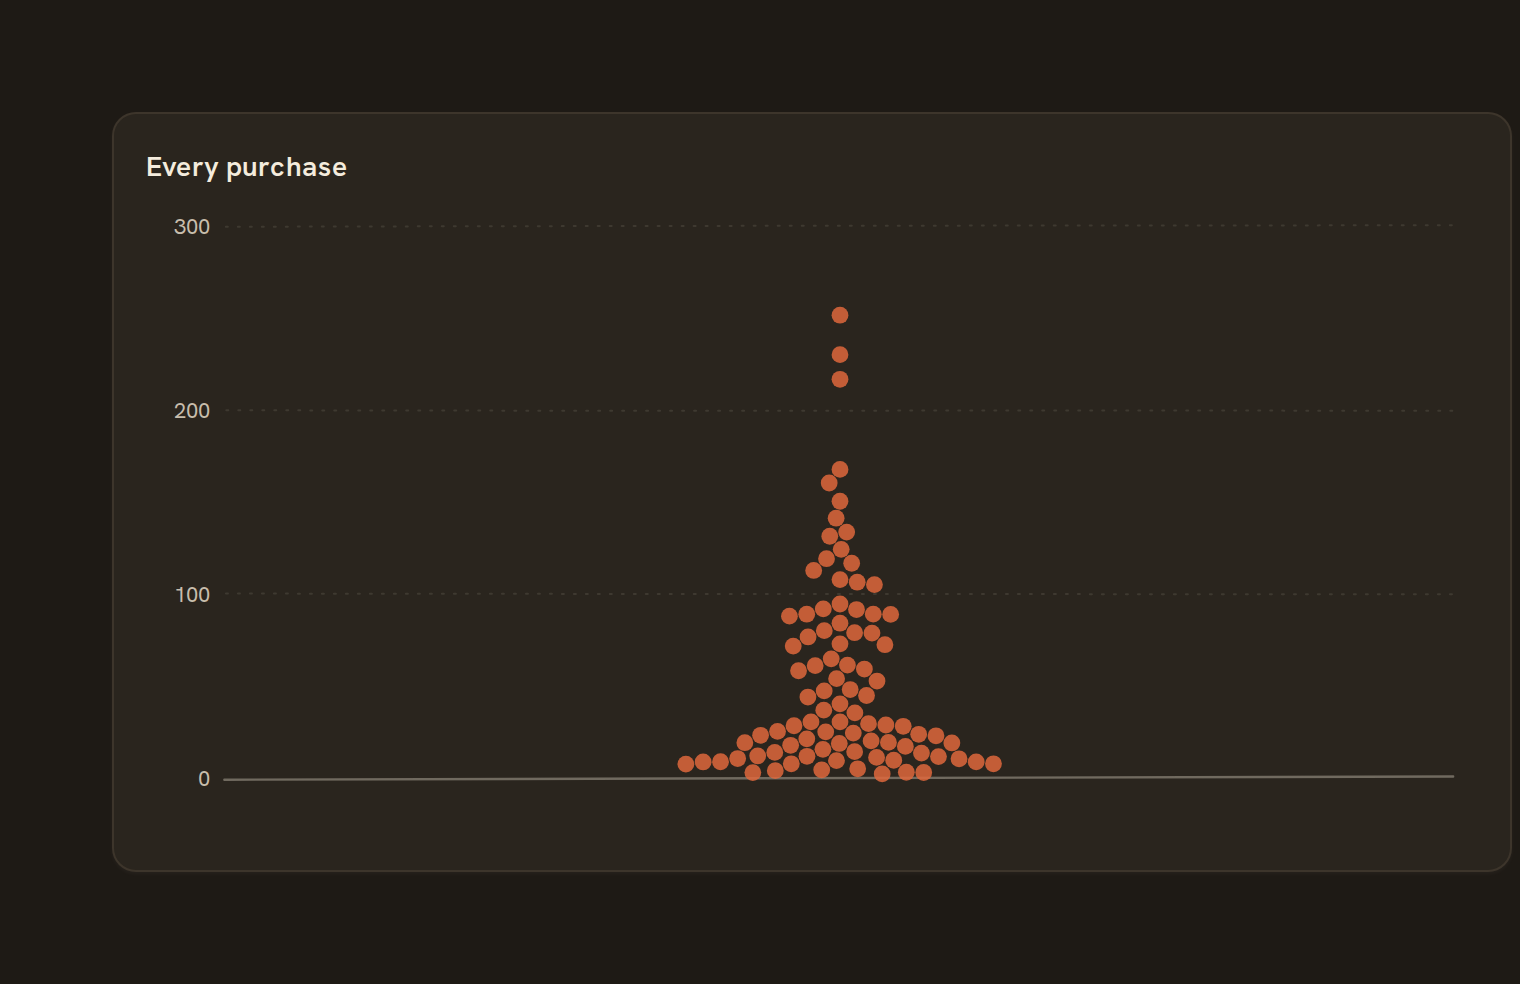 BeeswarmNon-overlapping dot plot
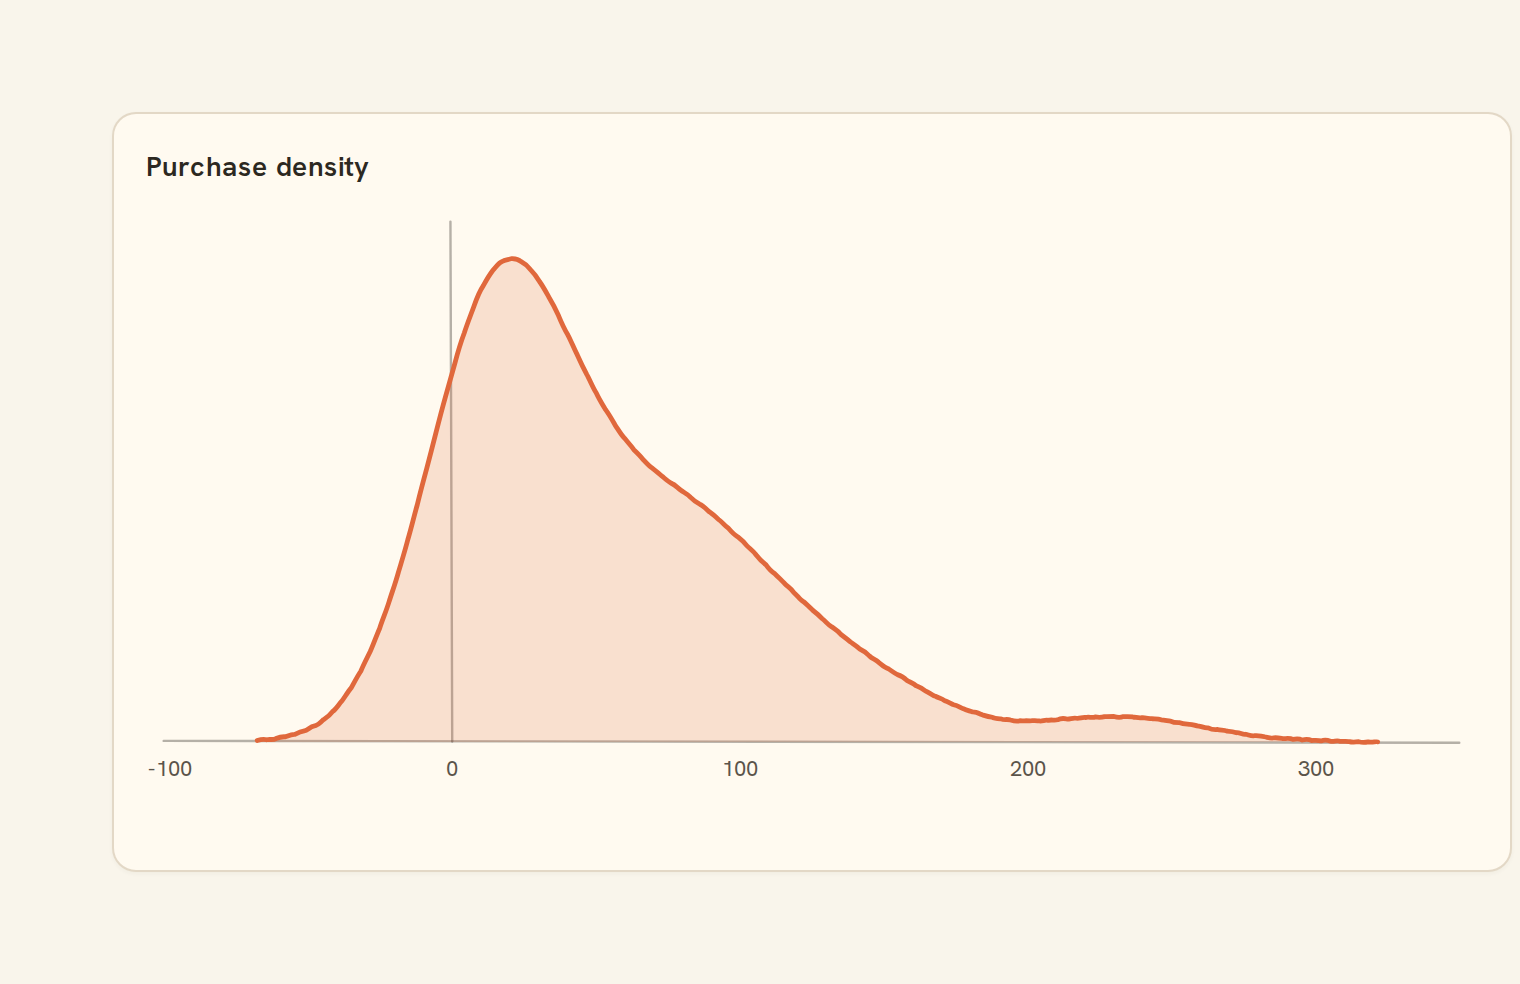
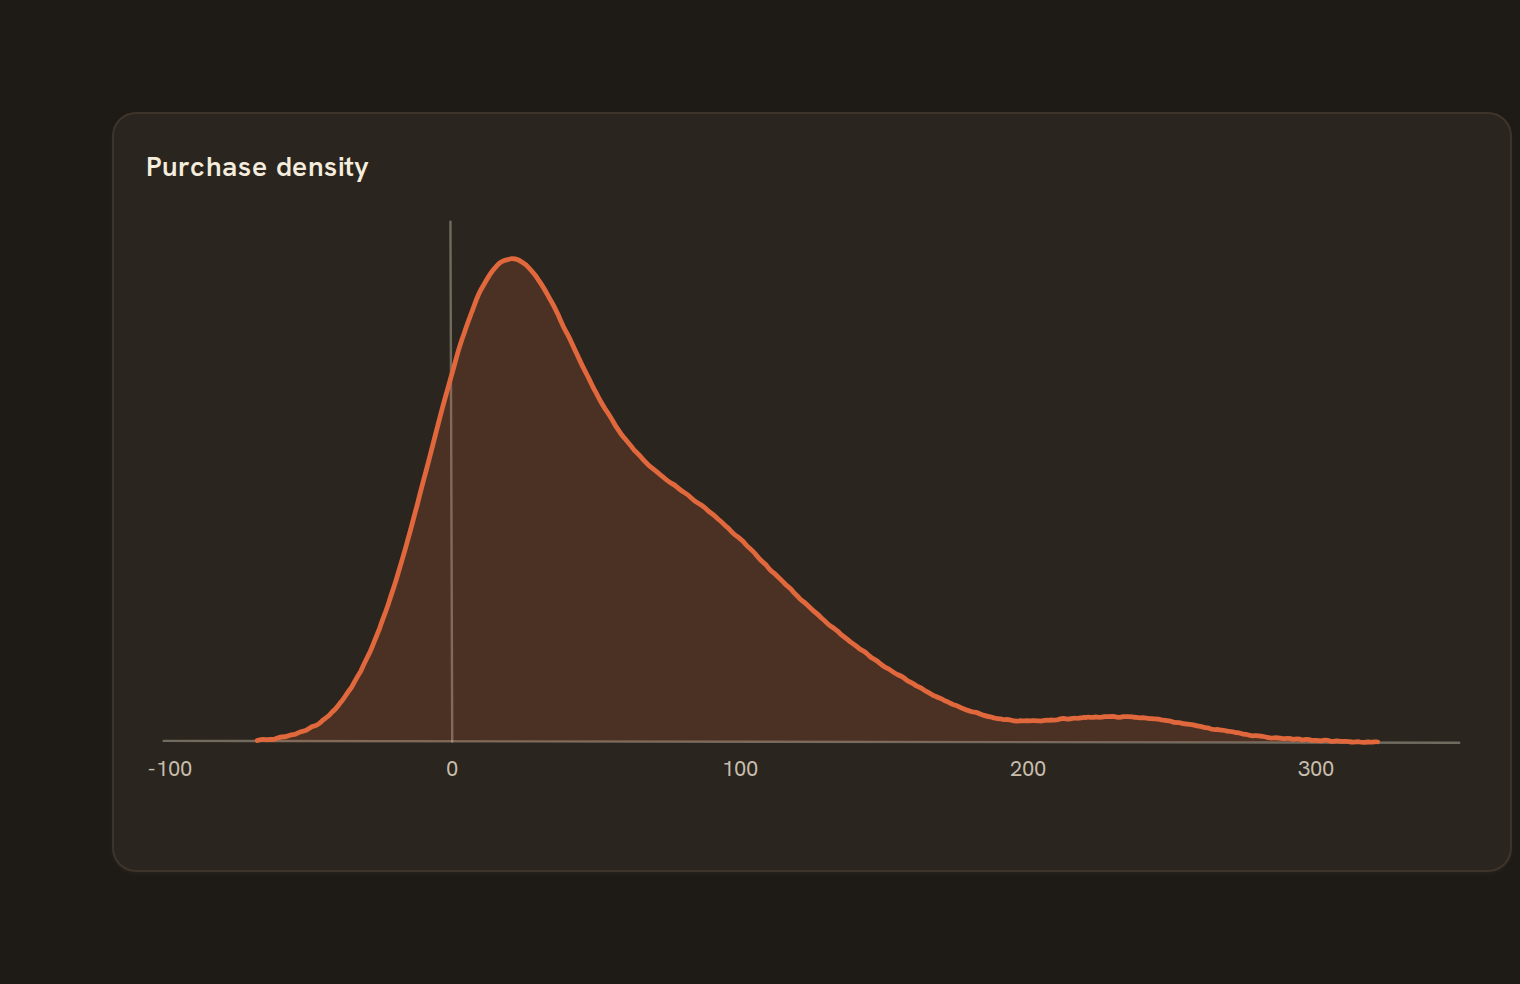 DensityKernel-smoothed distribution
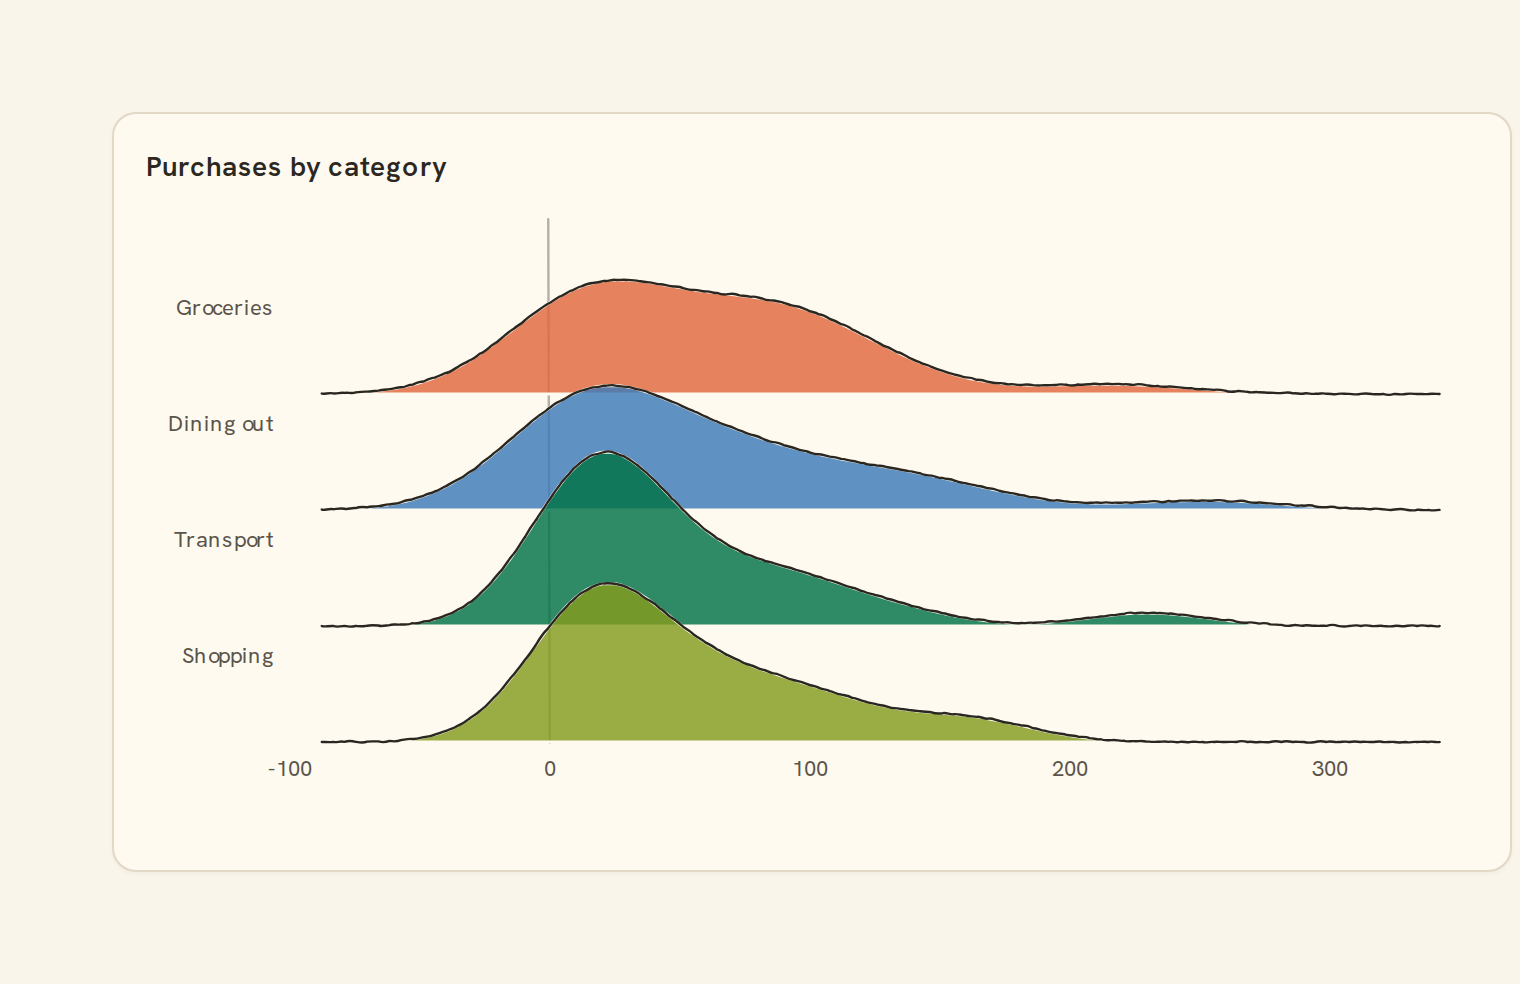
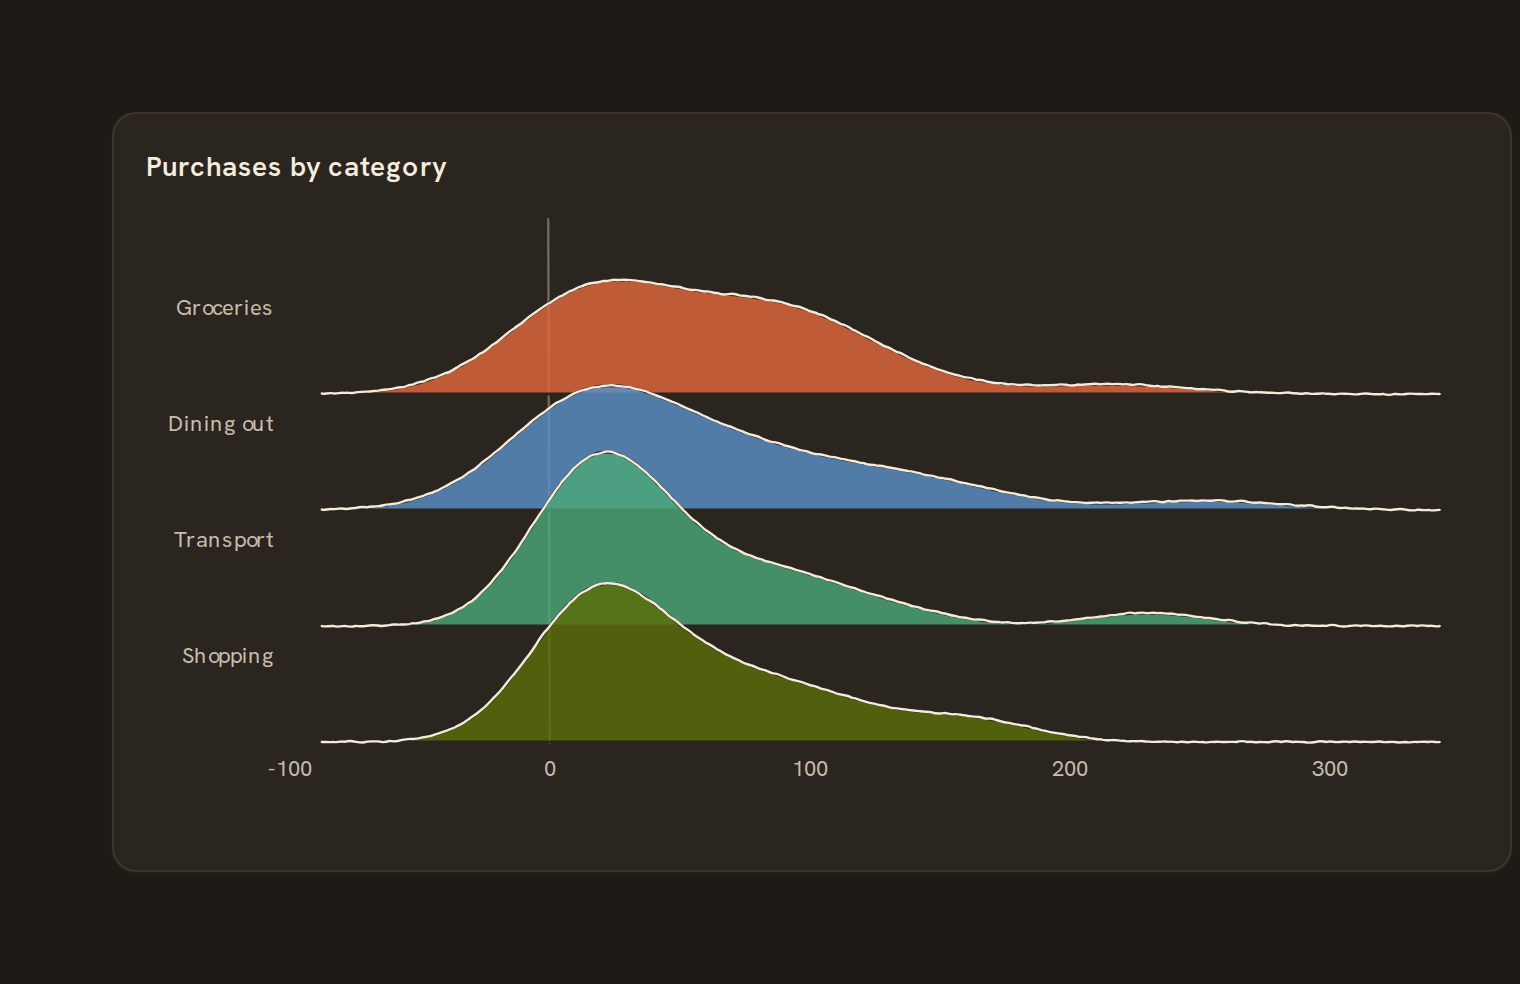 RidgelineStacked distributions
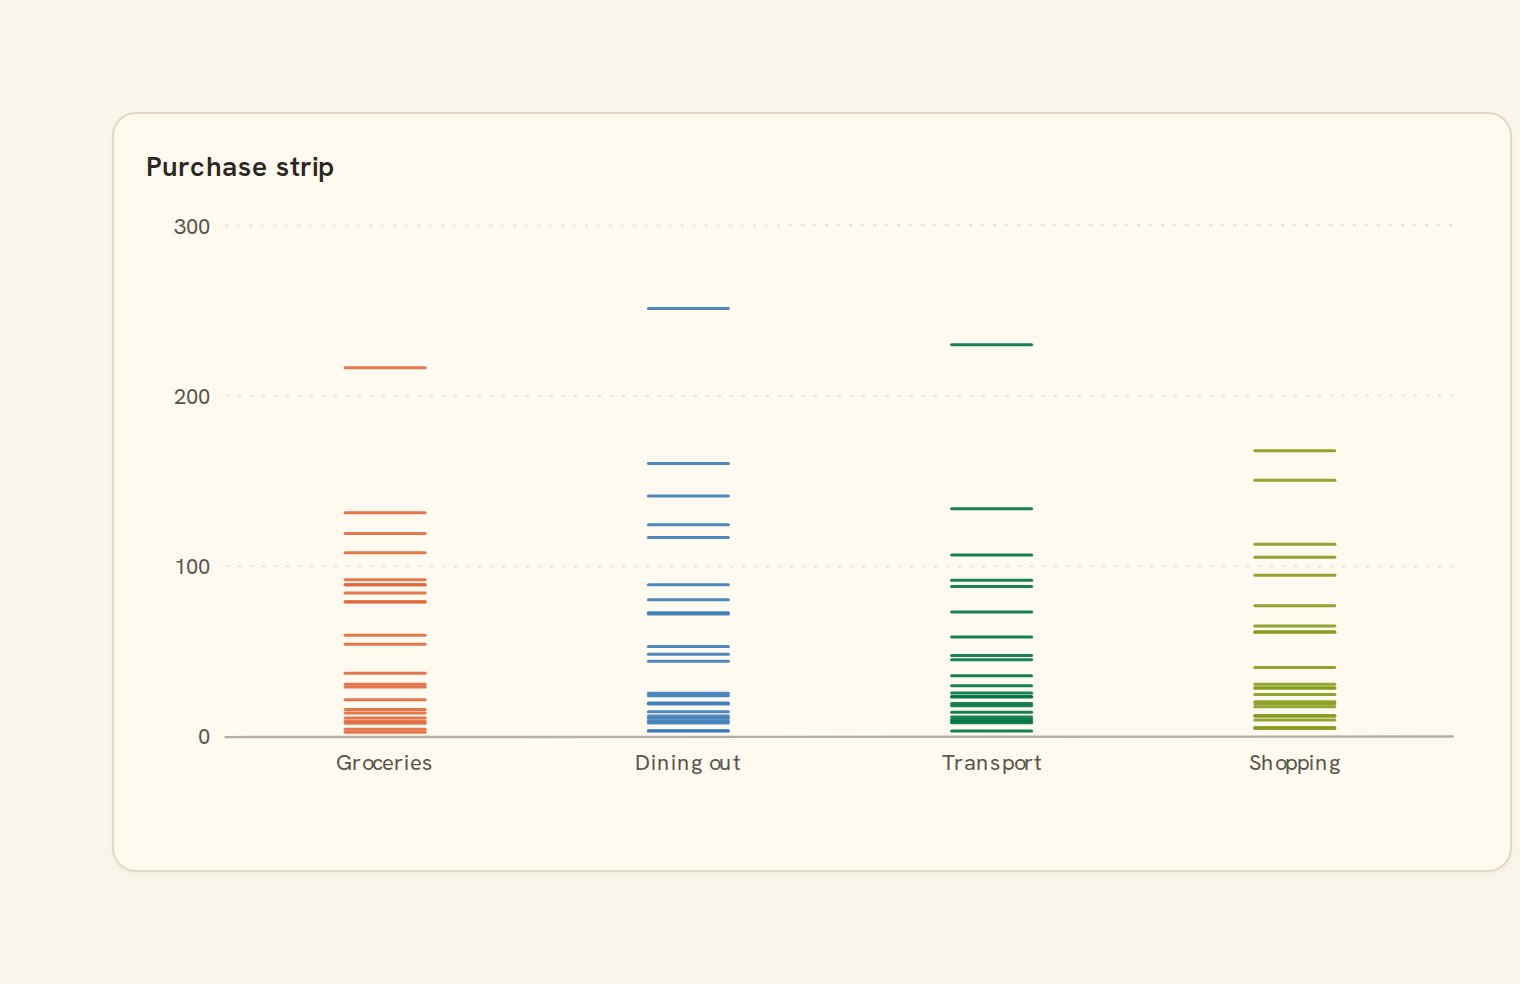
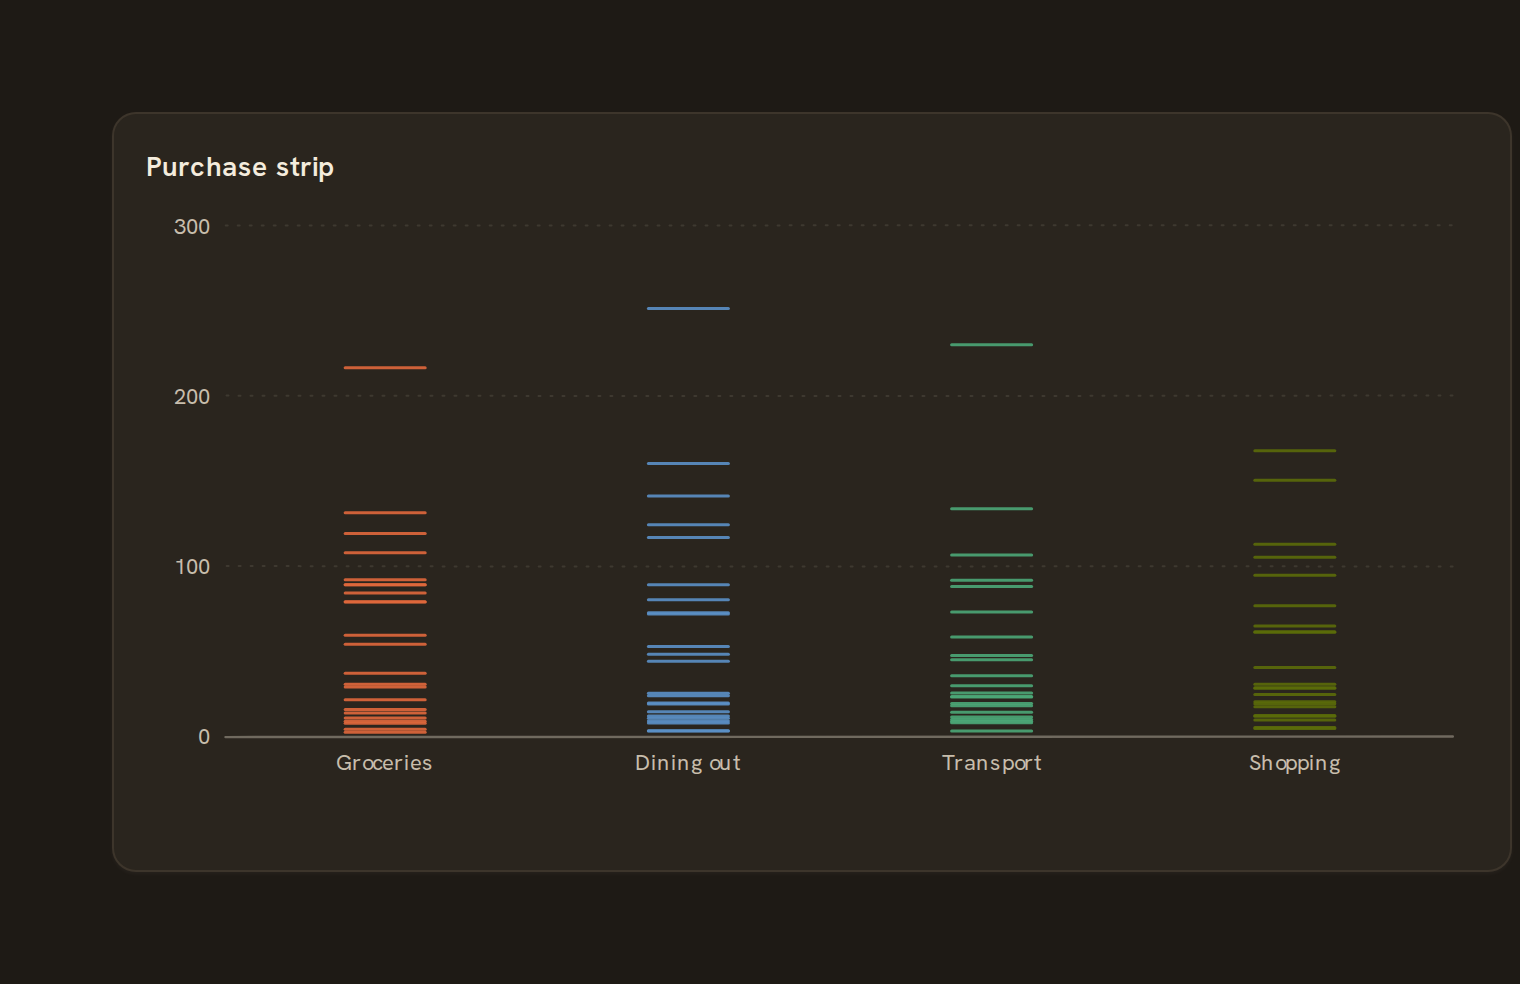 Strip plotEach value as a tick
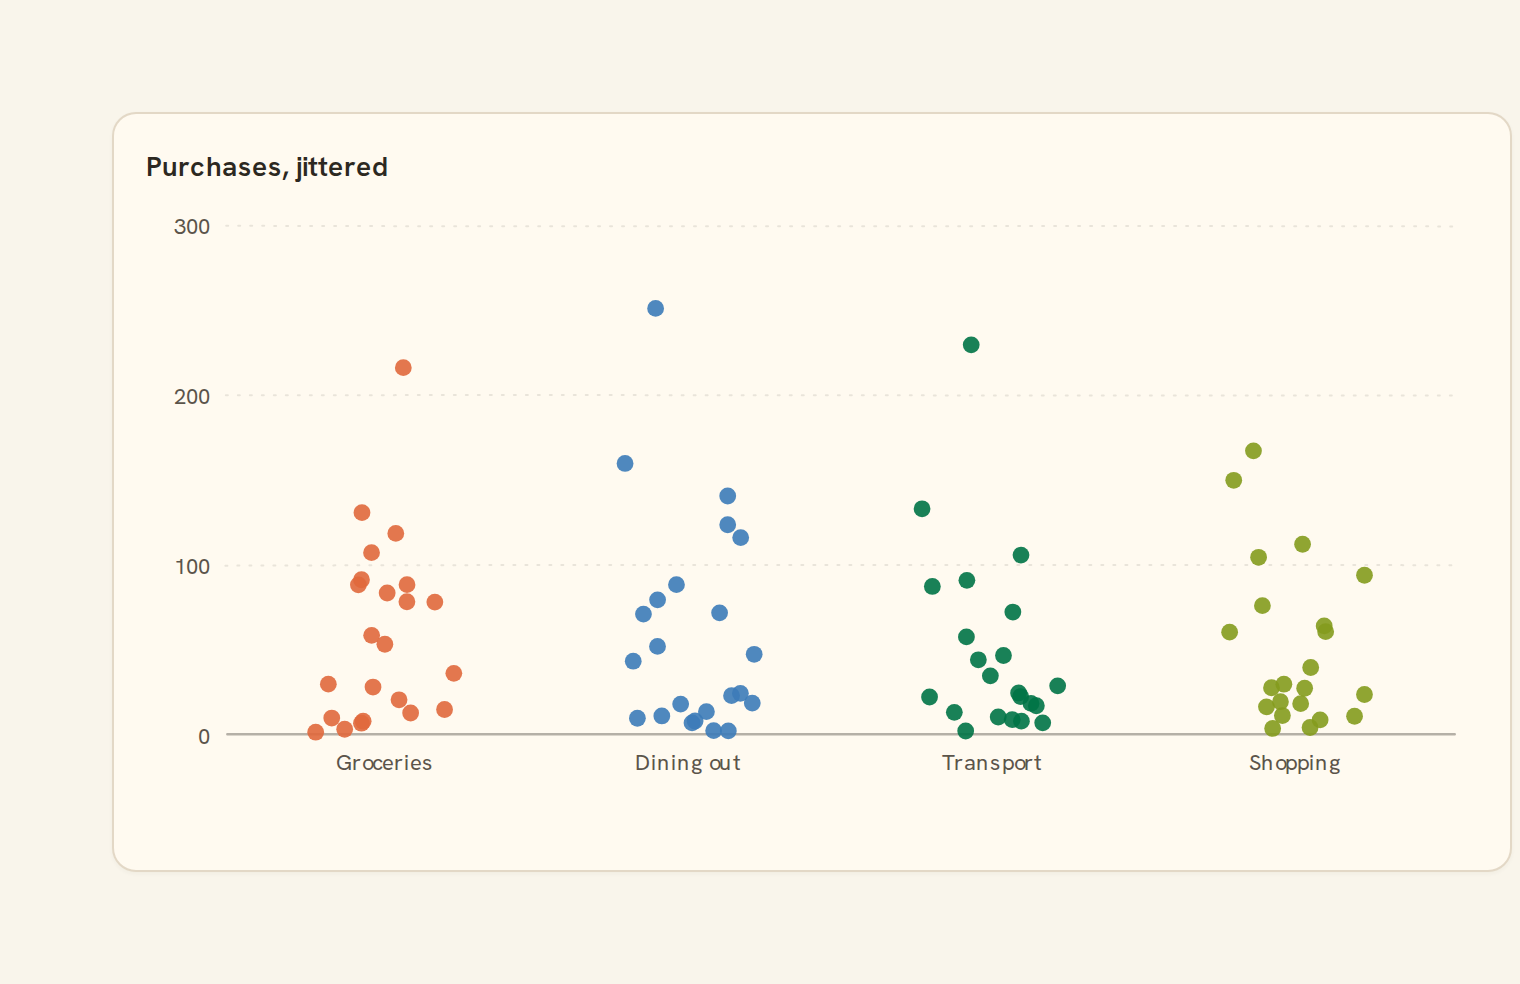
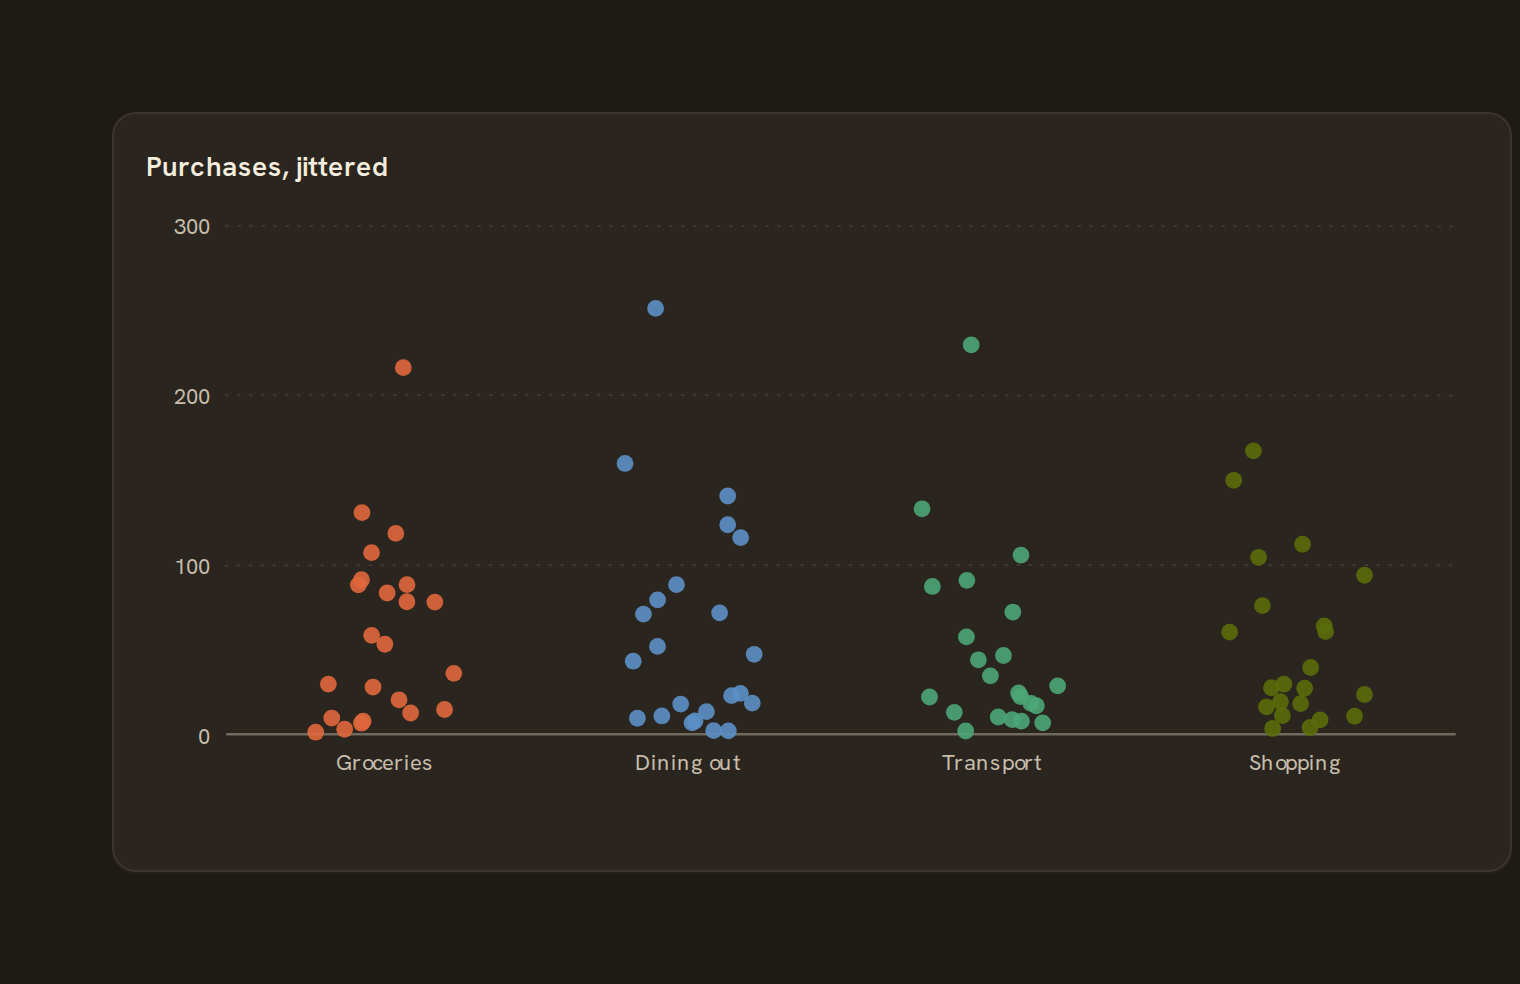 Jitter plotScattered dots per category
Part-of-whole#
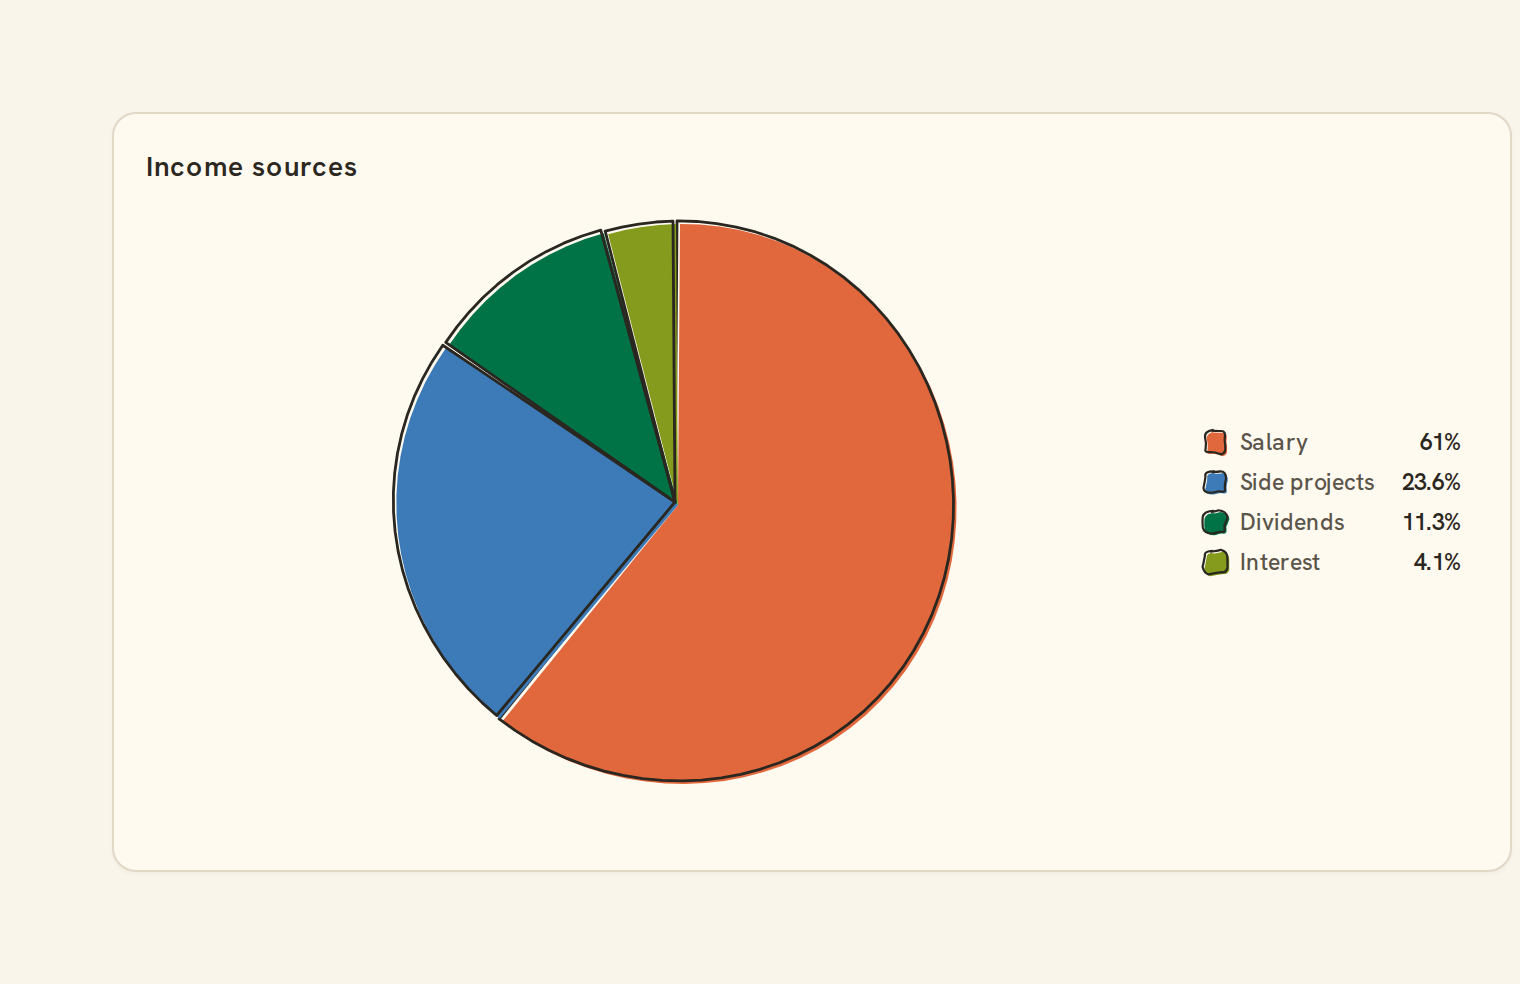
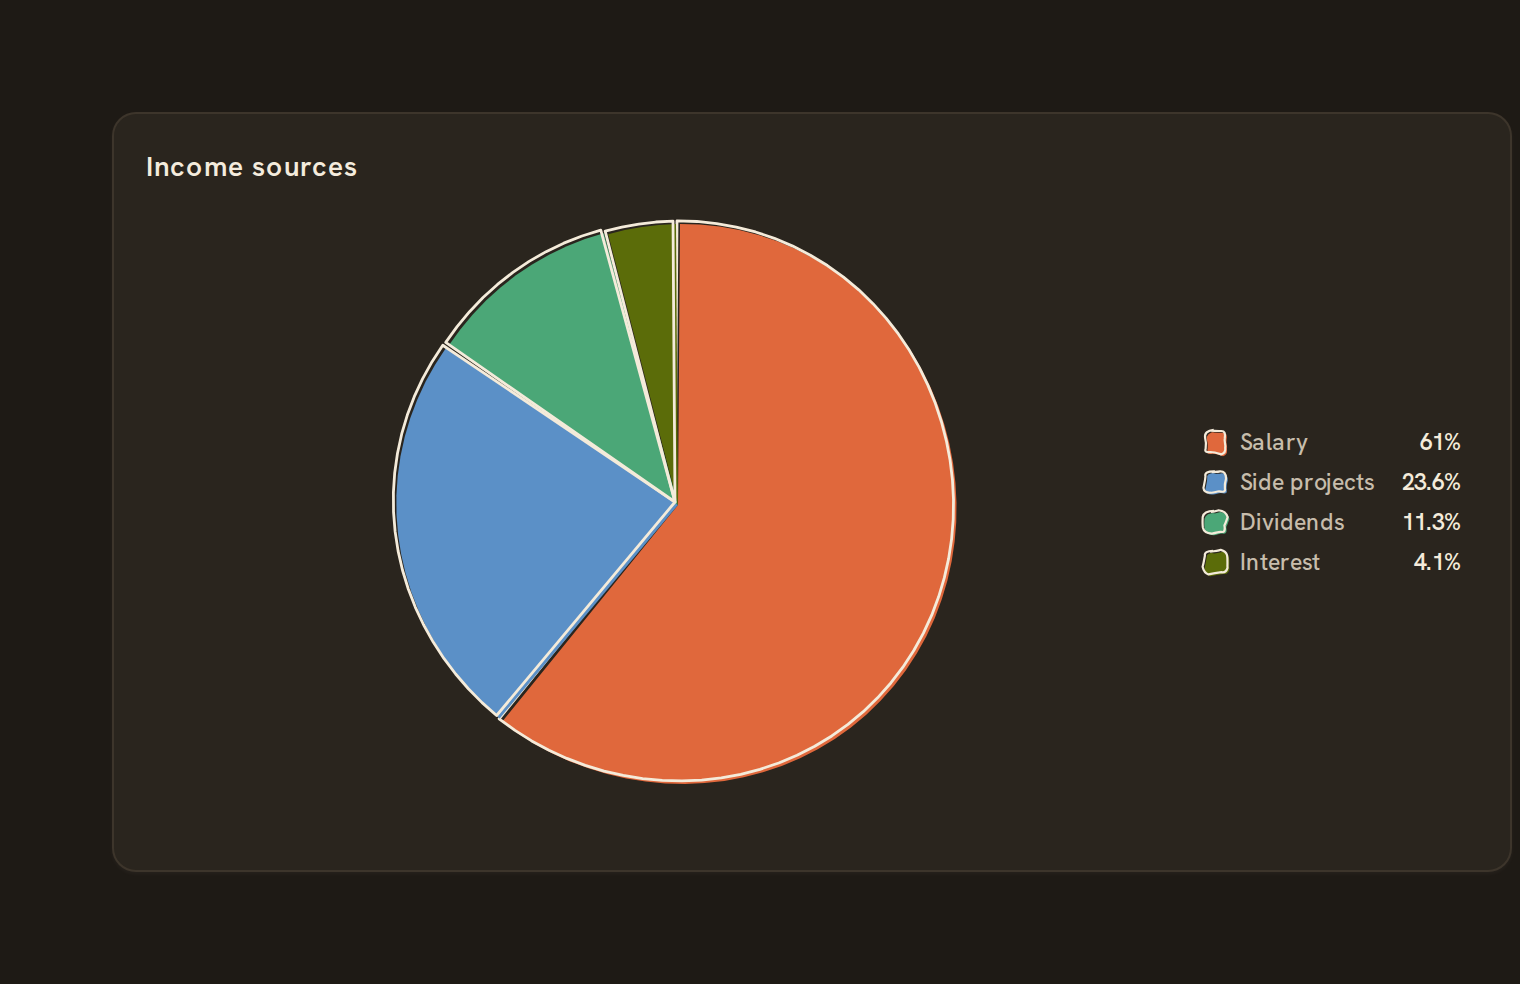 Pie chartCategorical share
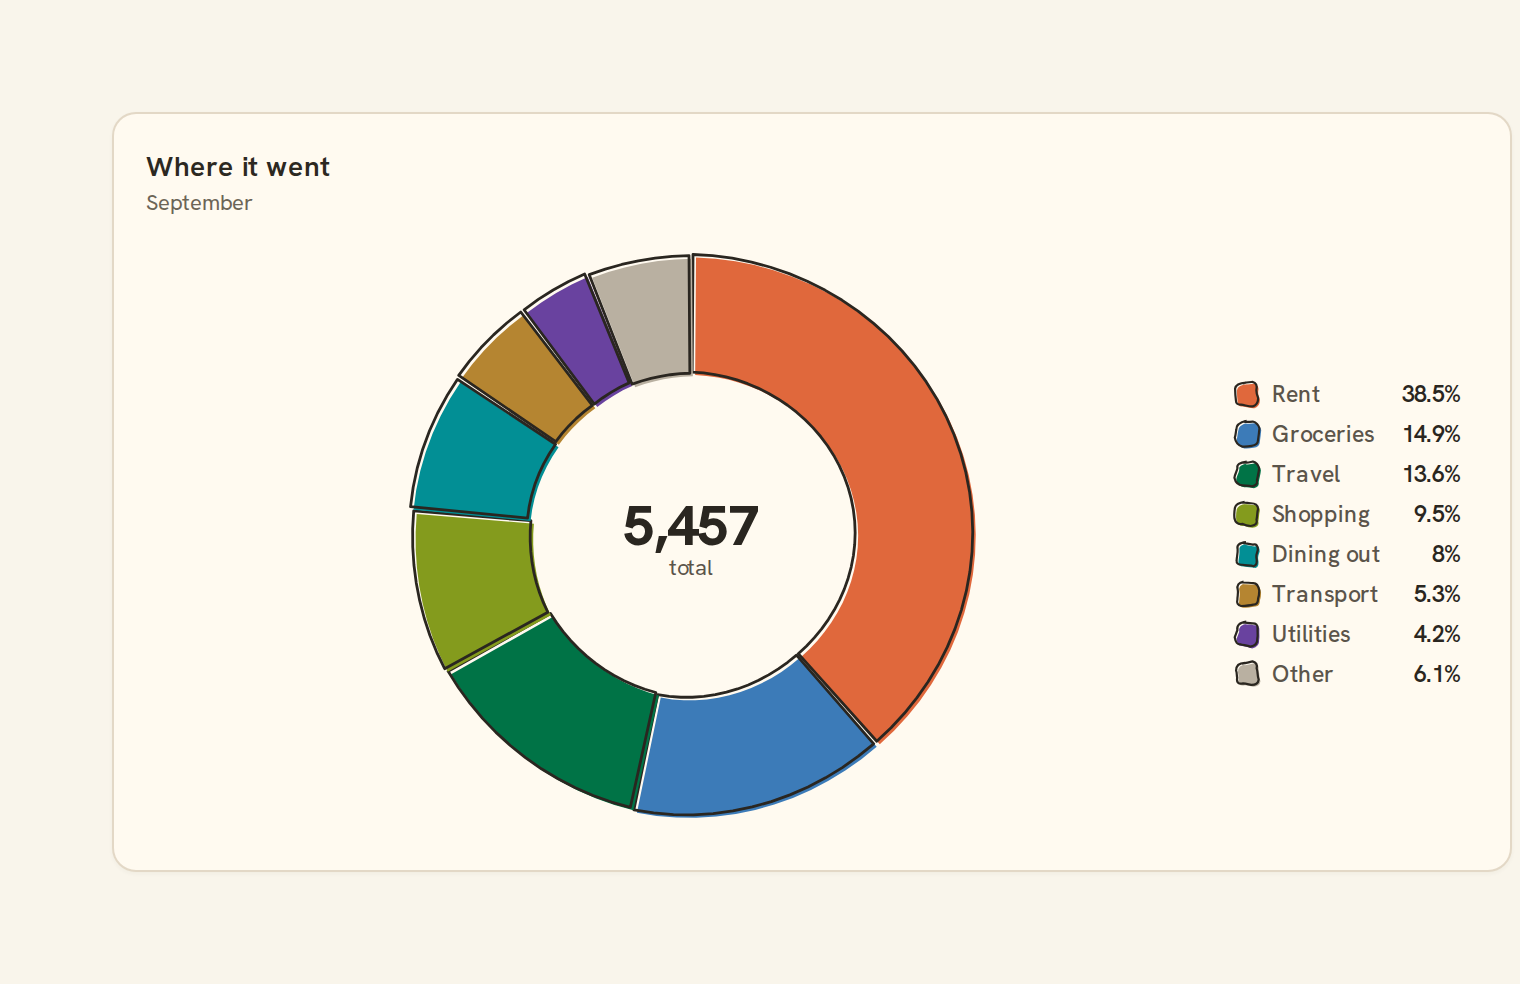
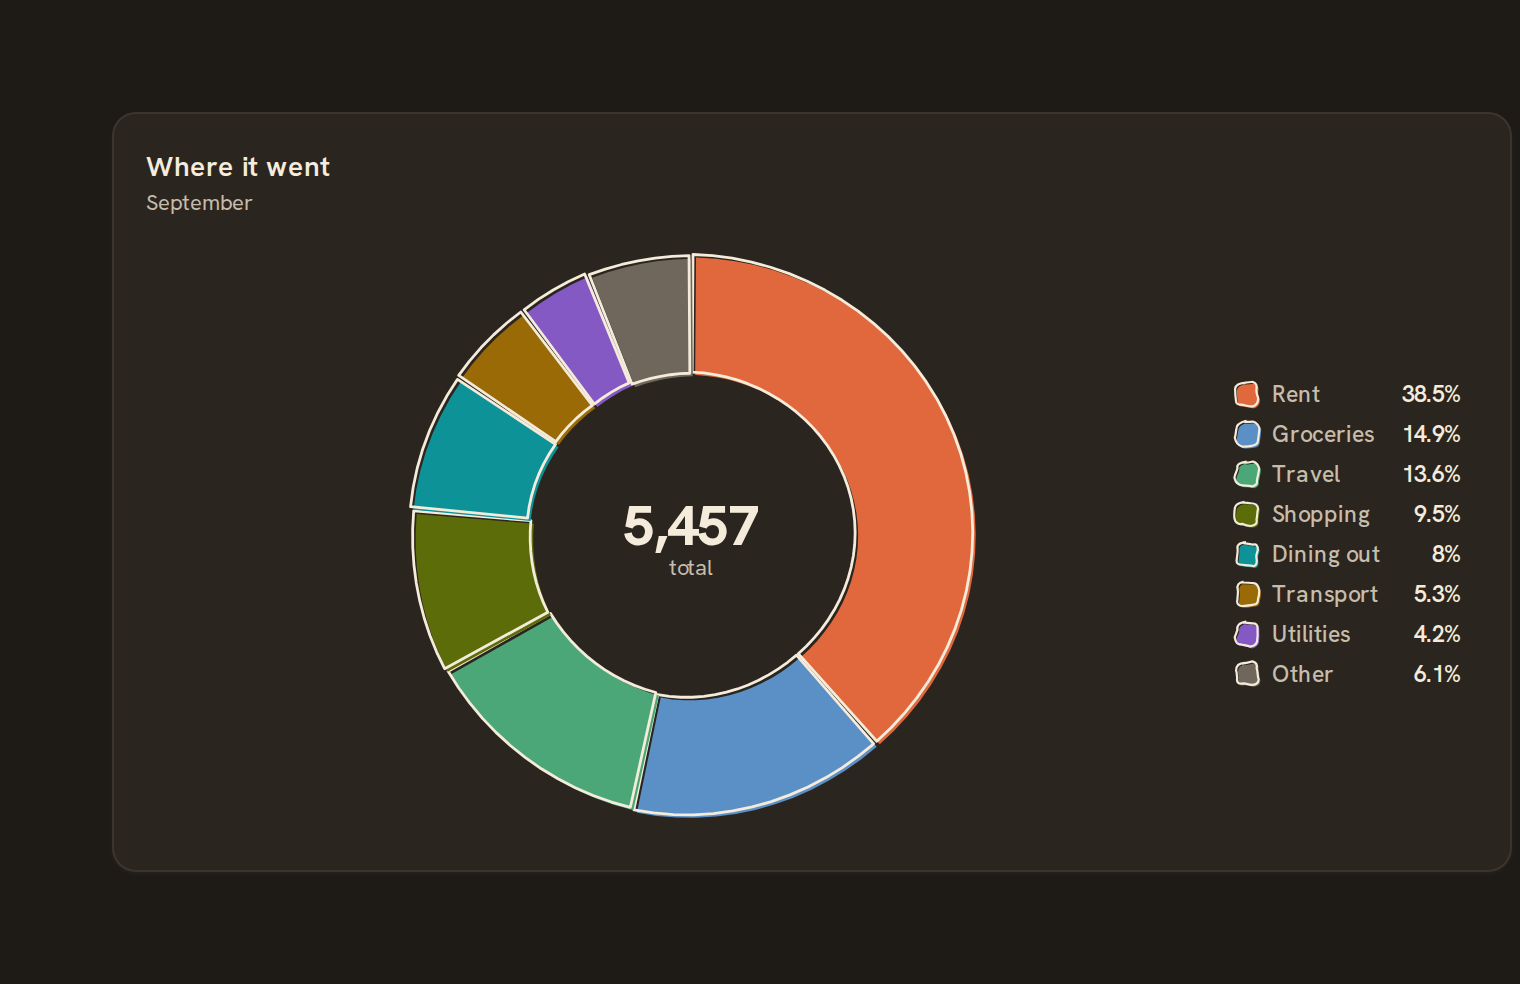 Donut chartPie with center label
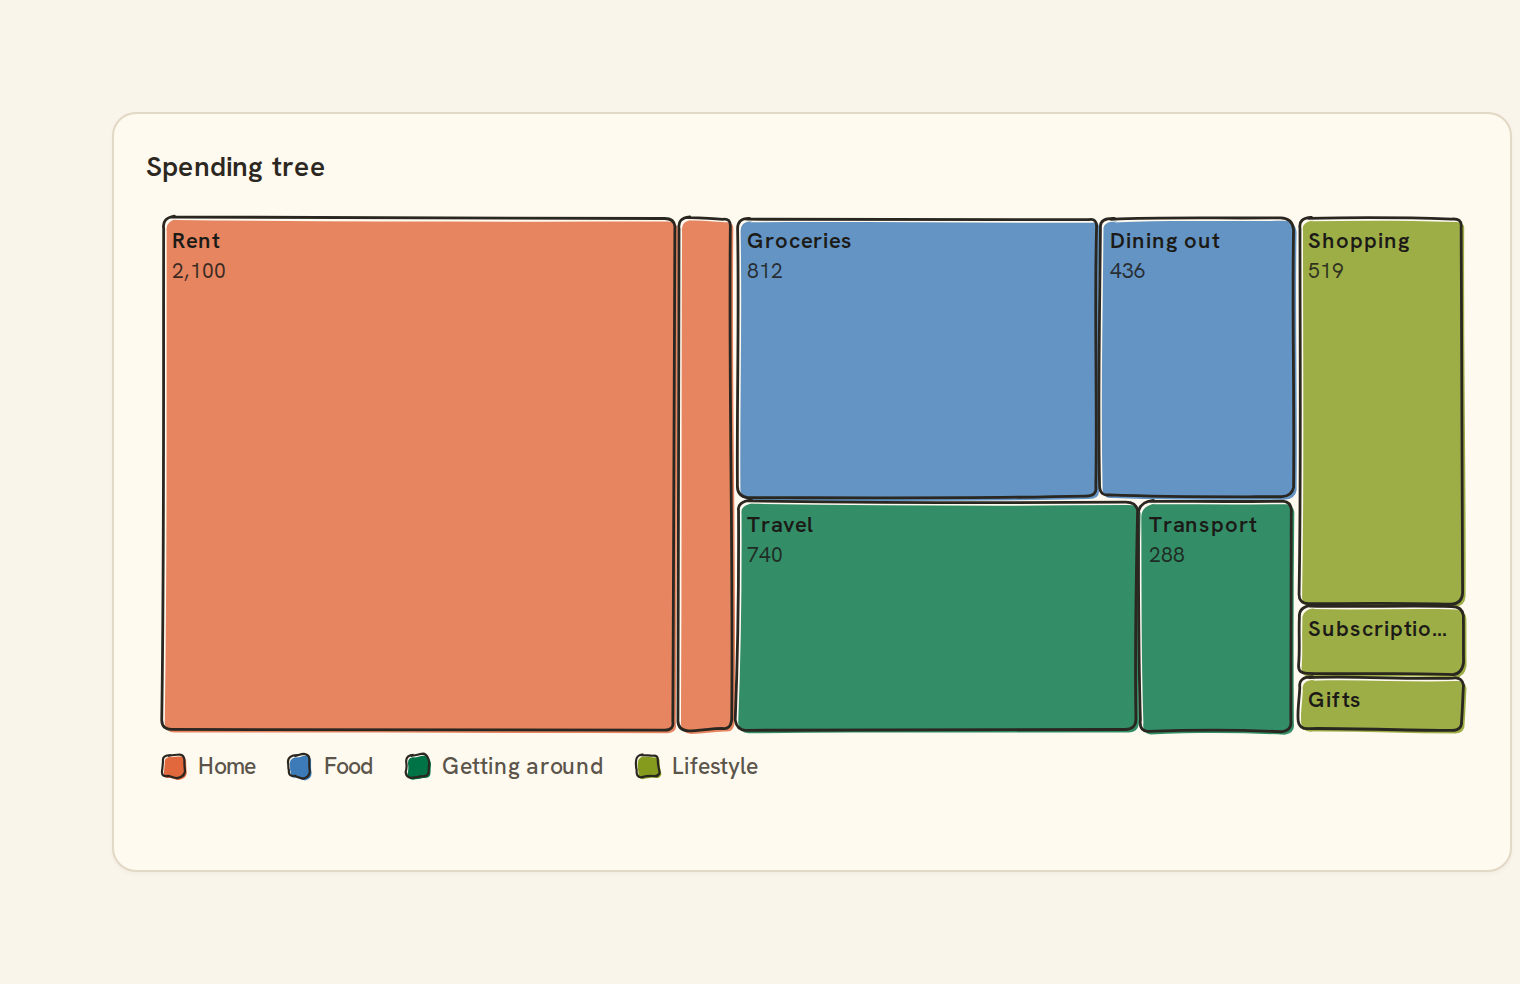
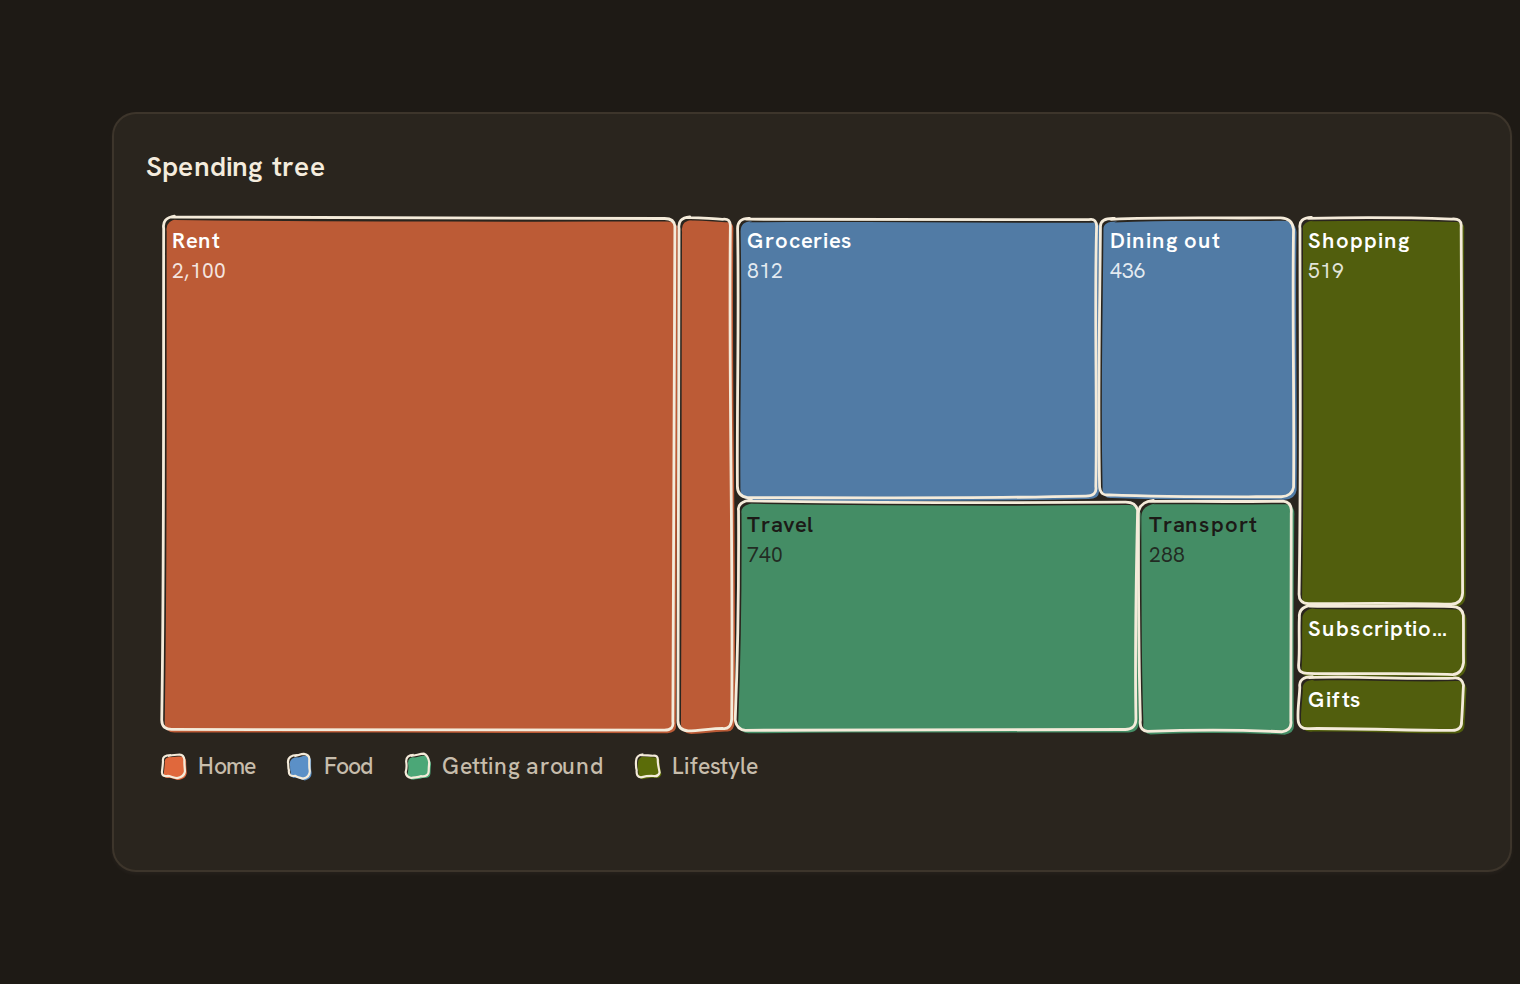 TreemapNested rectangles by value
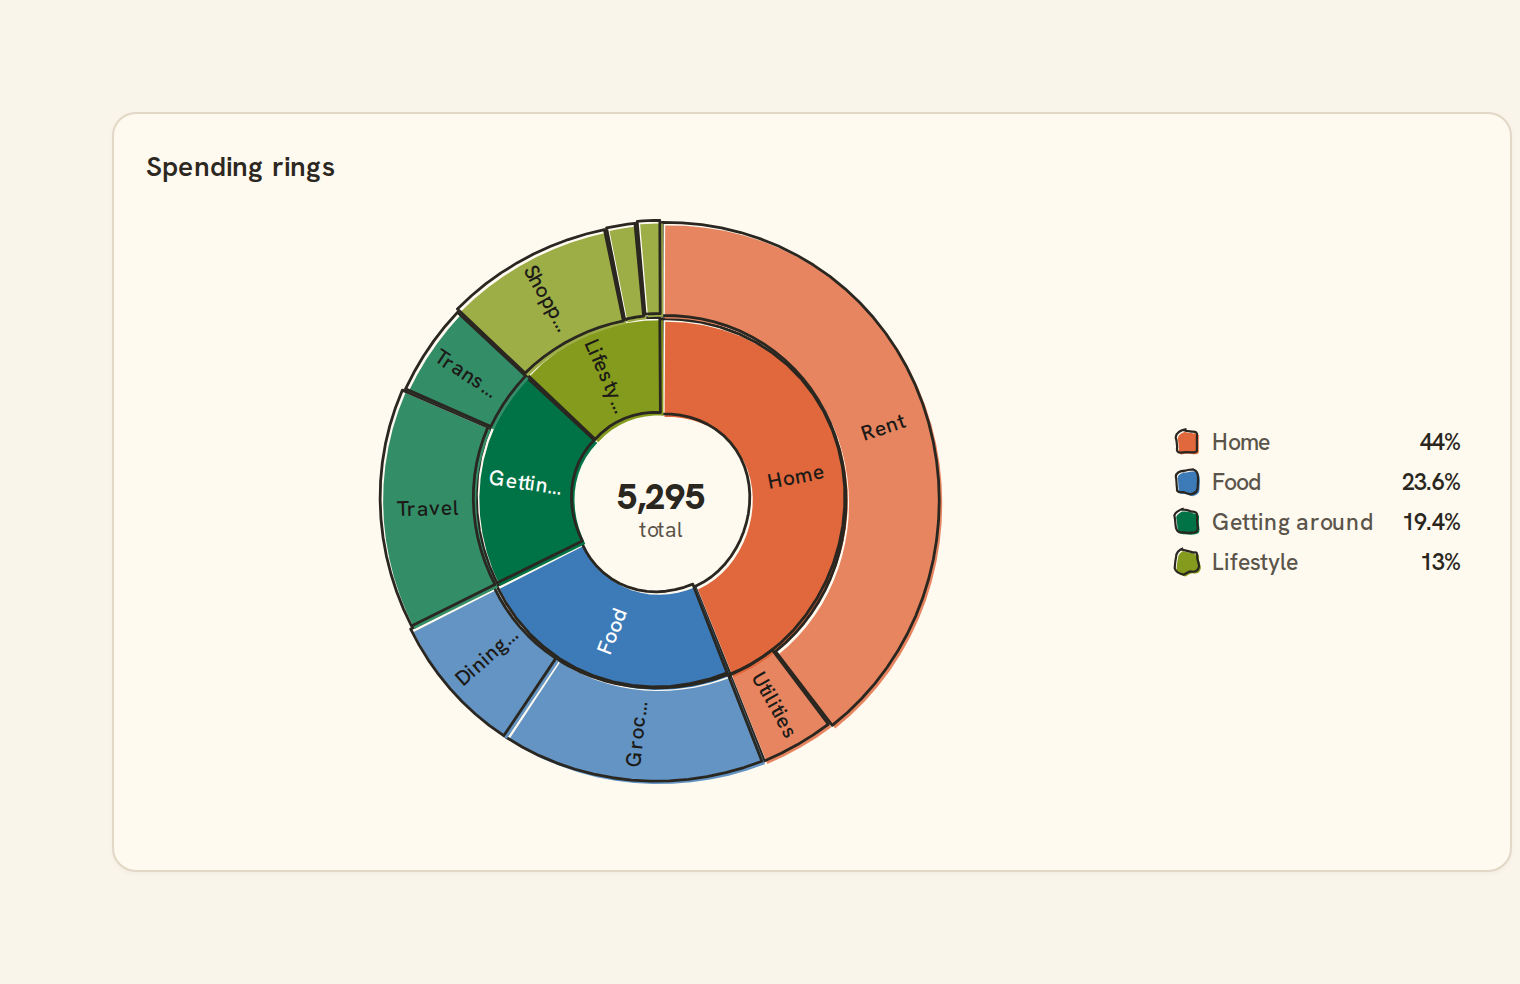
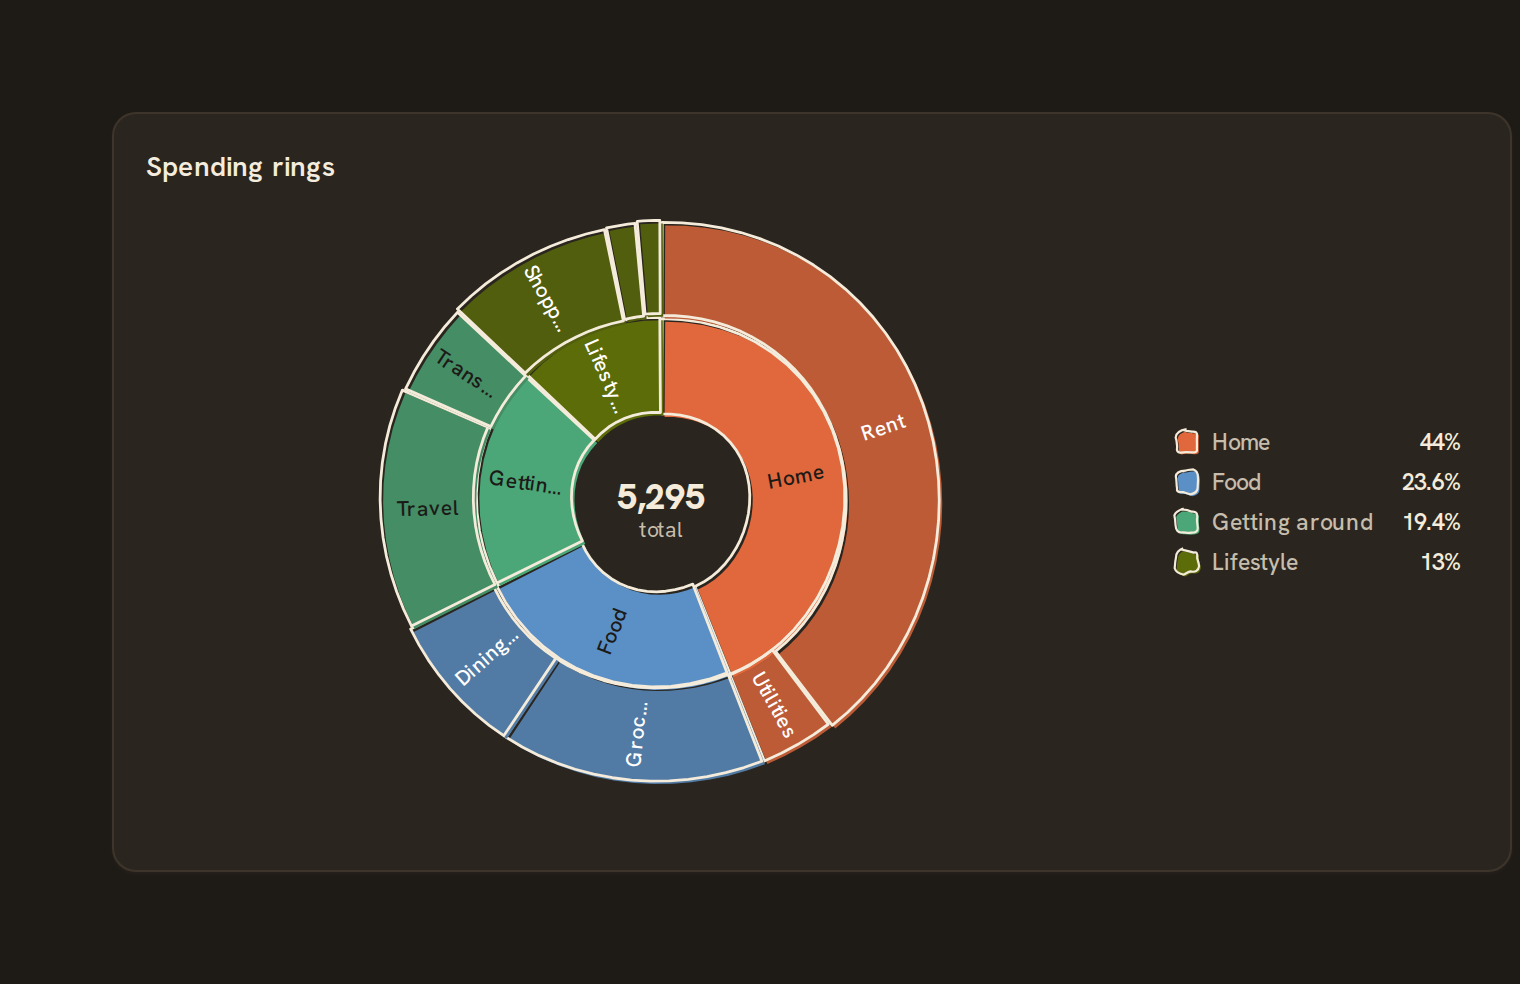 SunburstHierarchical radial wedges
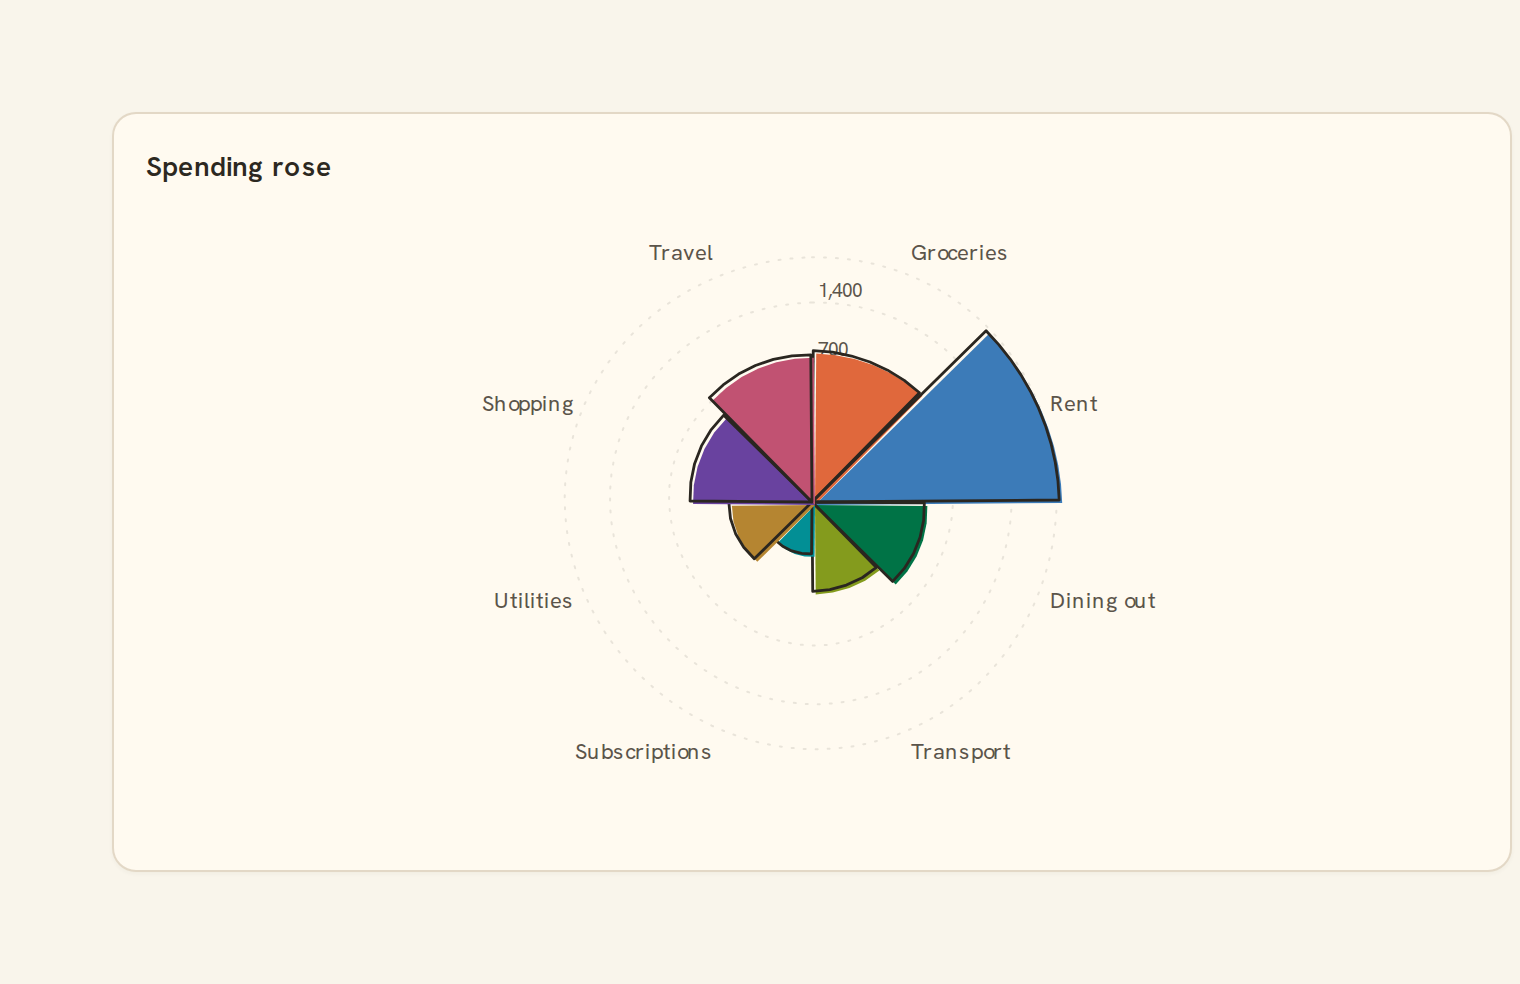
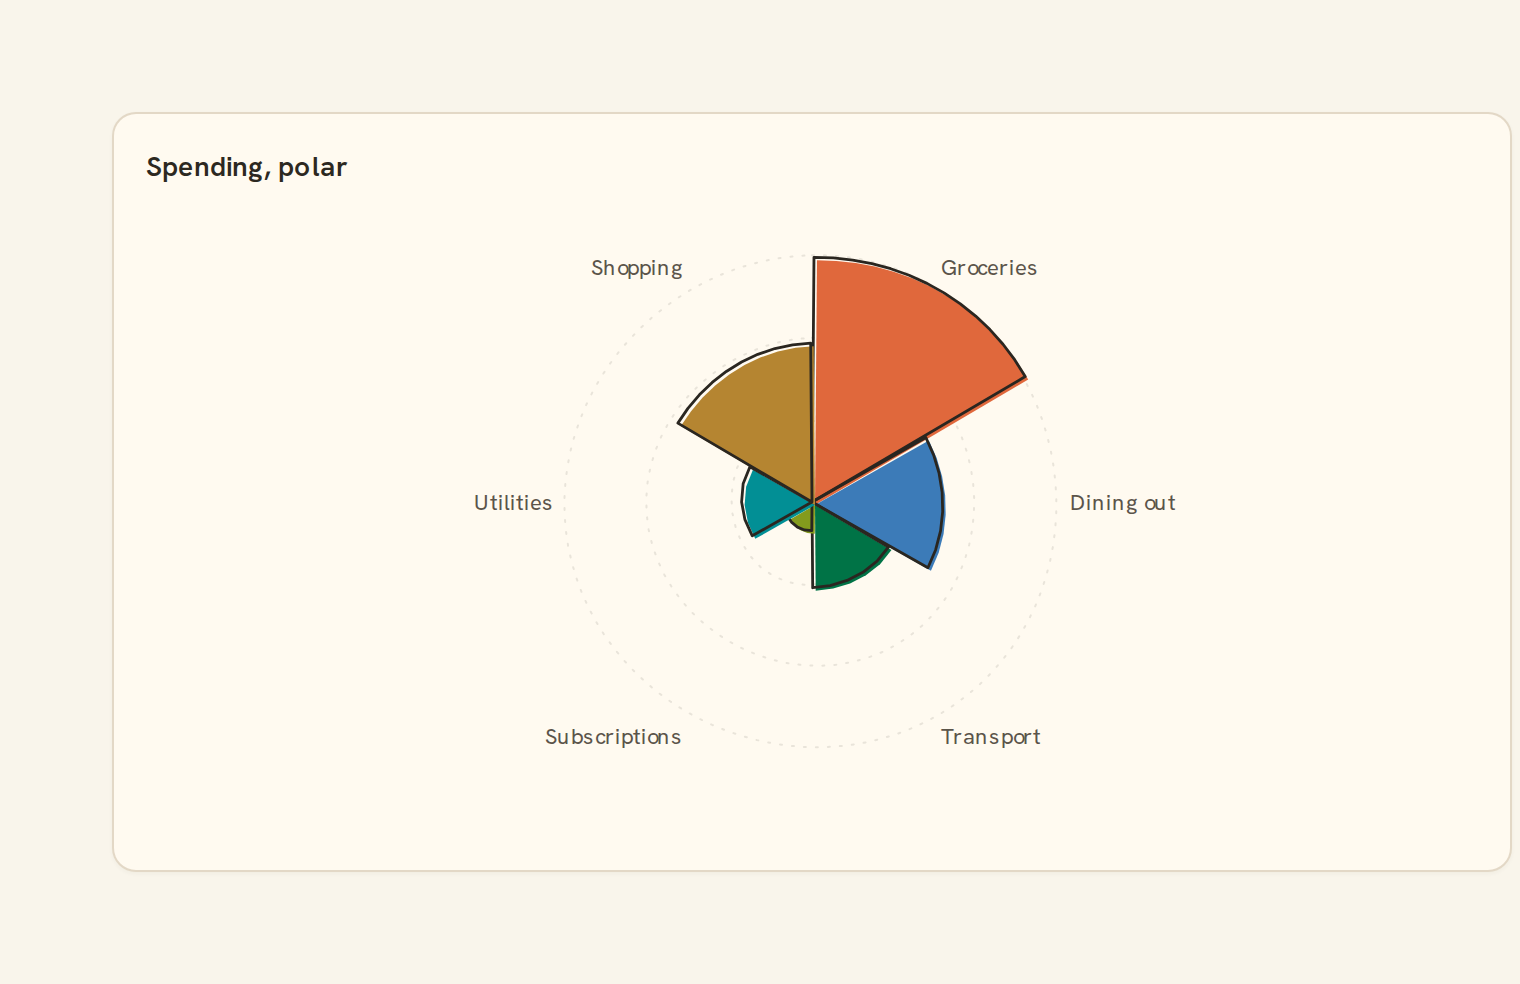
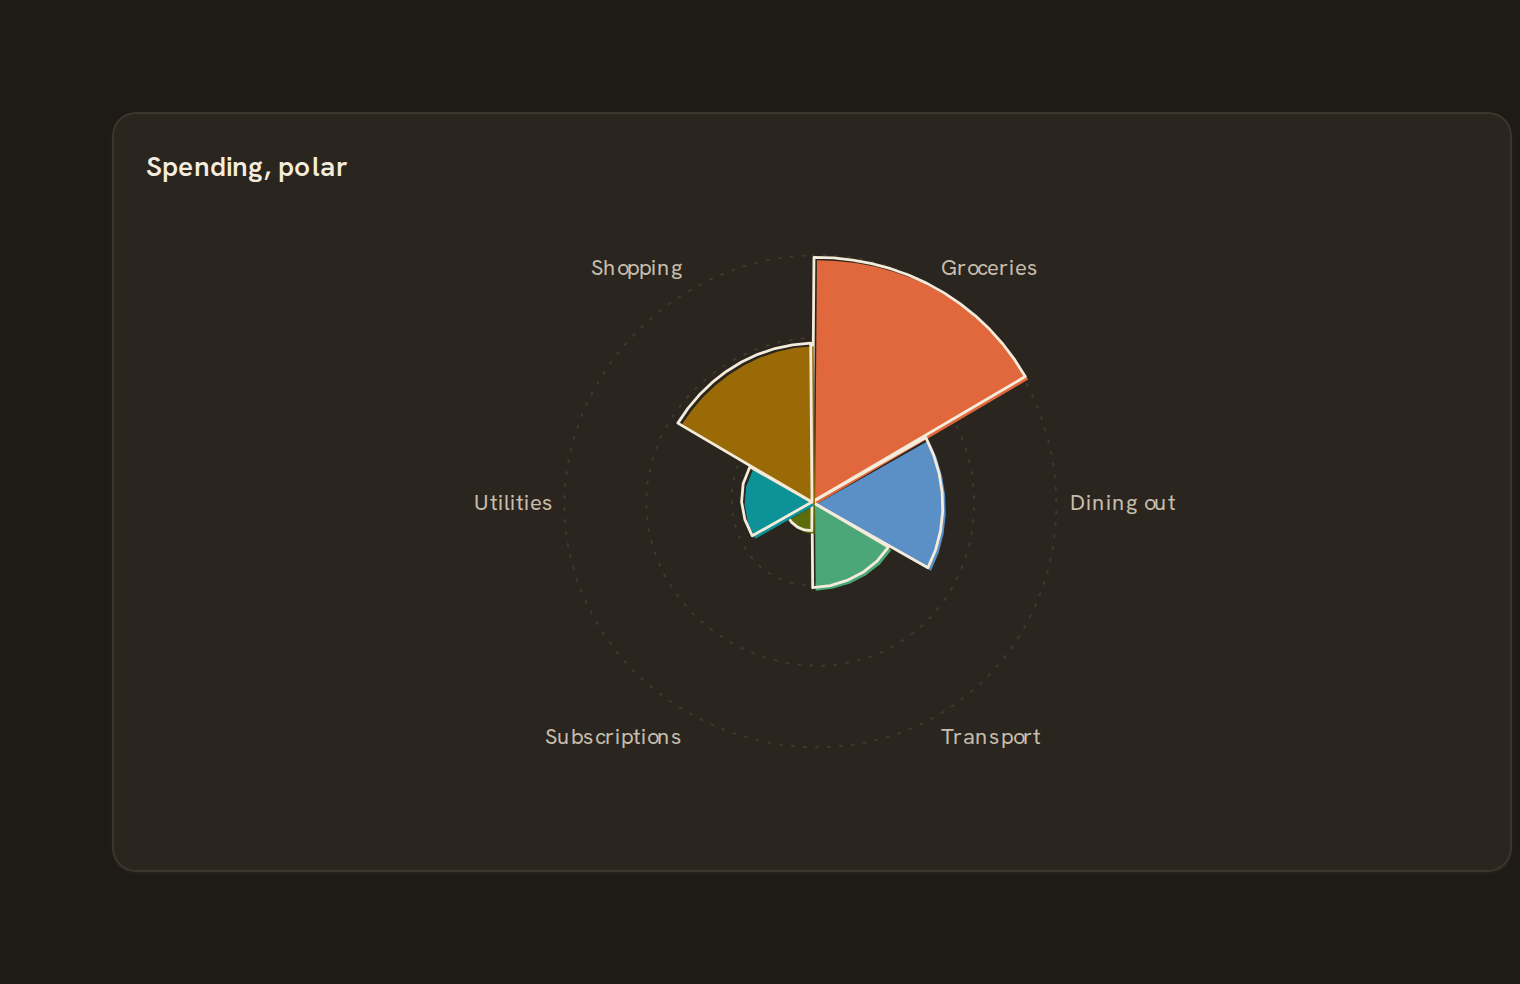
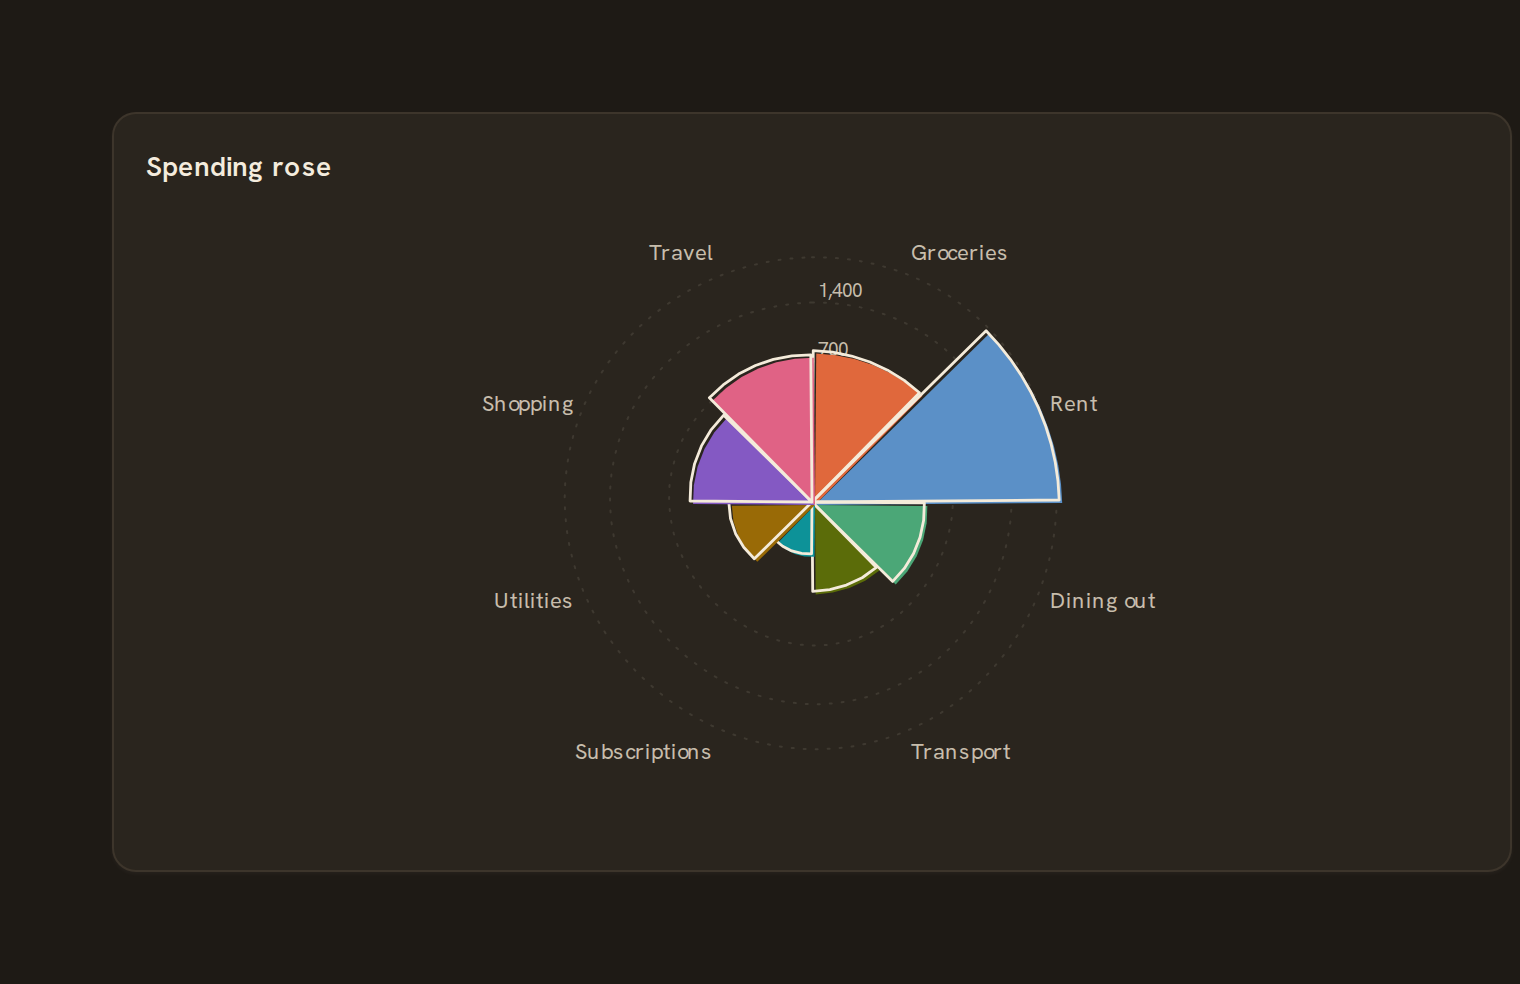 NightingaleRadial polar pie
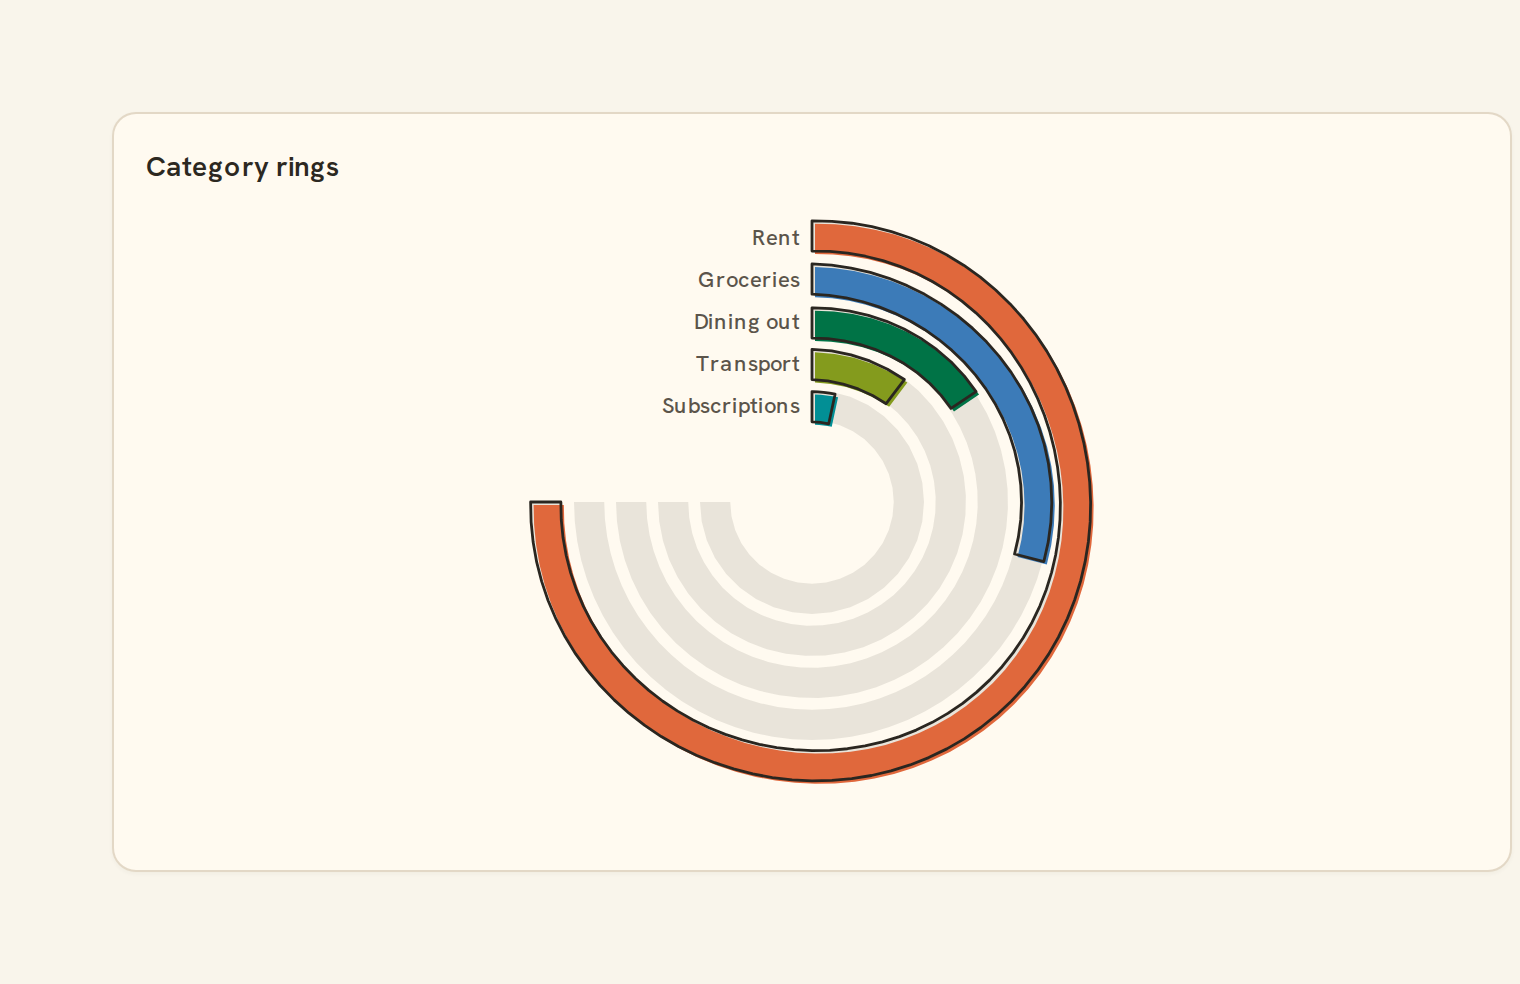
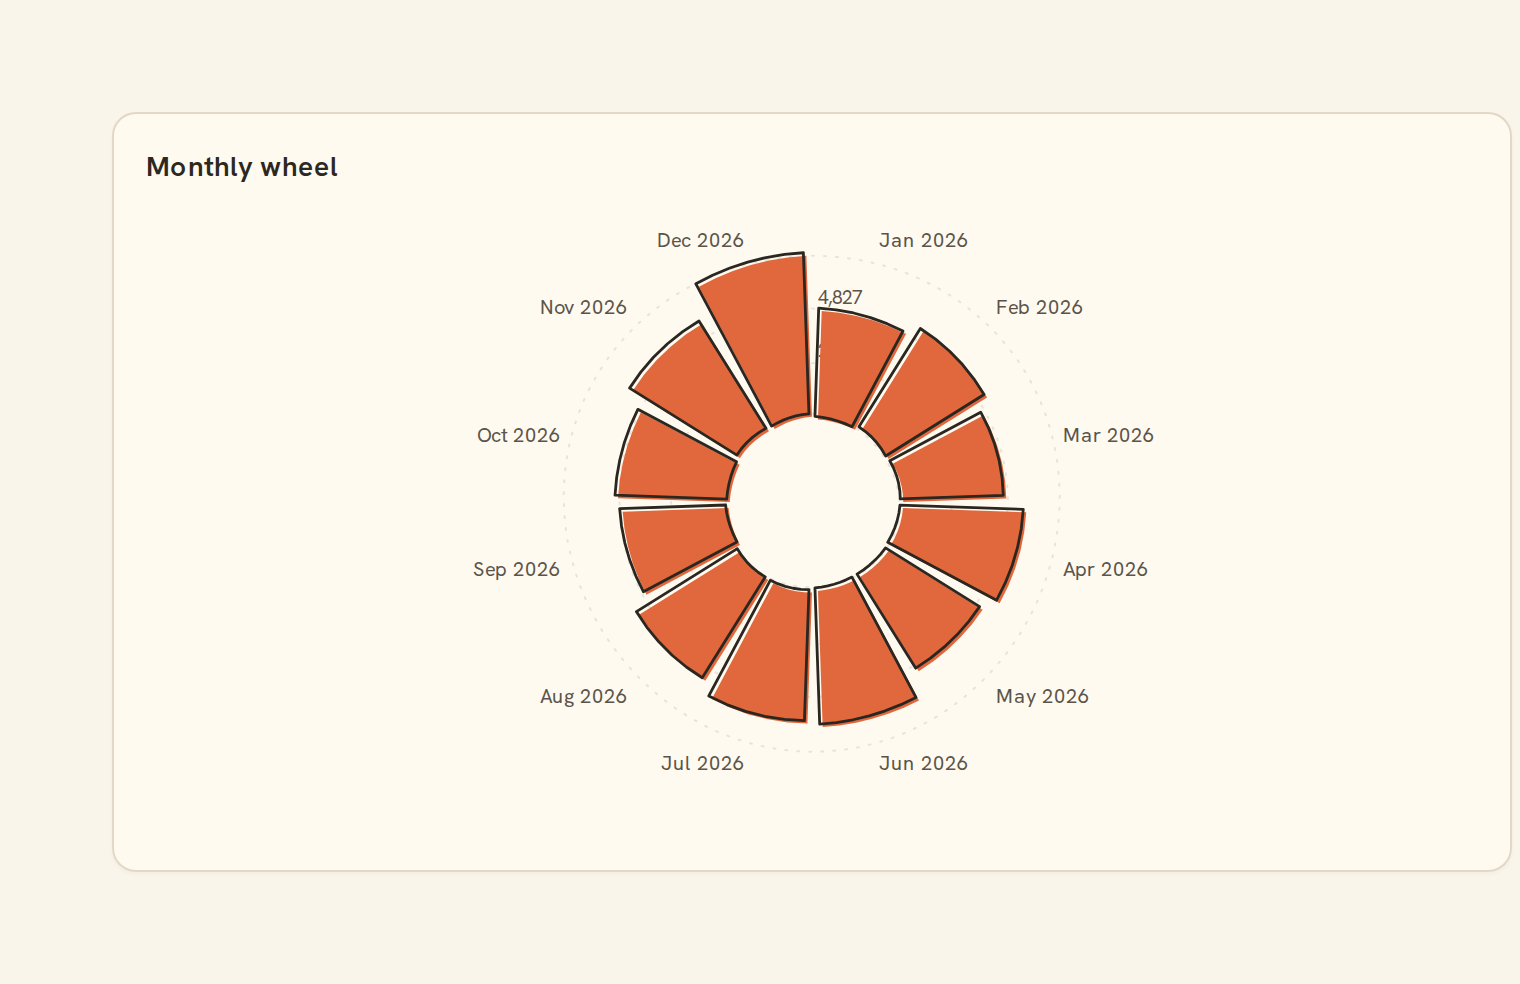
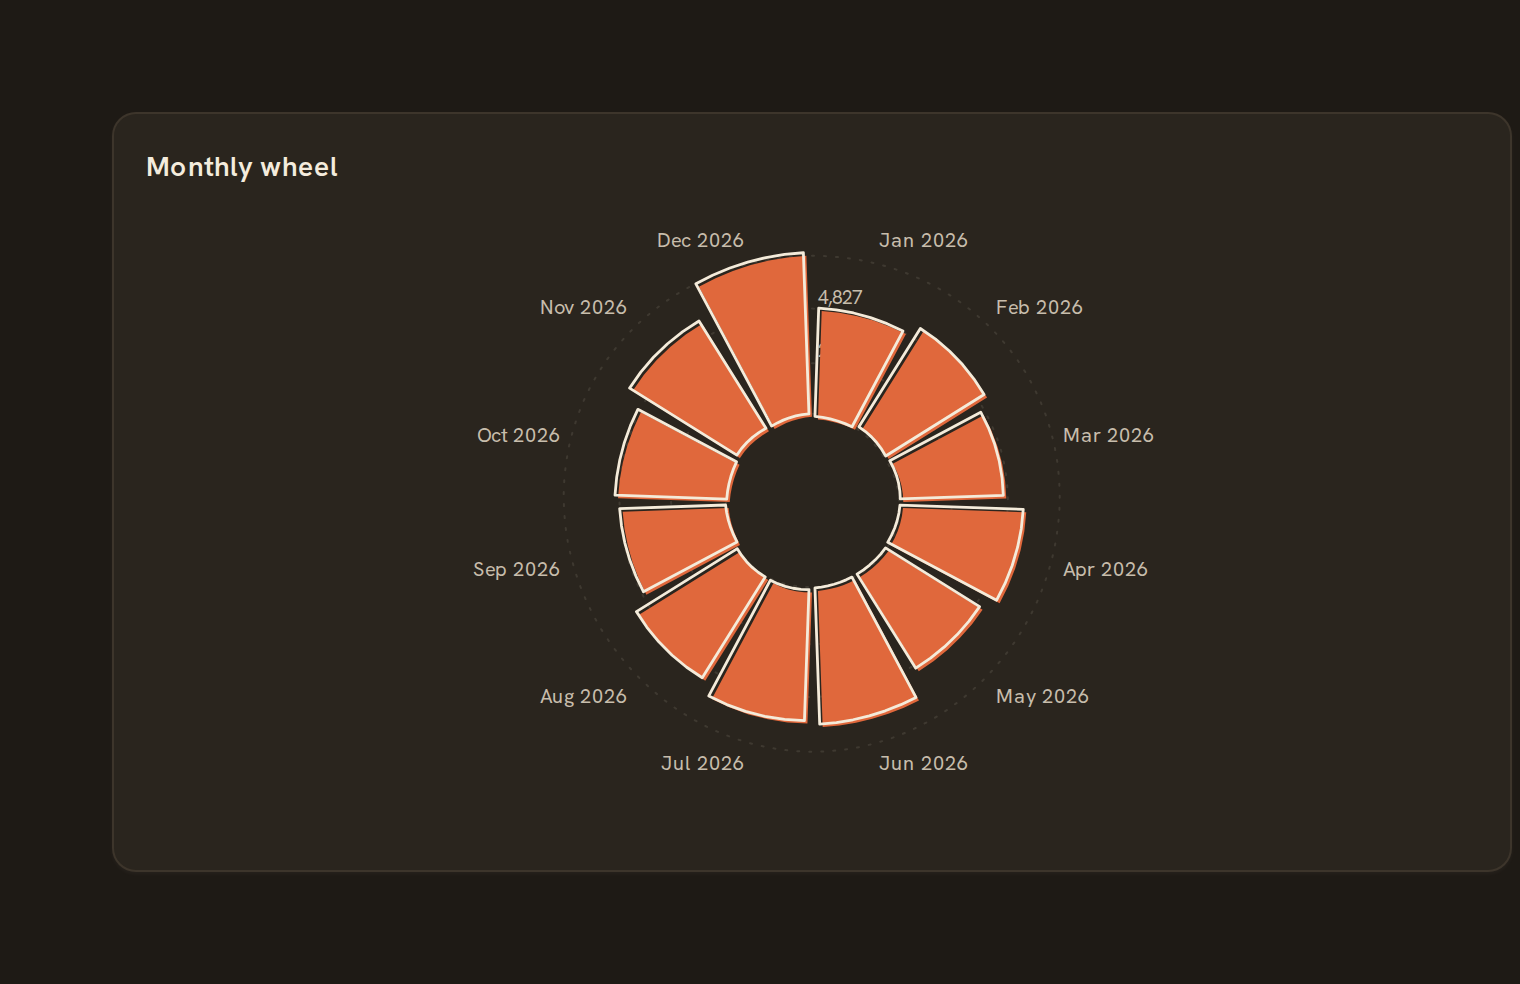
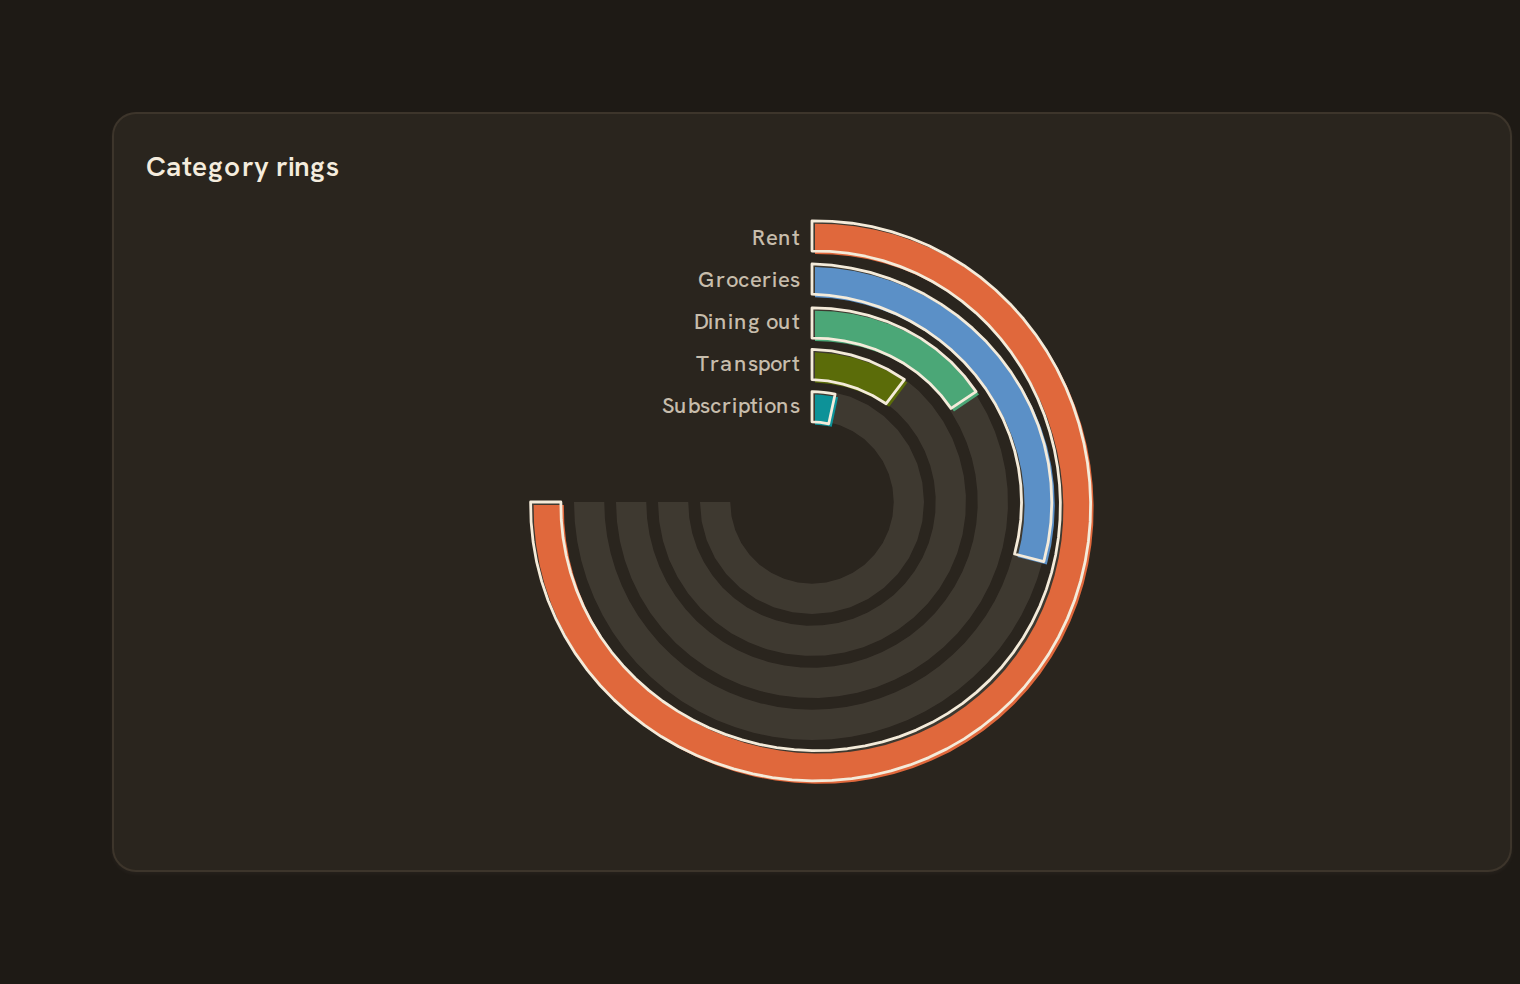 Radial barPolar bar chart
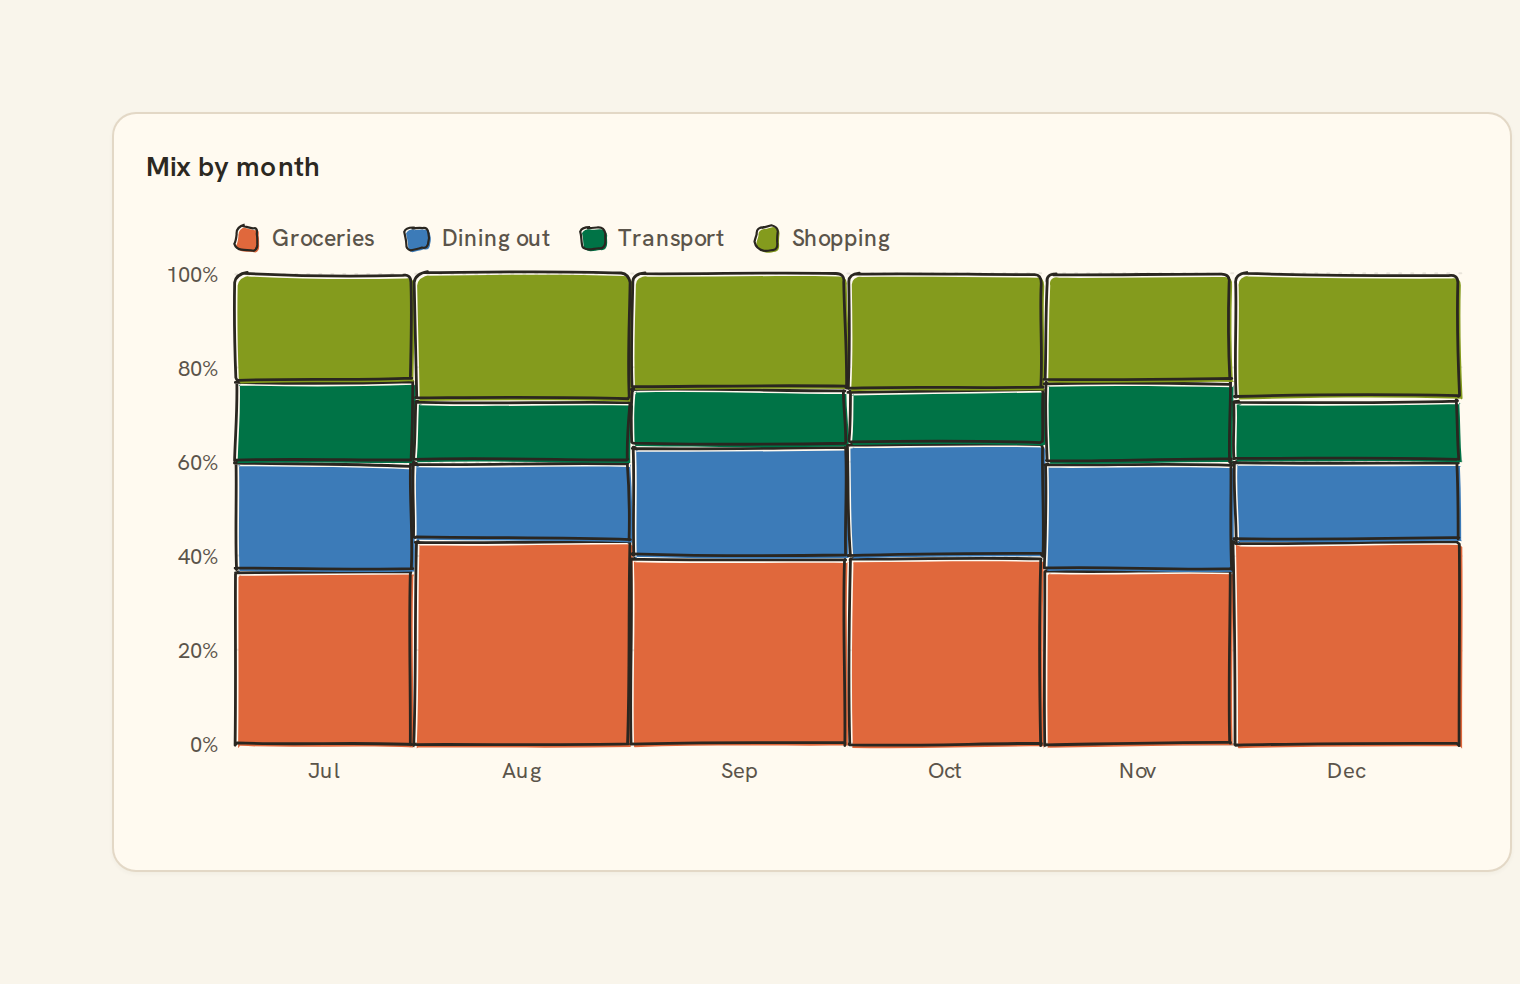
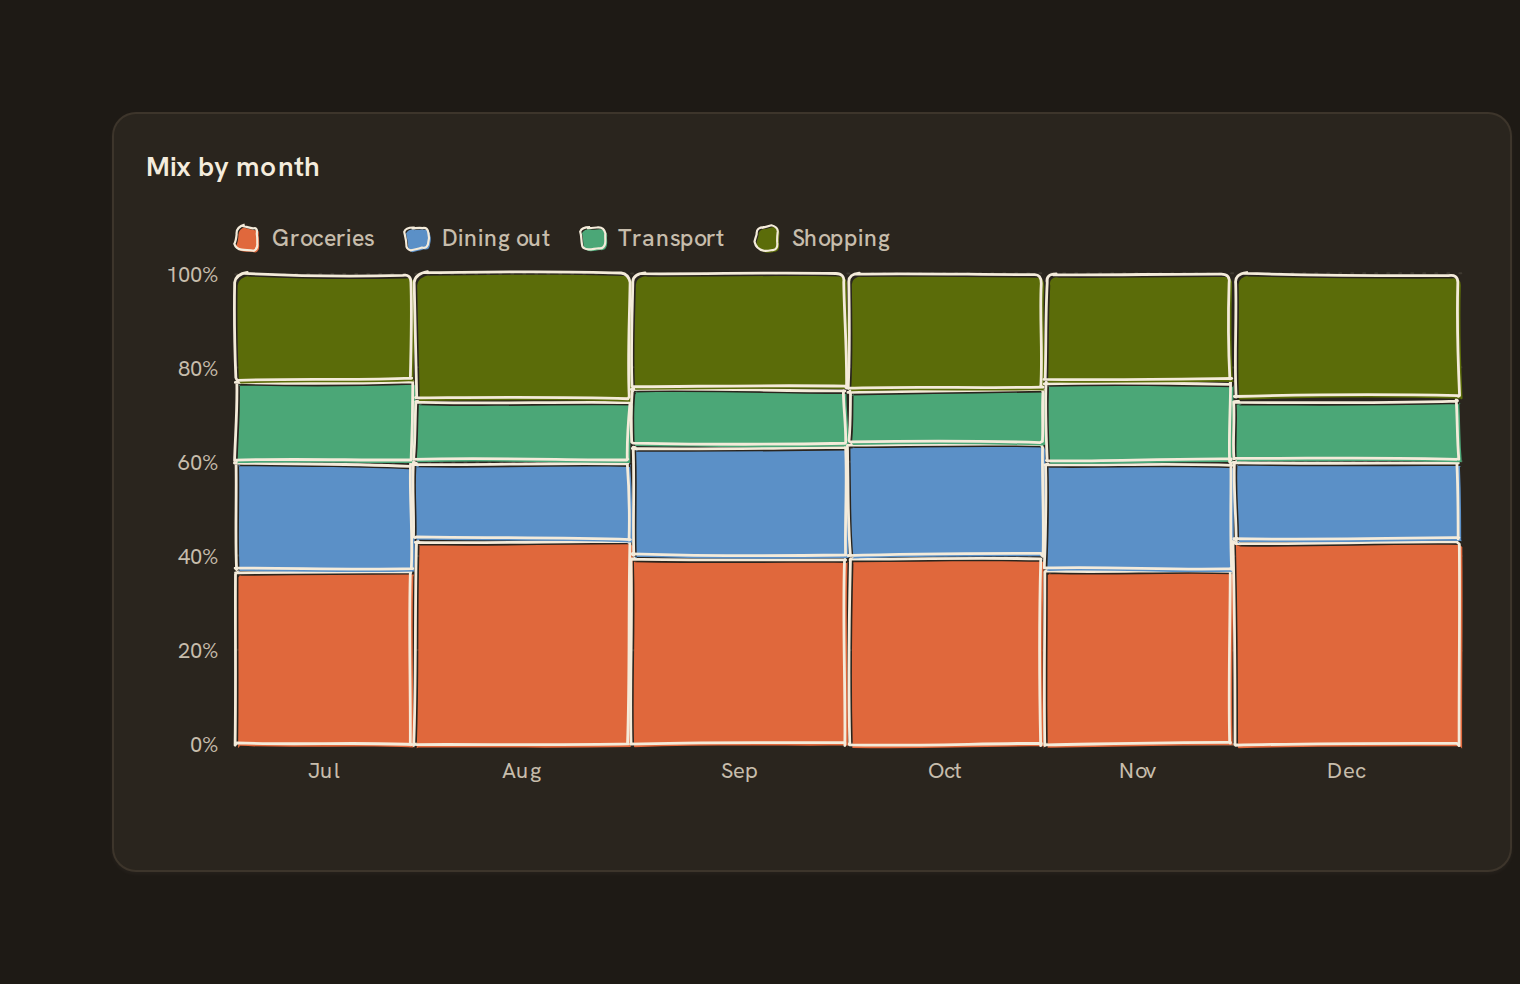 MosaicMarimekko tiled cells
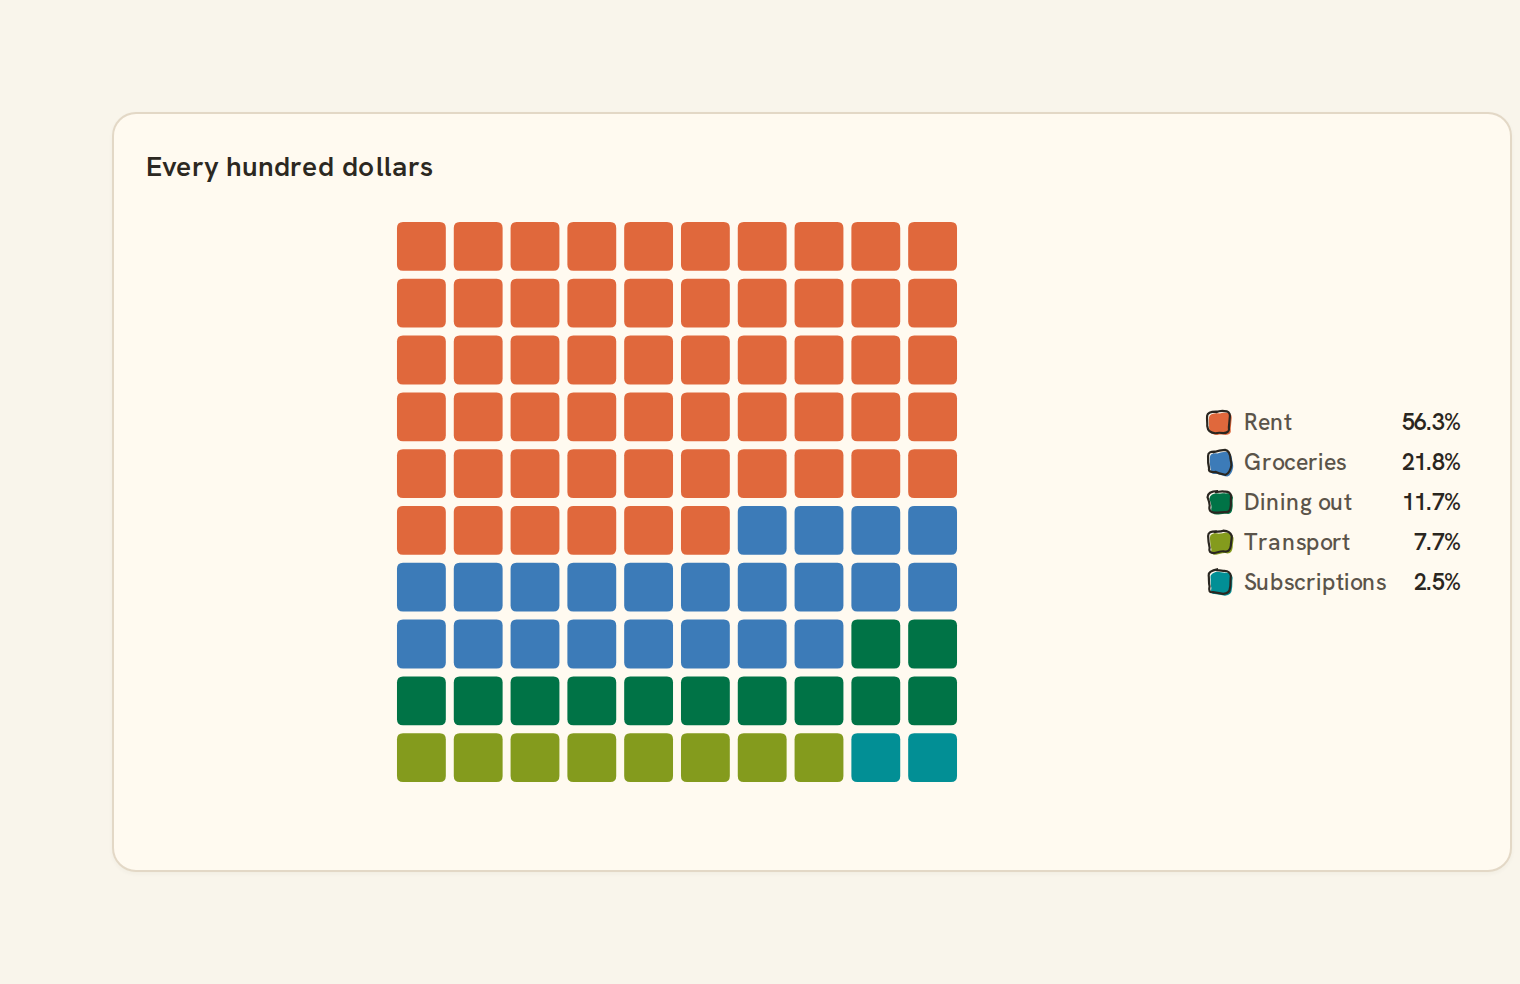
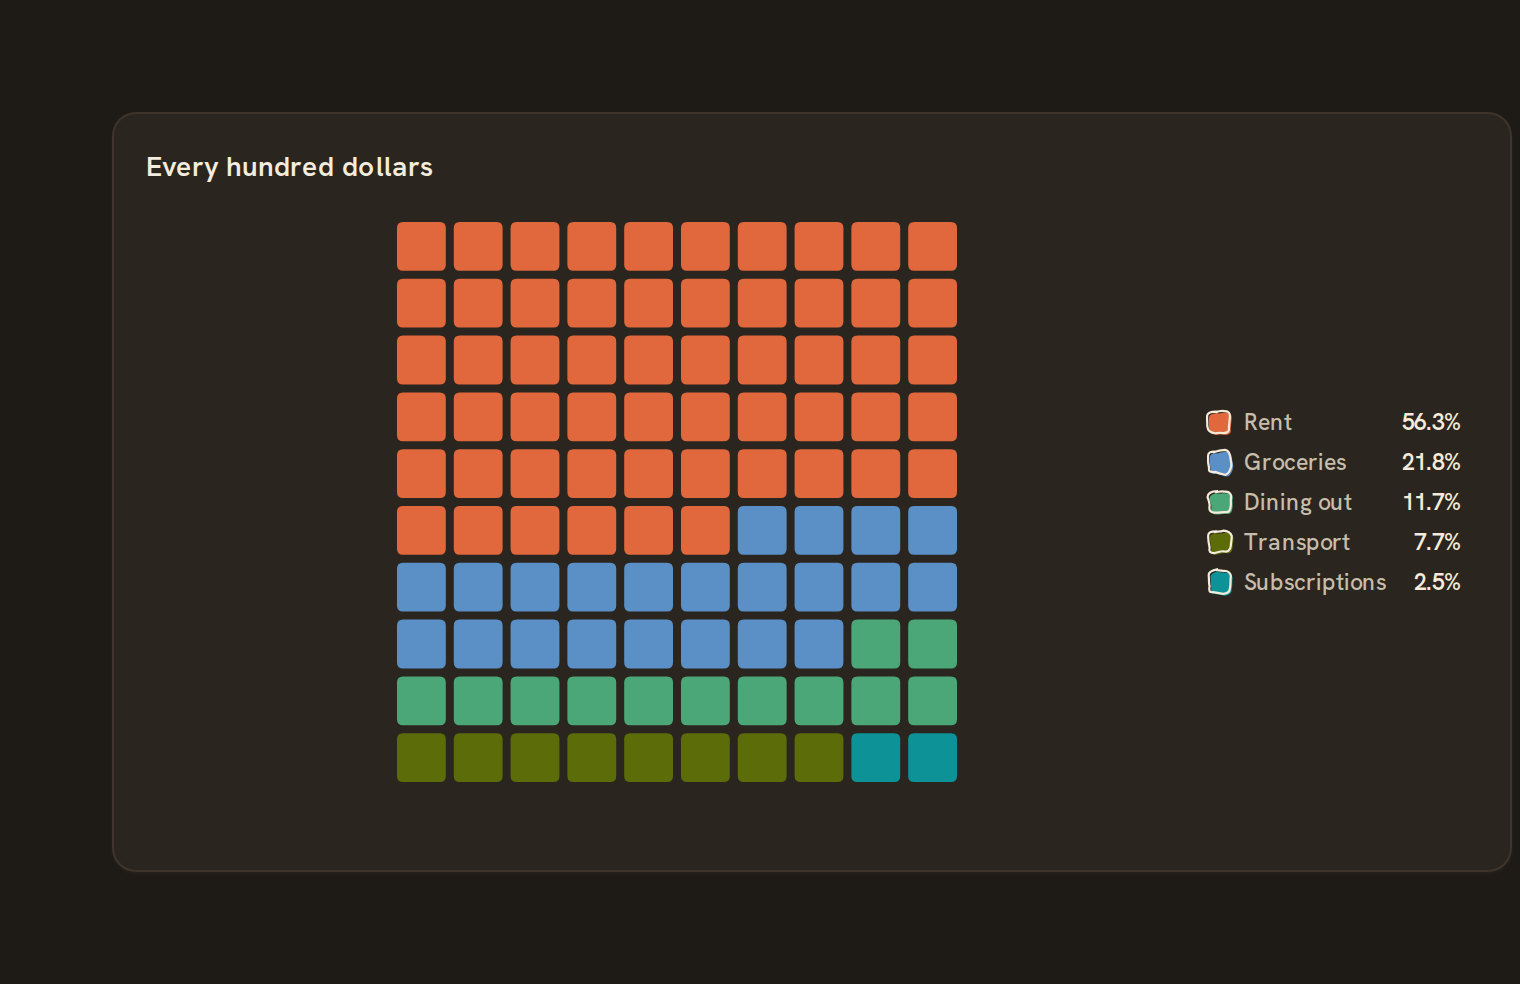 Waffle100-unit grid share
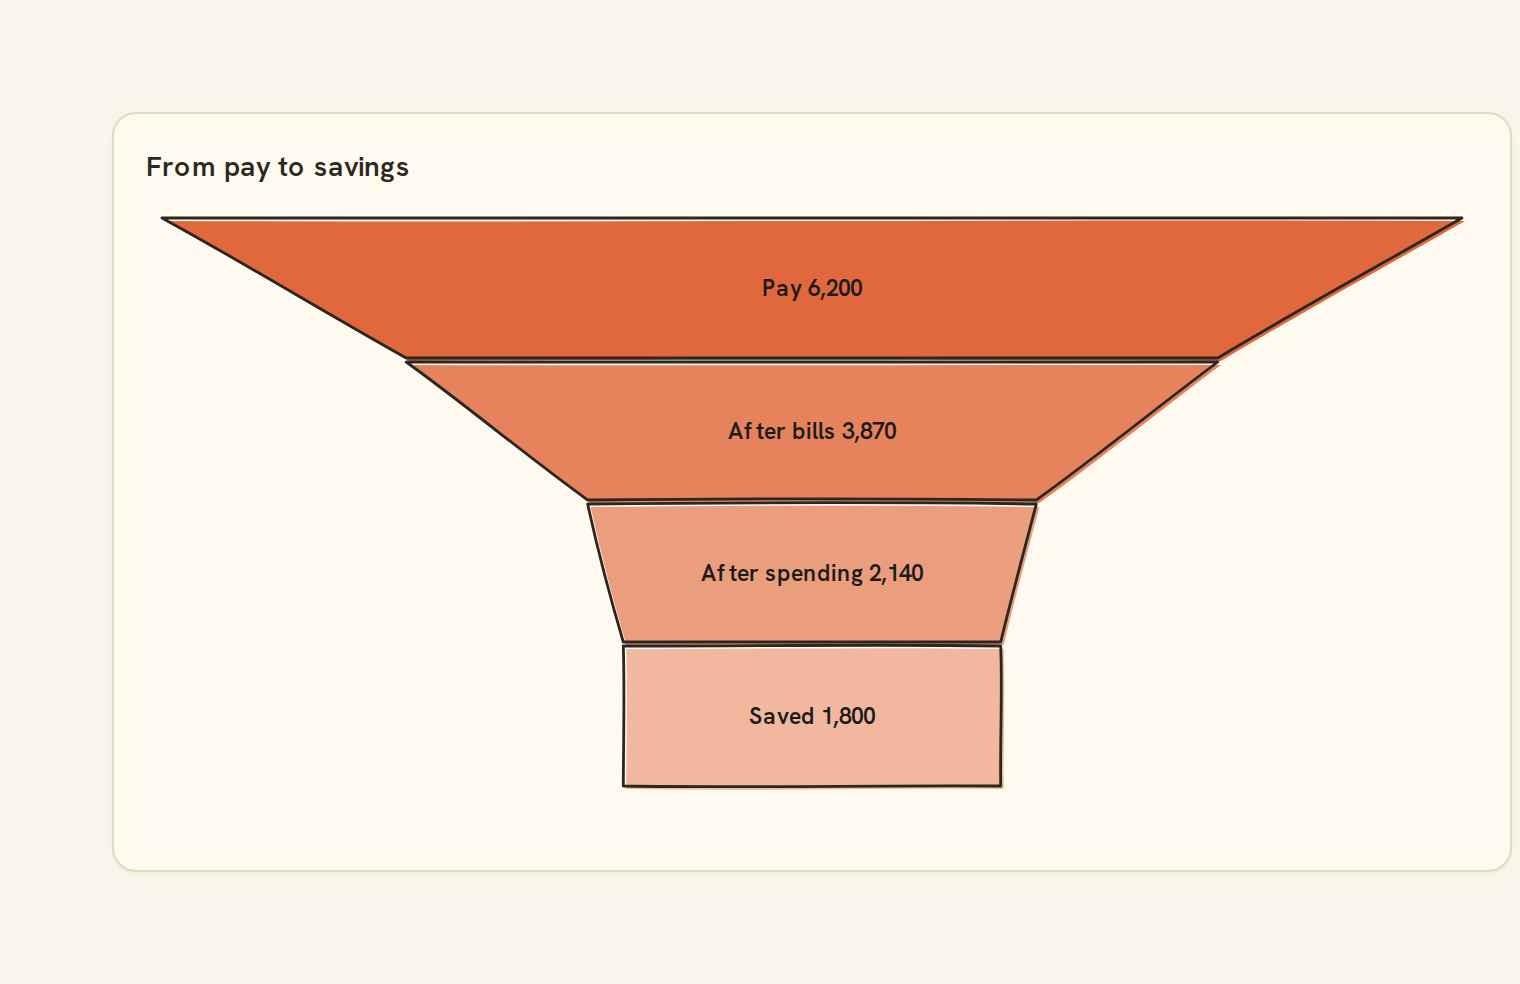
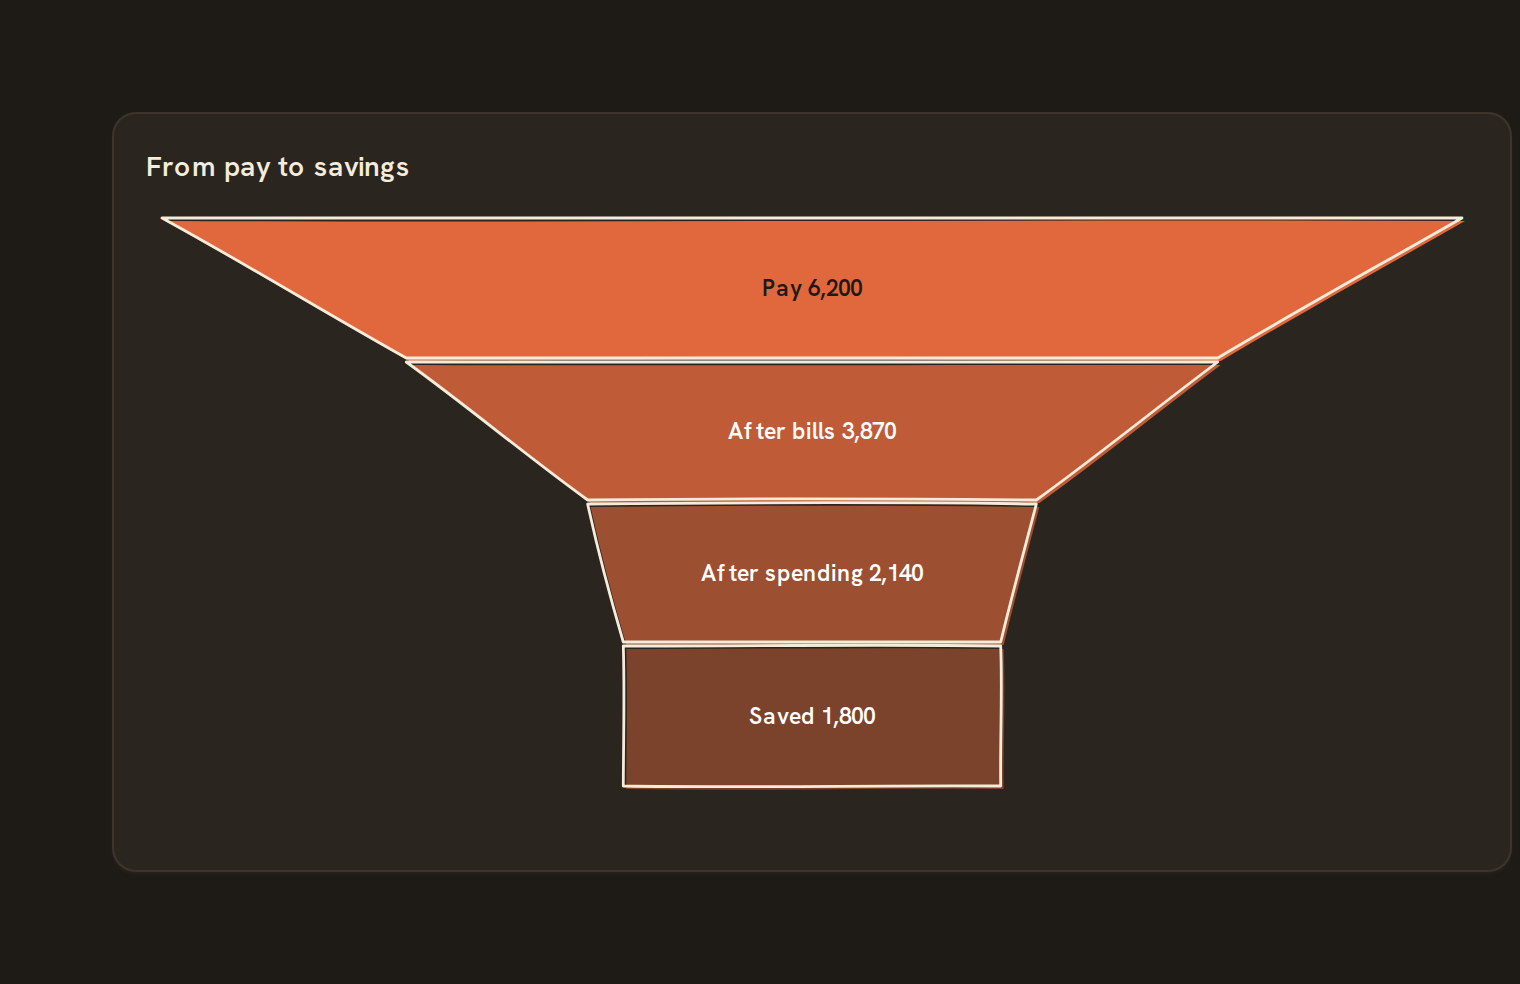 FunnelConversion stage flow
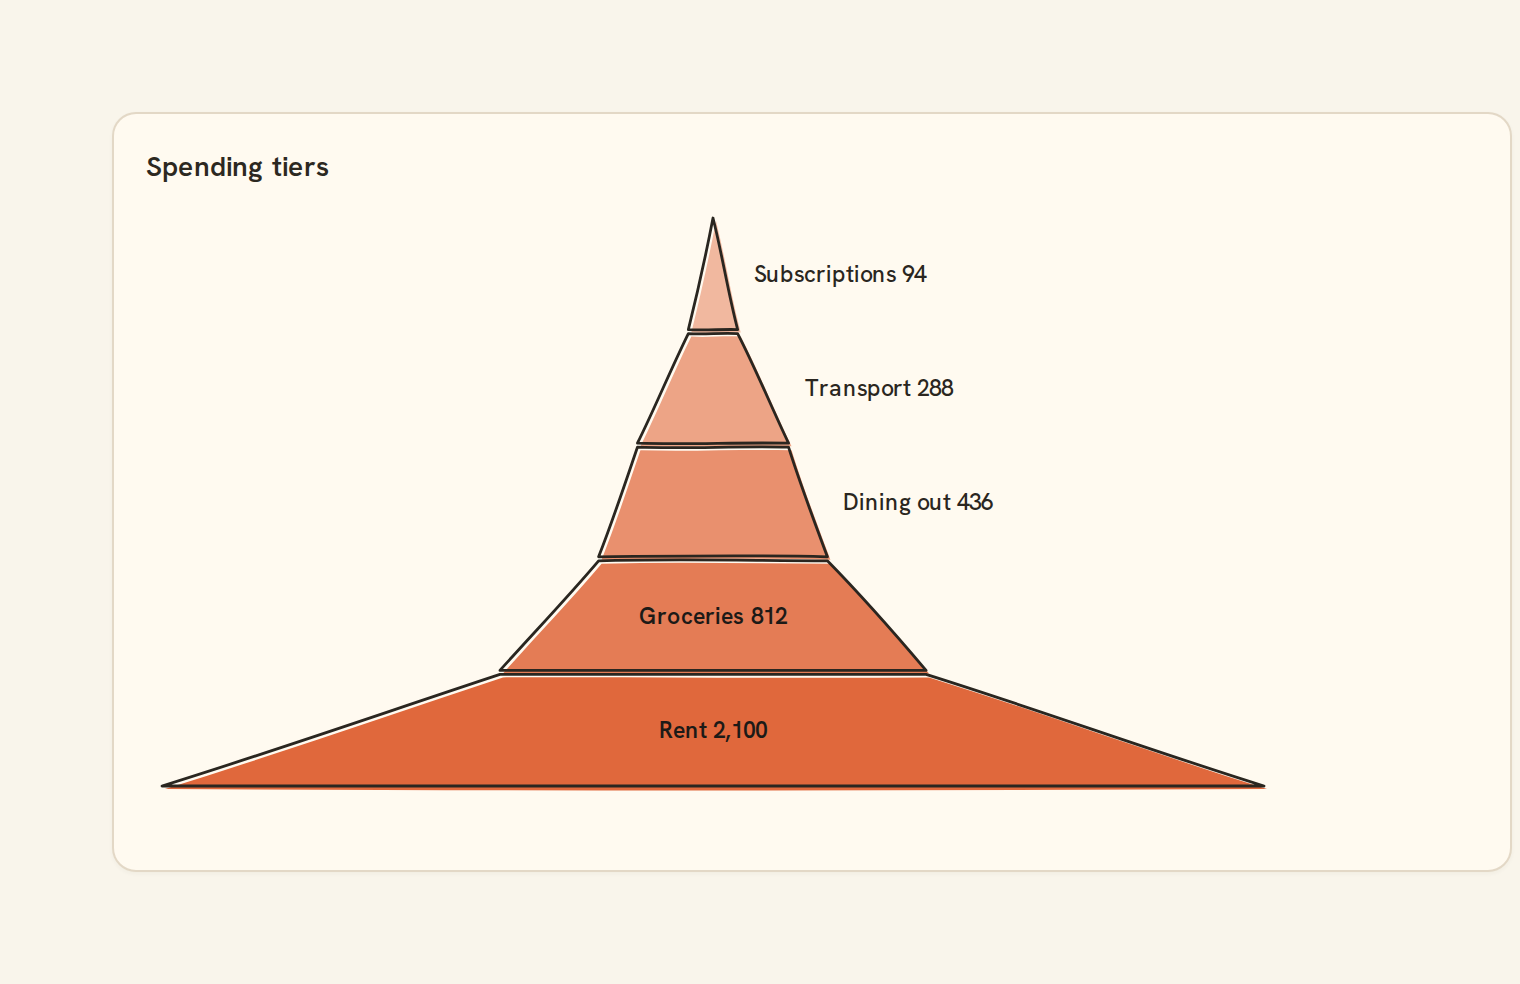
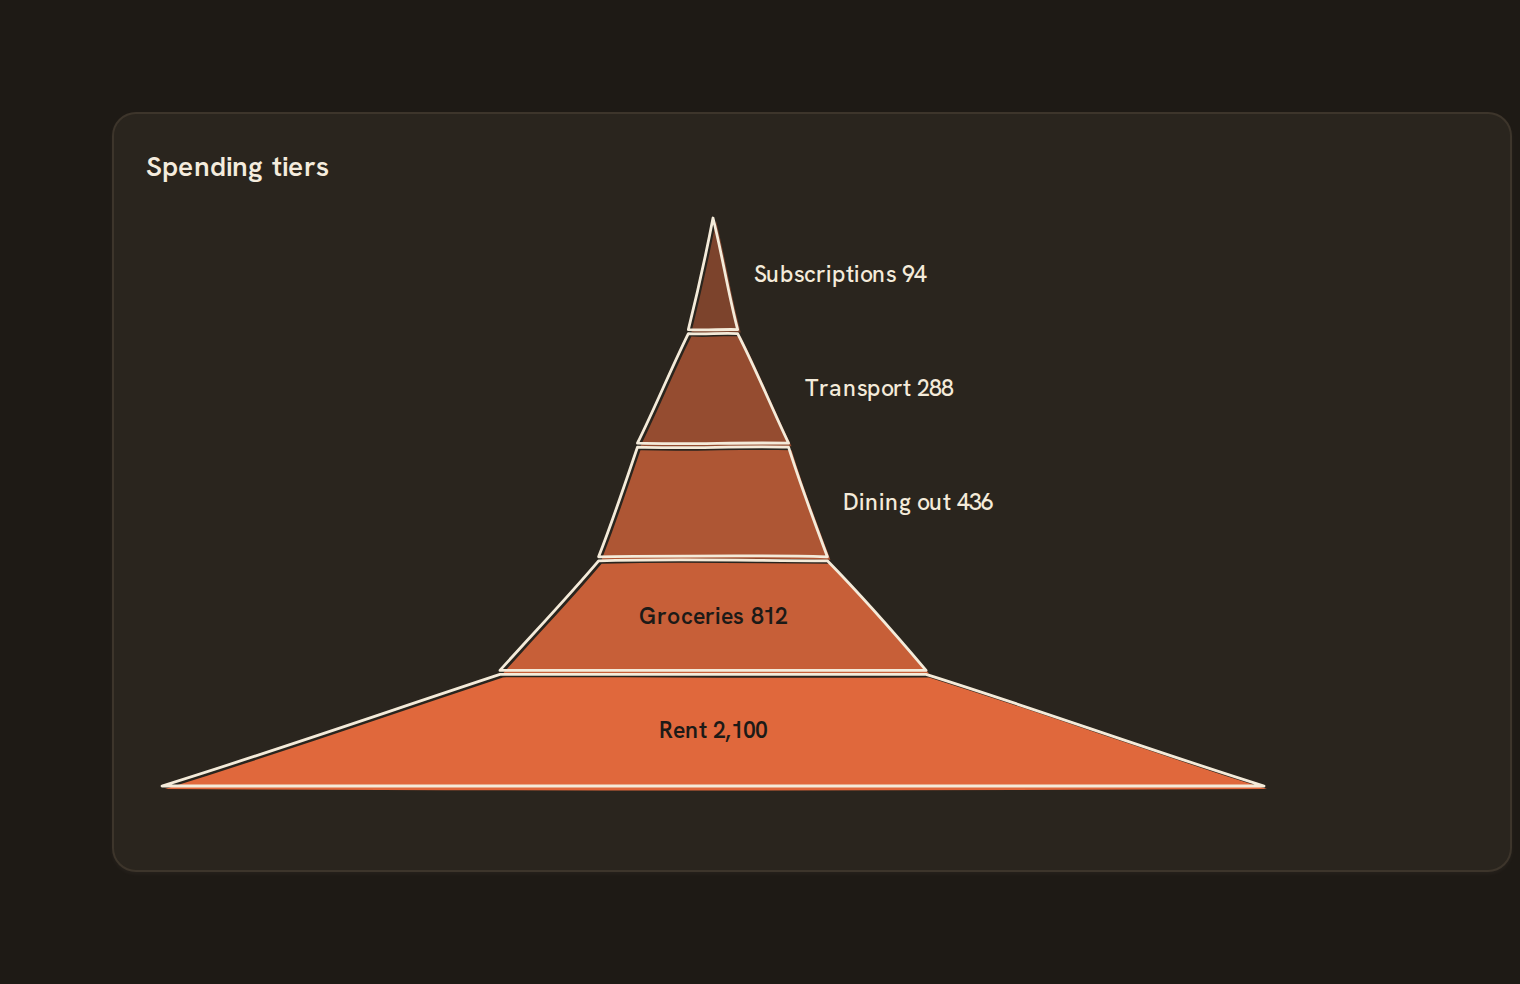 PyramidInverted funnel
Radial#
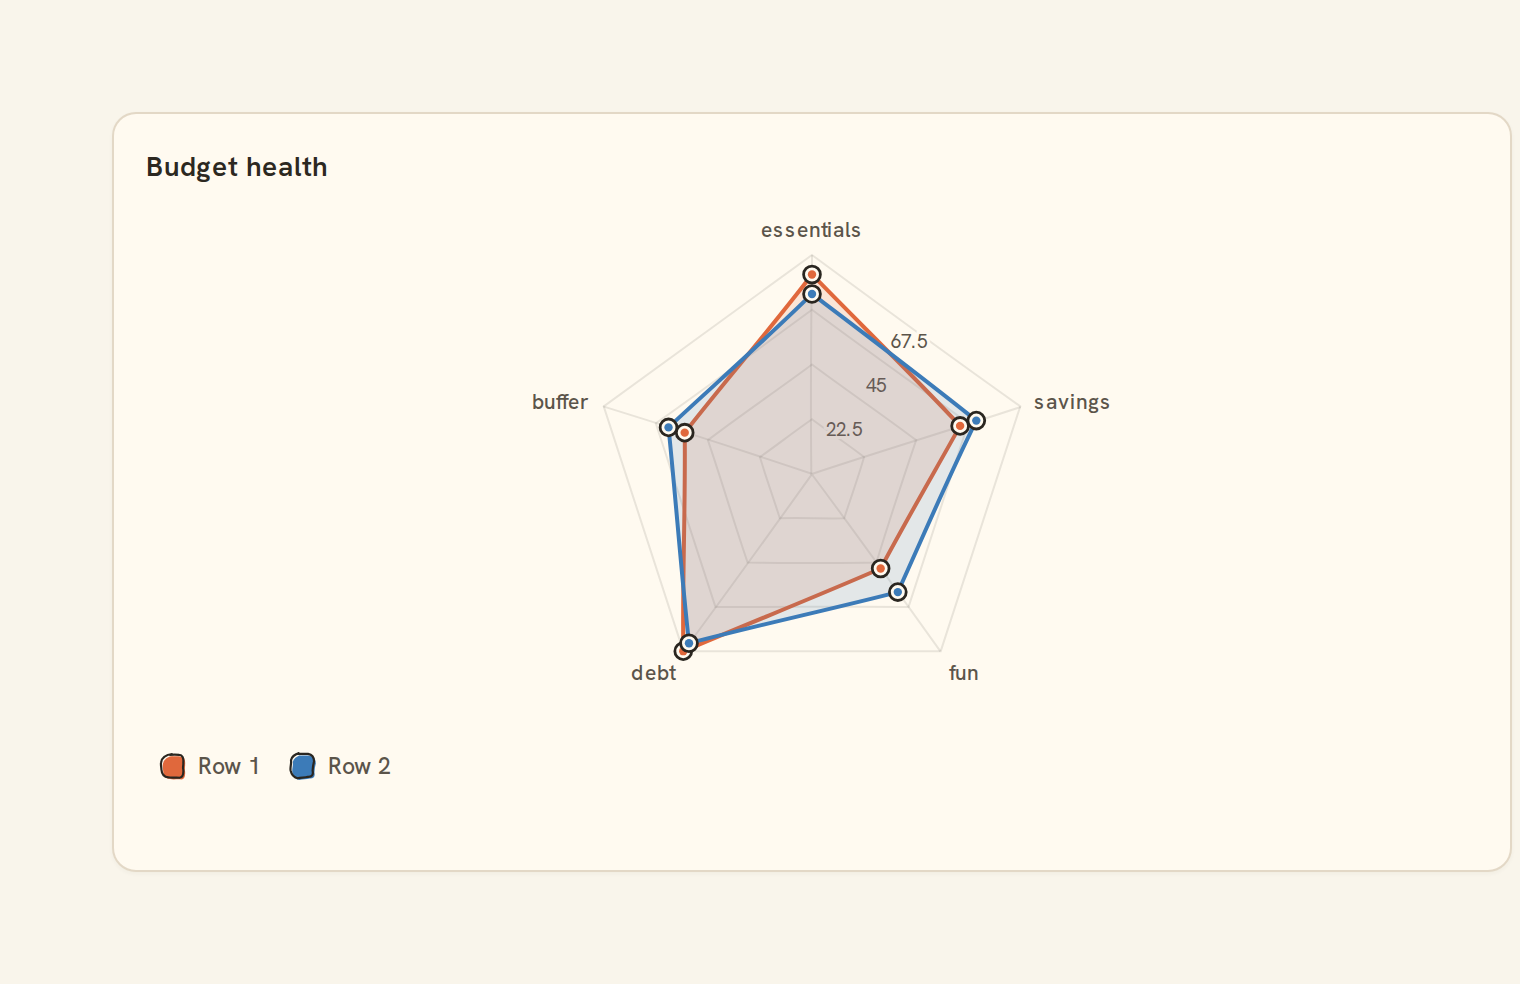
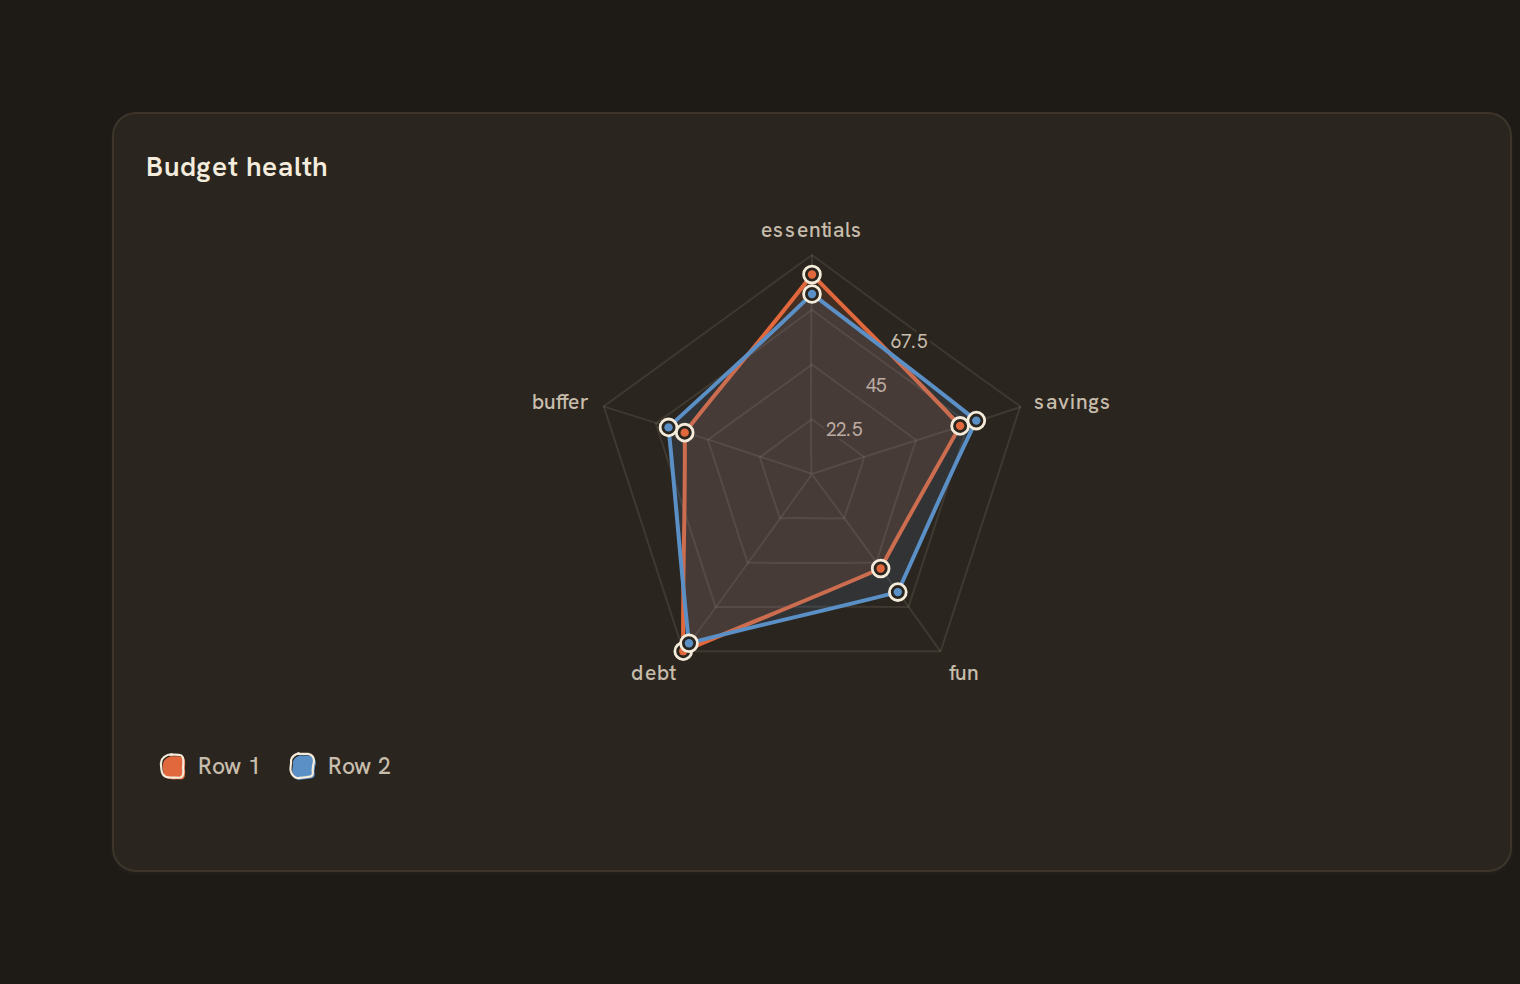
Matrix#
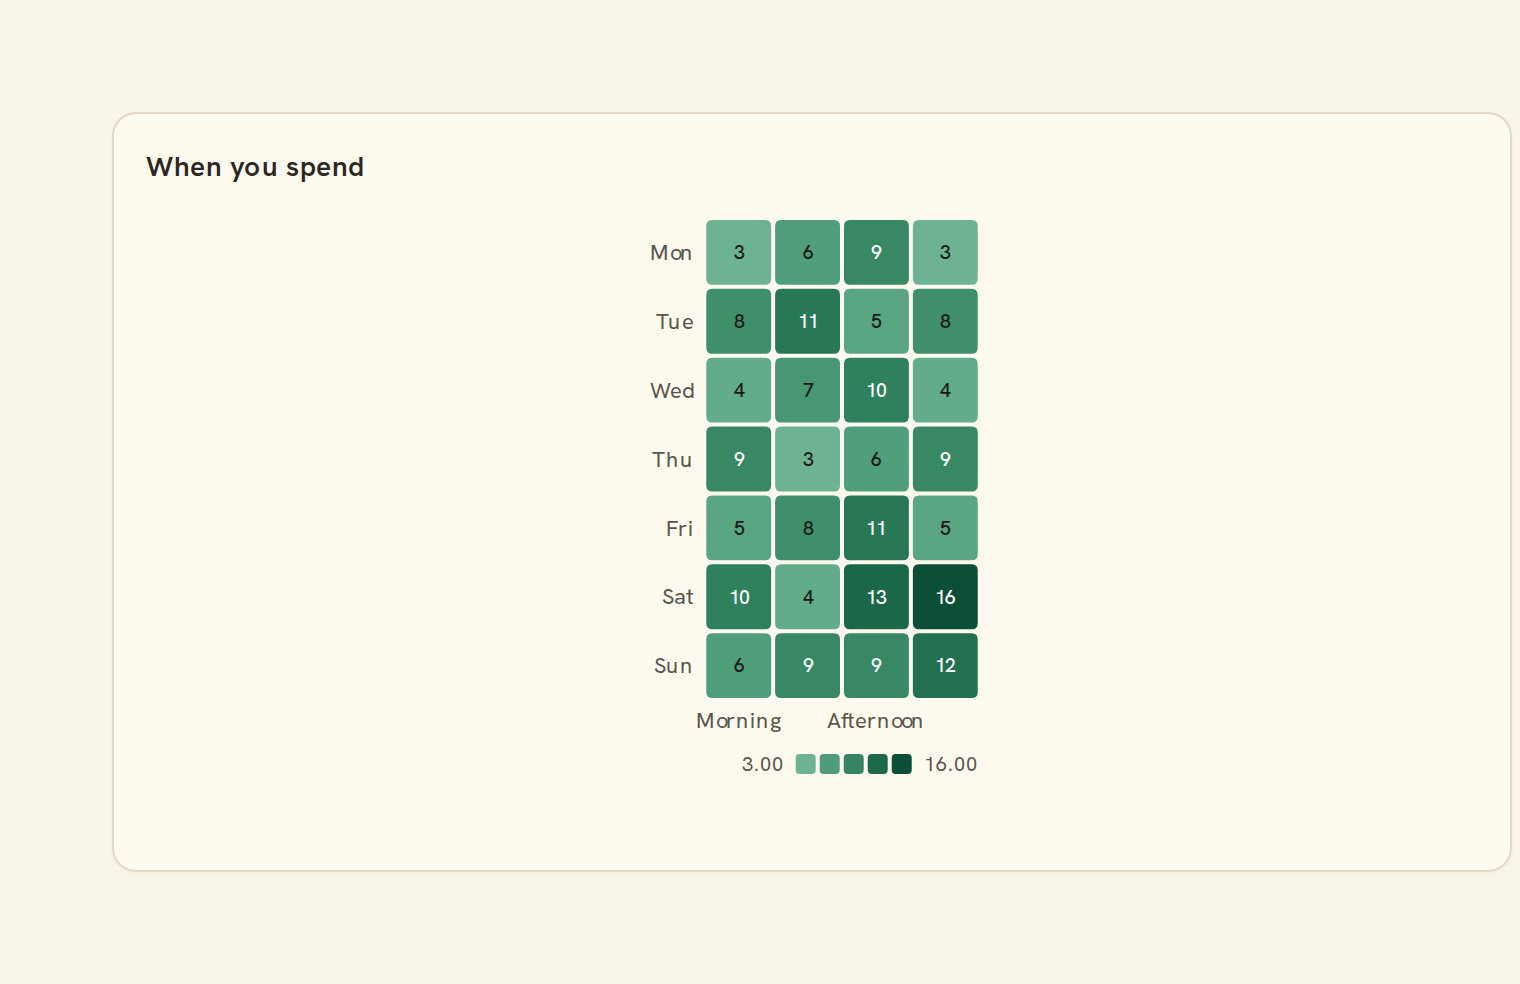
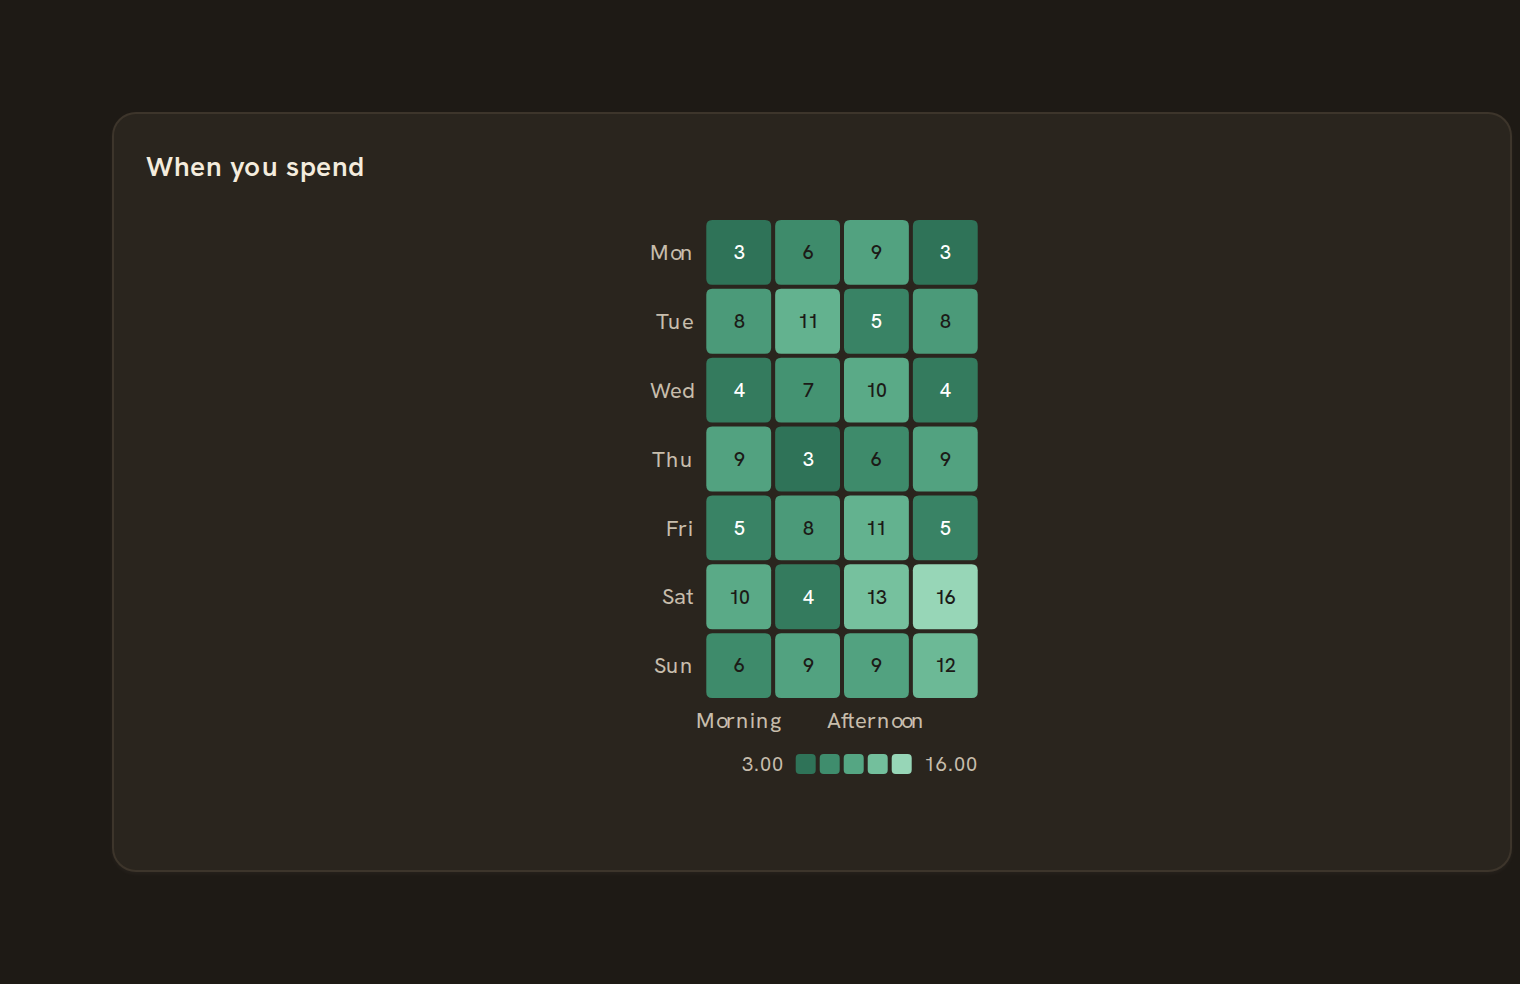 Heatmap matrixX/Y categorical heat
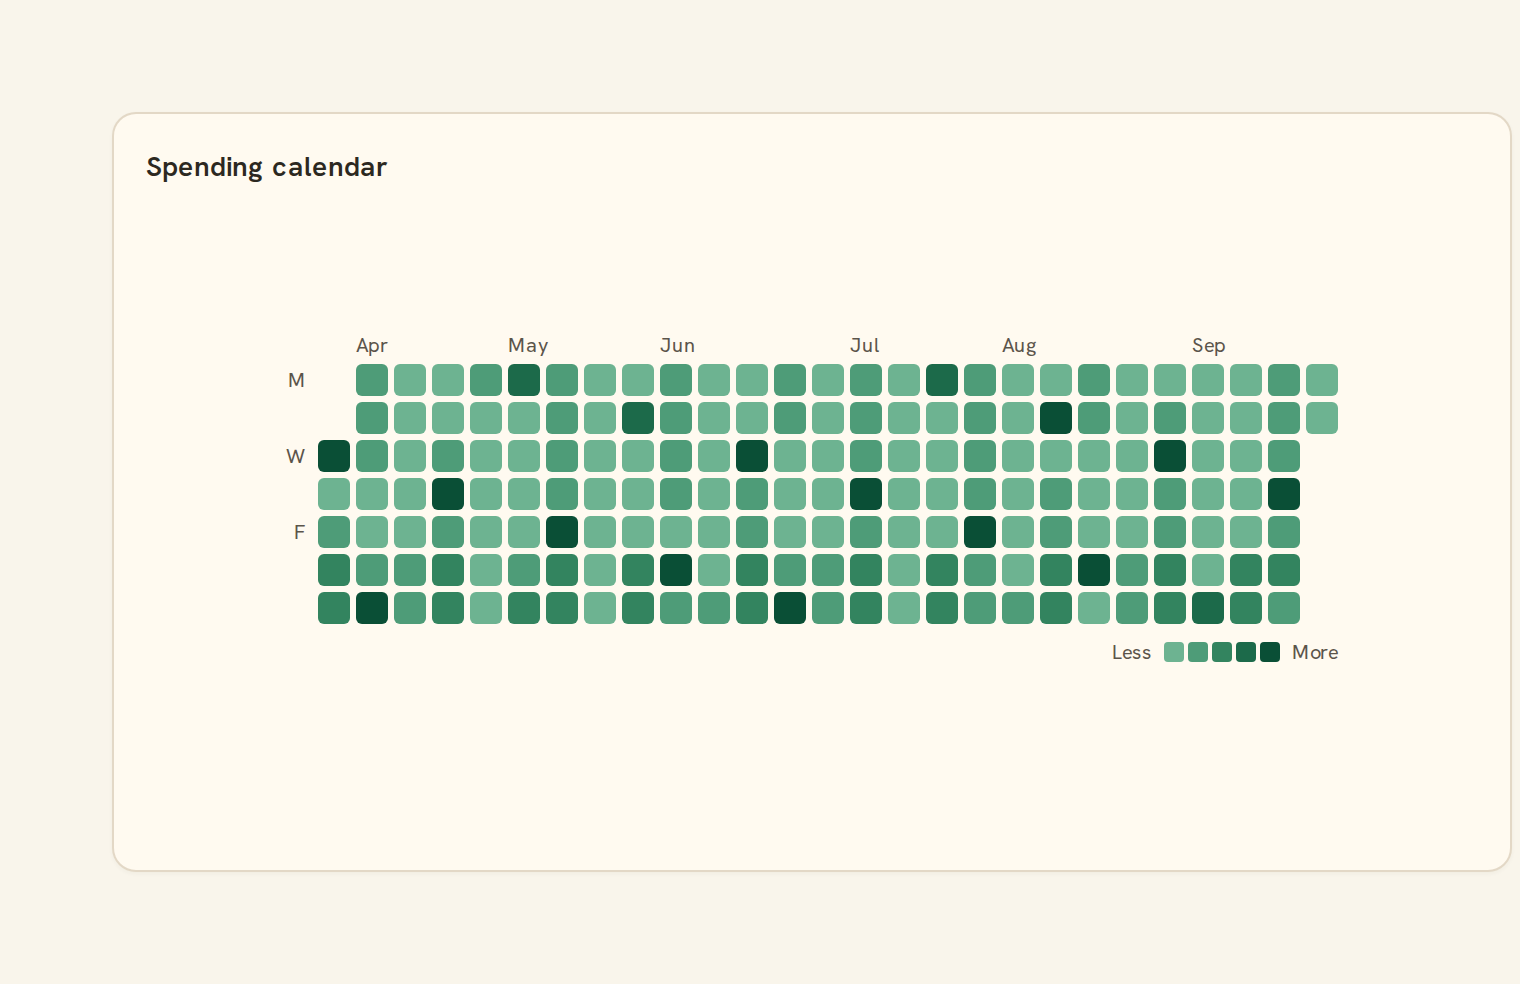
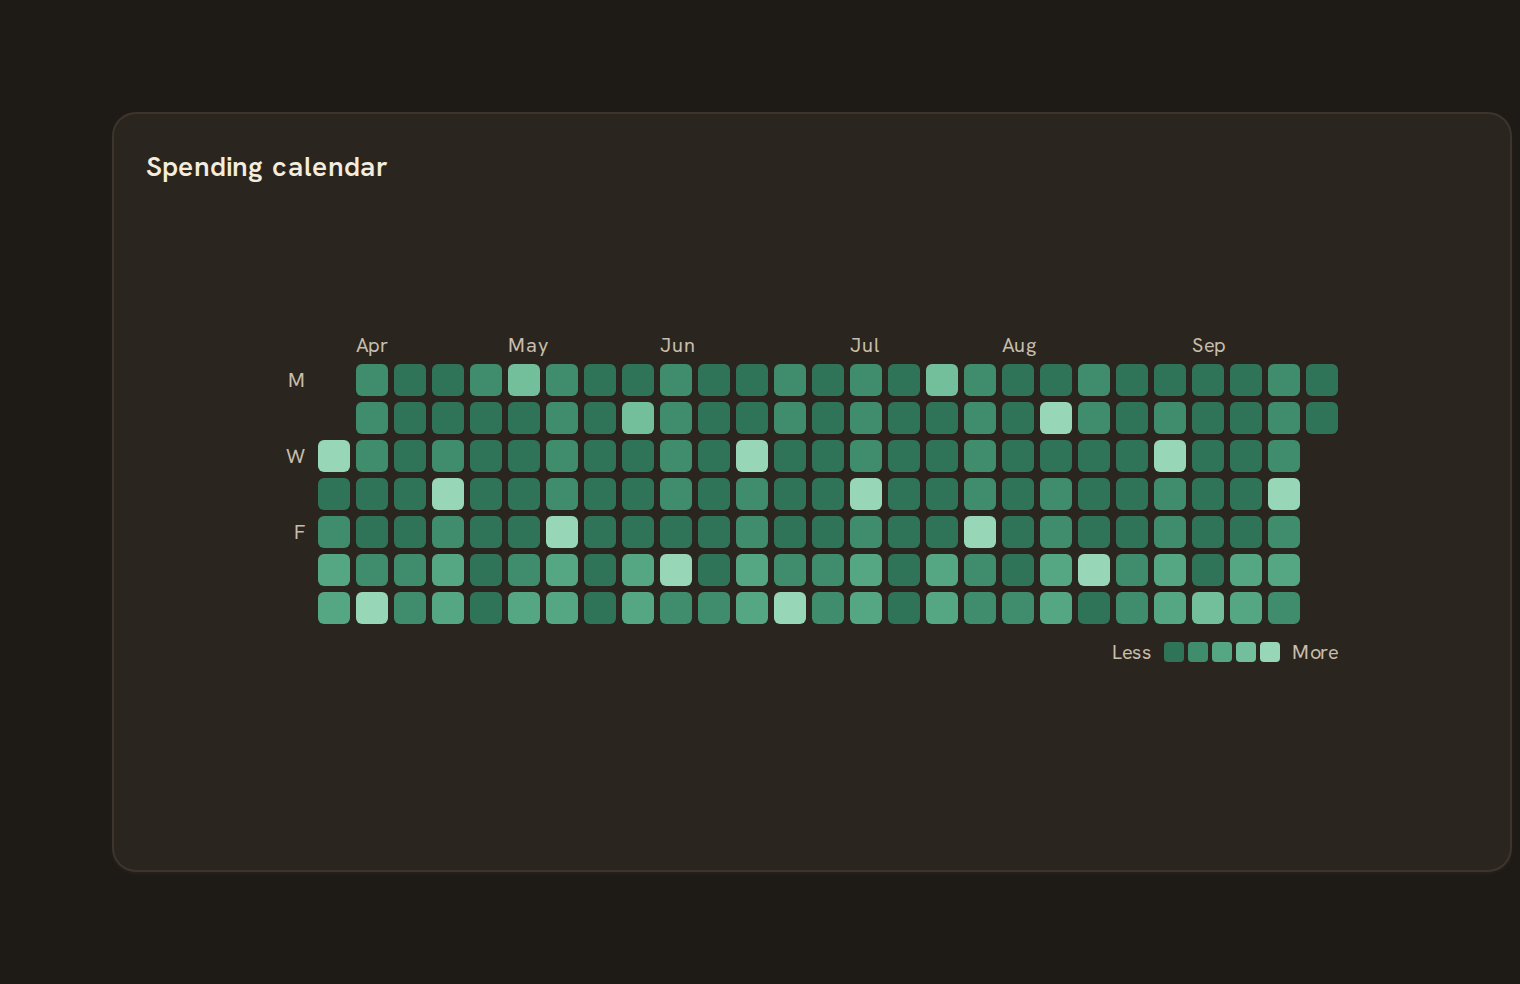 Calendar heatmapGitHub-style year grid
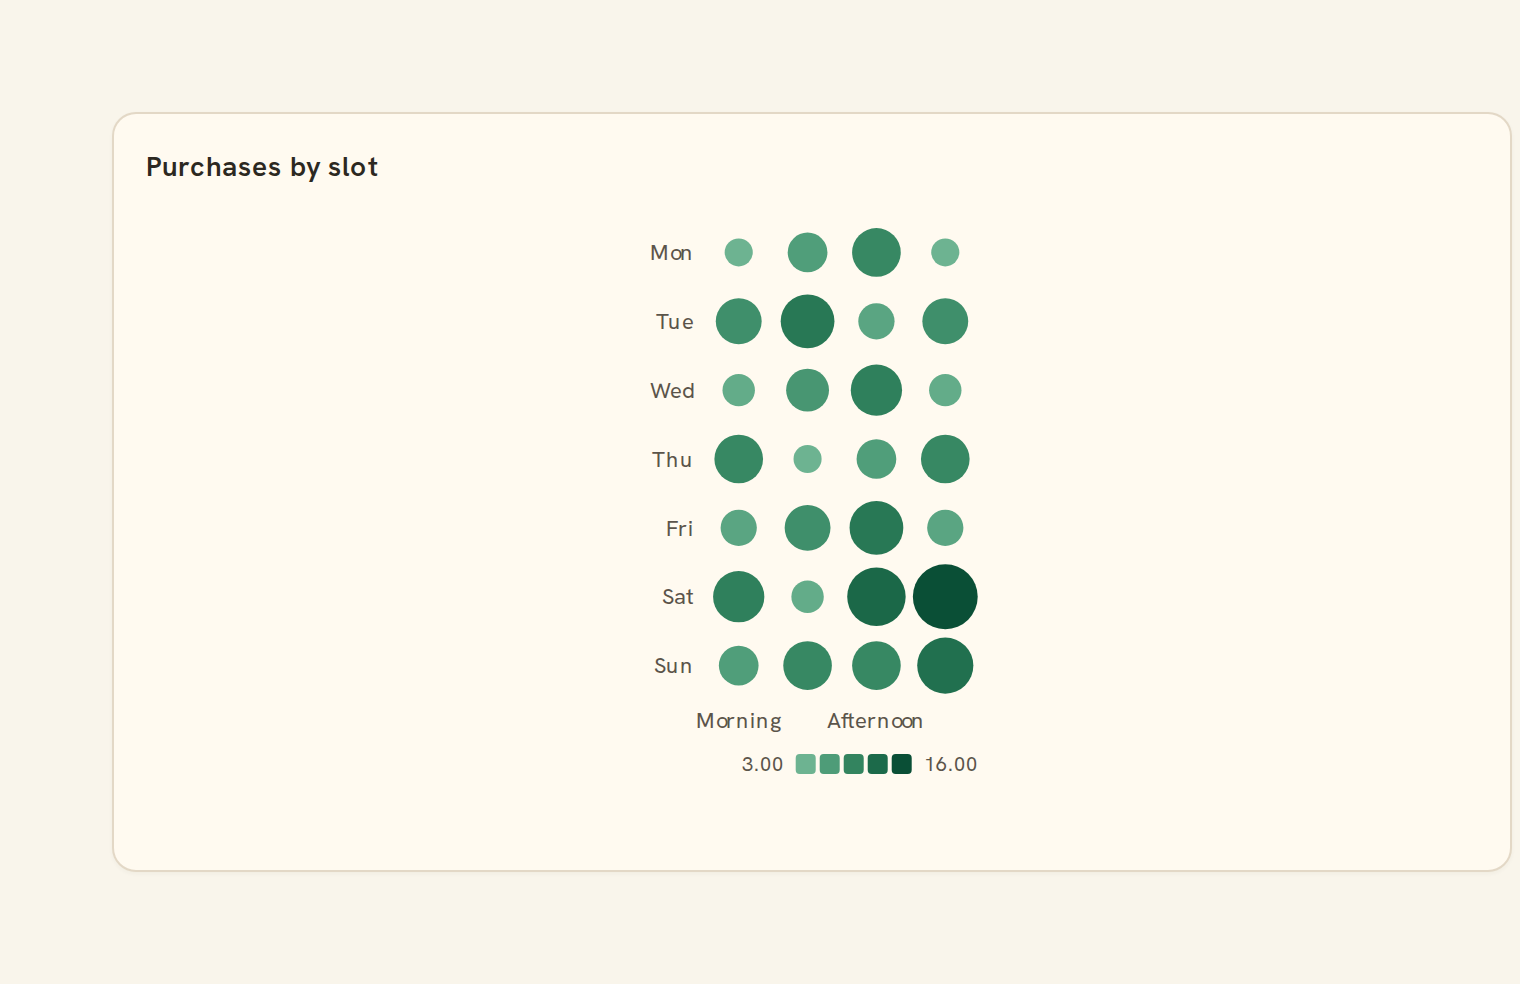
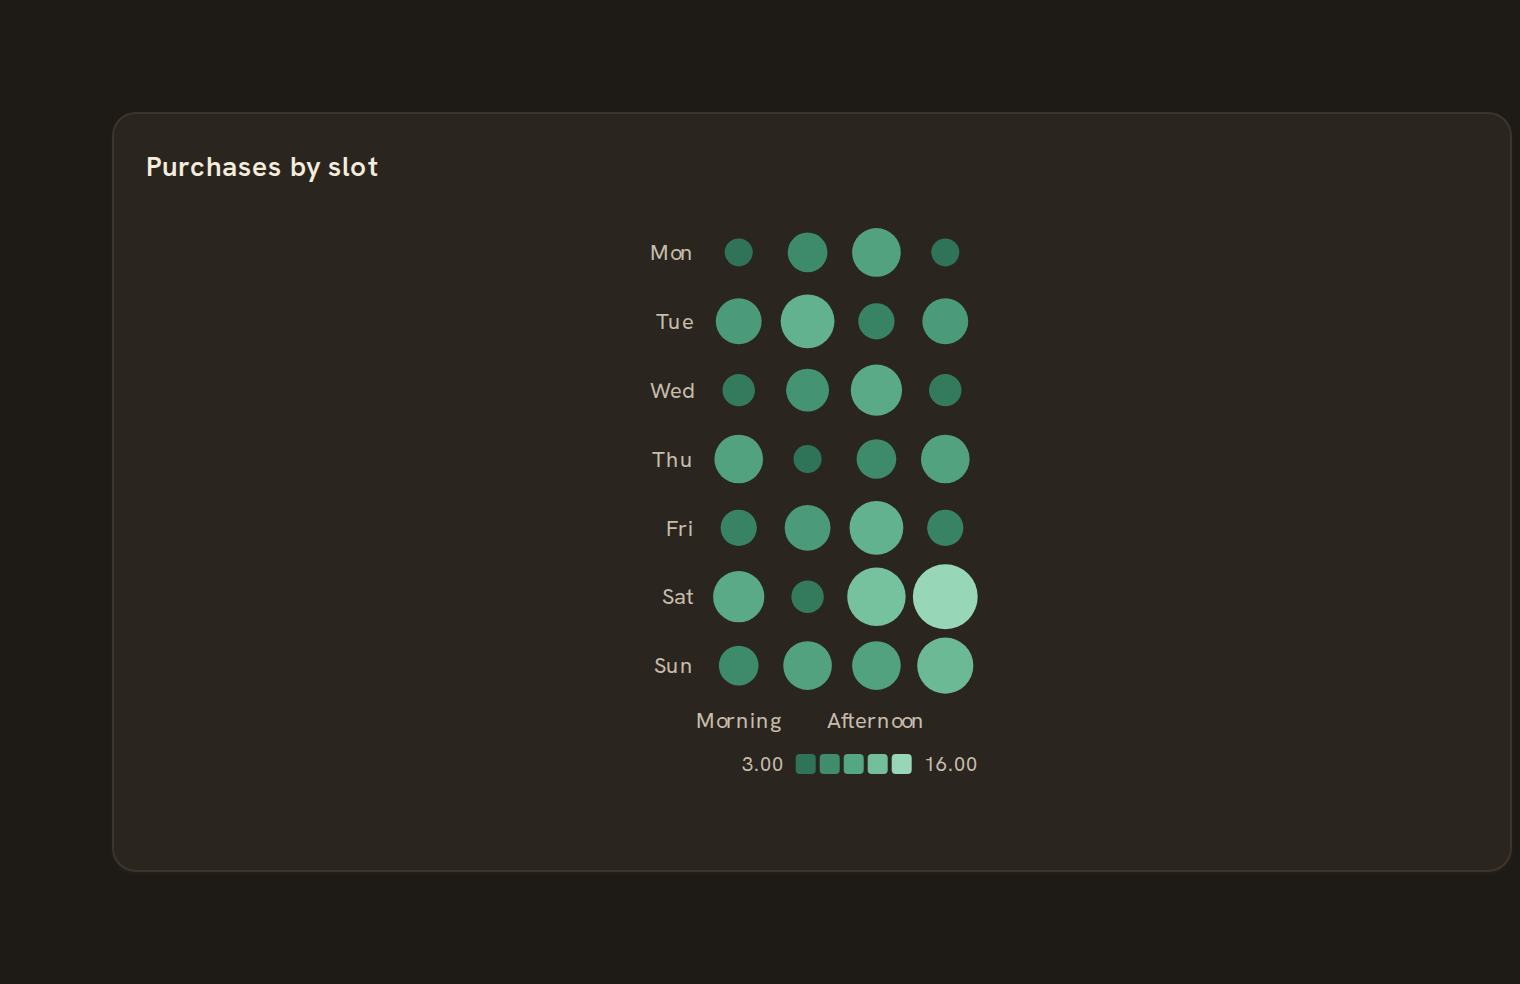 PunchcardDot intensity grid
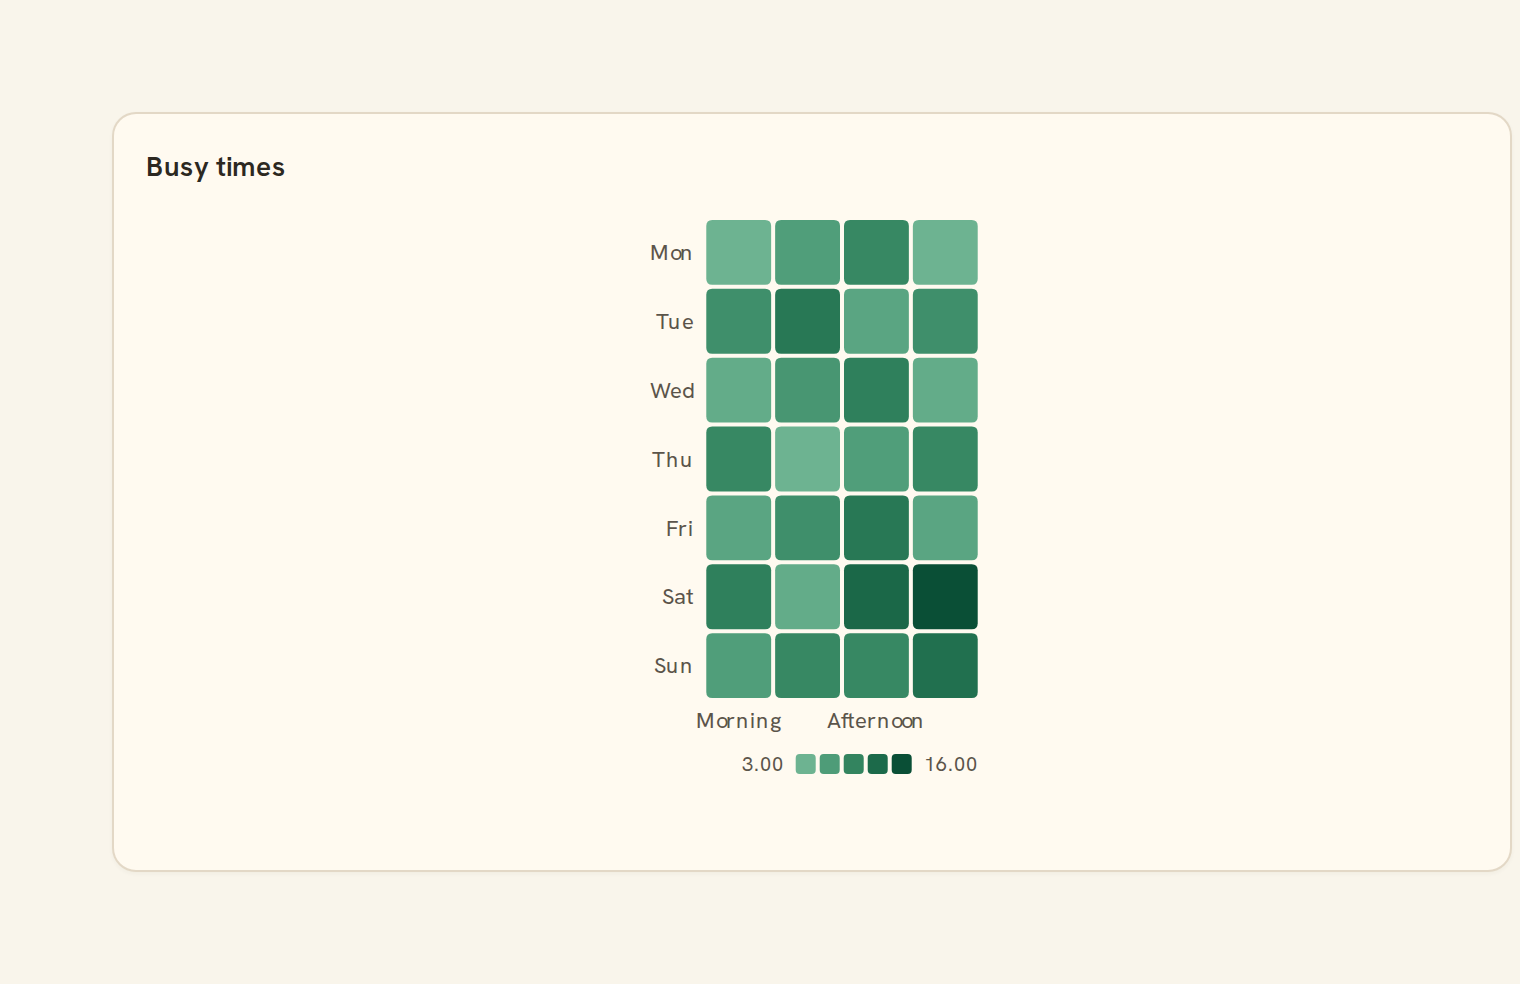
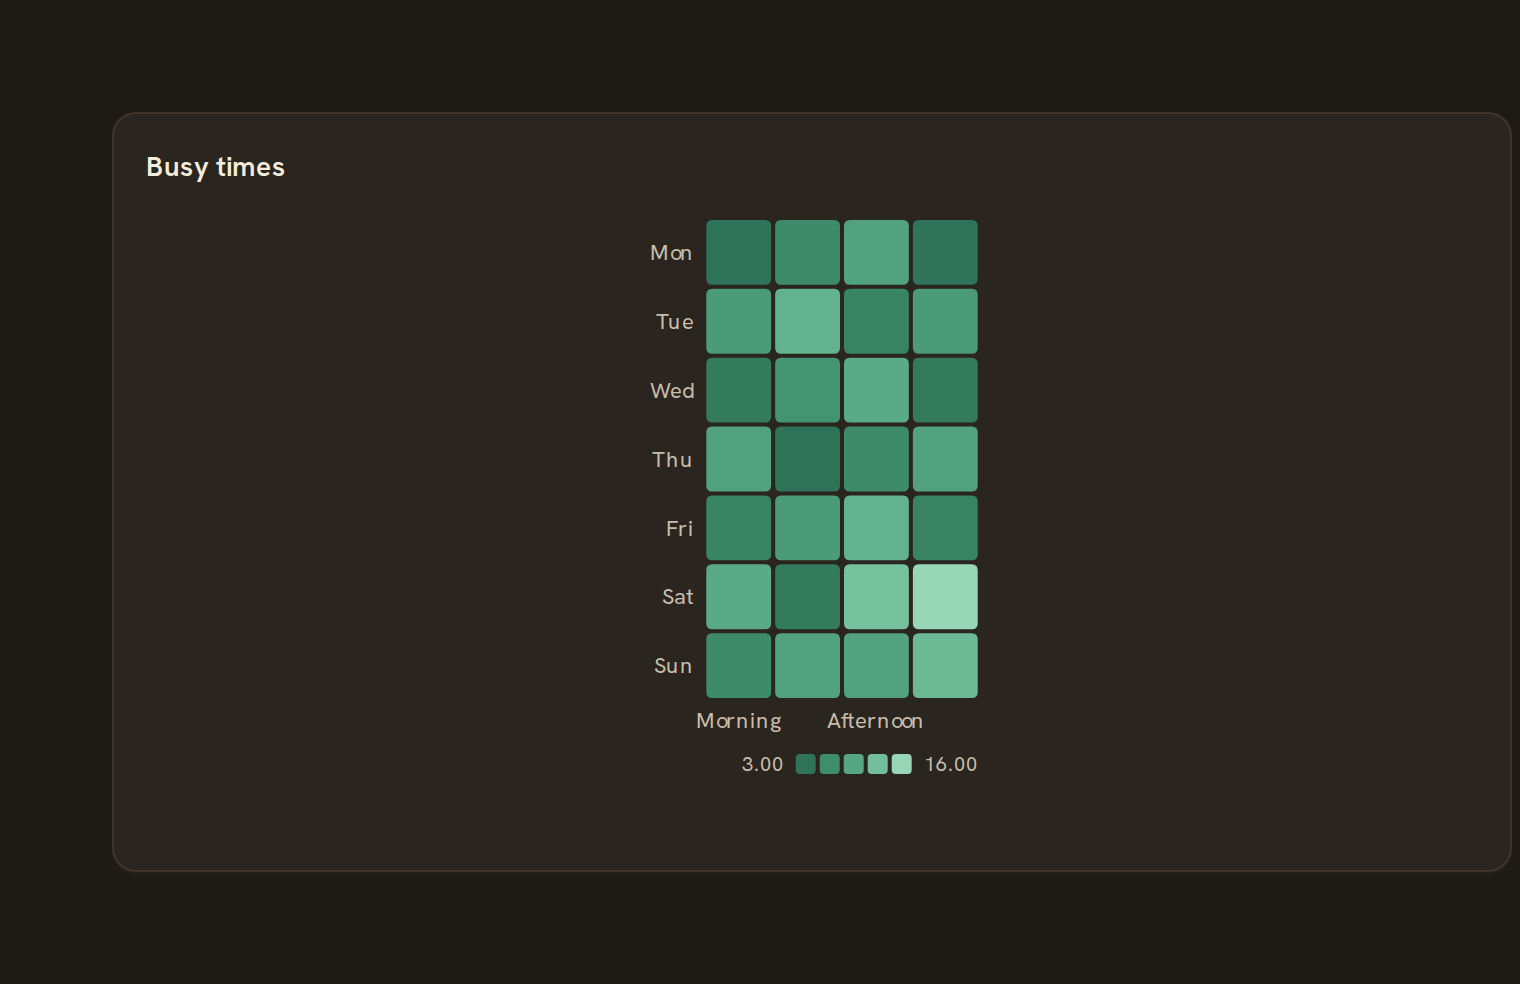 HeatmapColor-coded grid
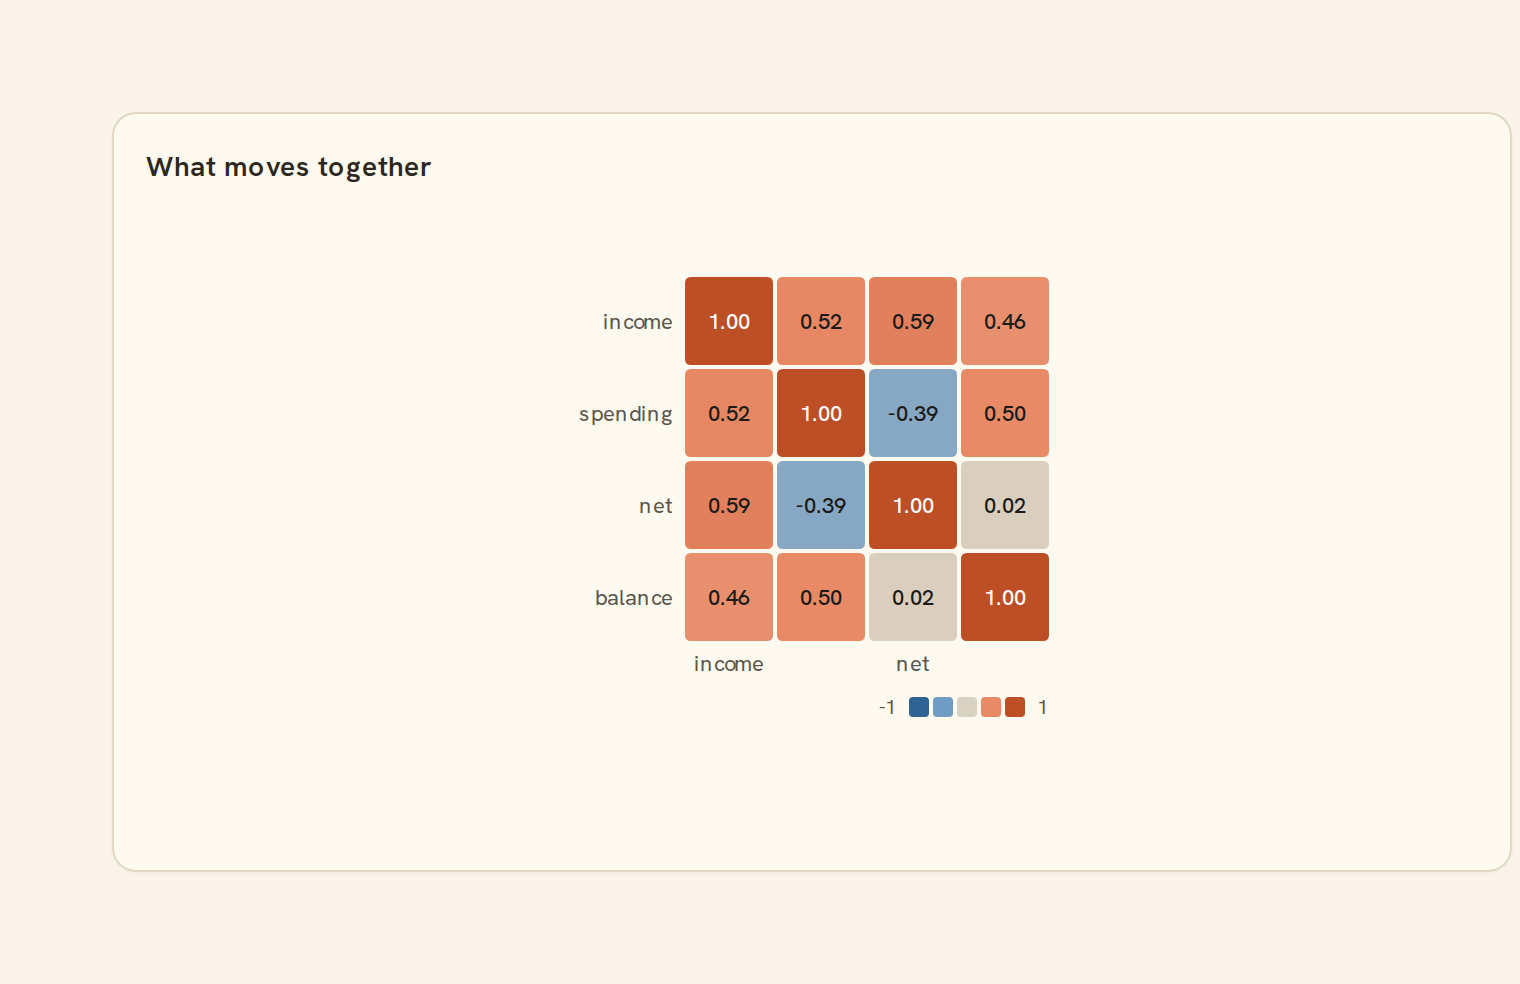
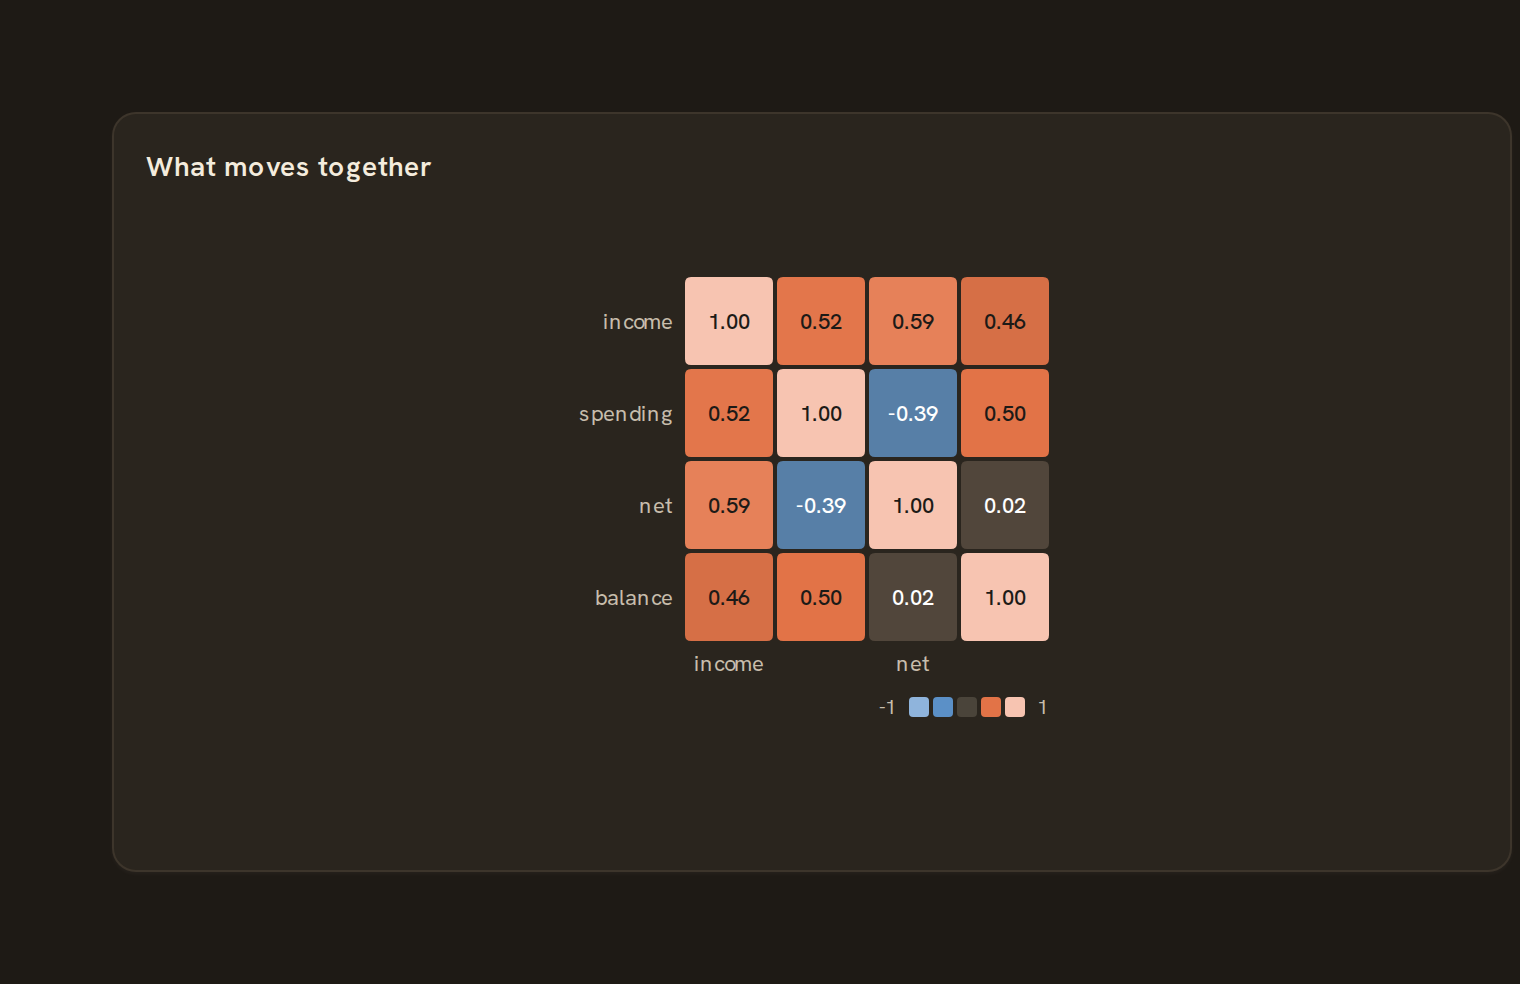 CorrelationField-by-field correlation
Single value#
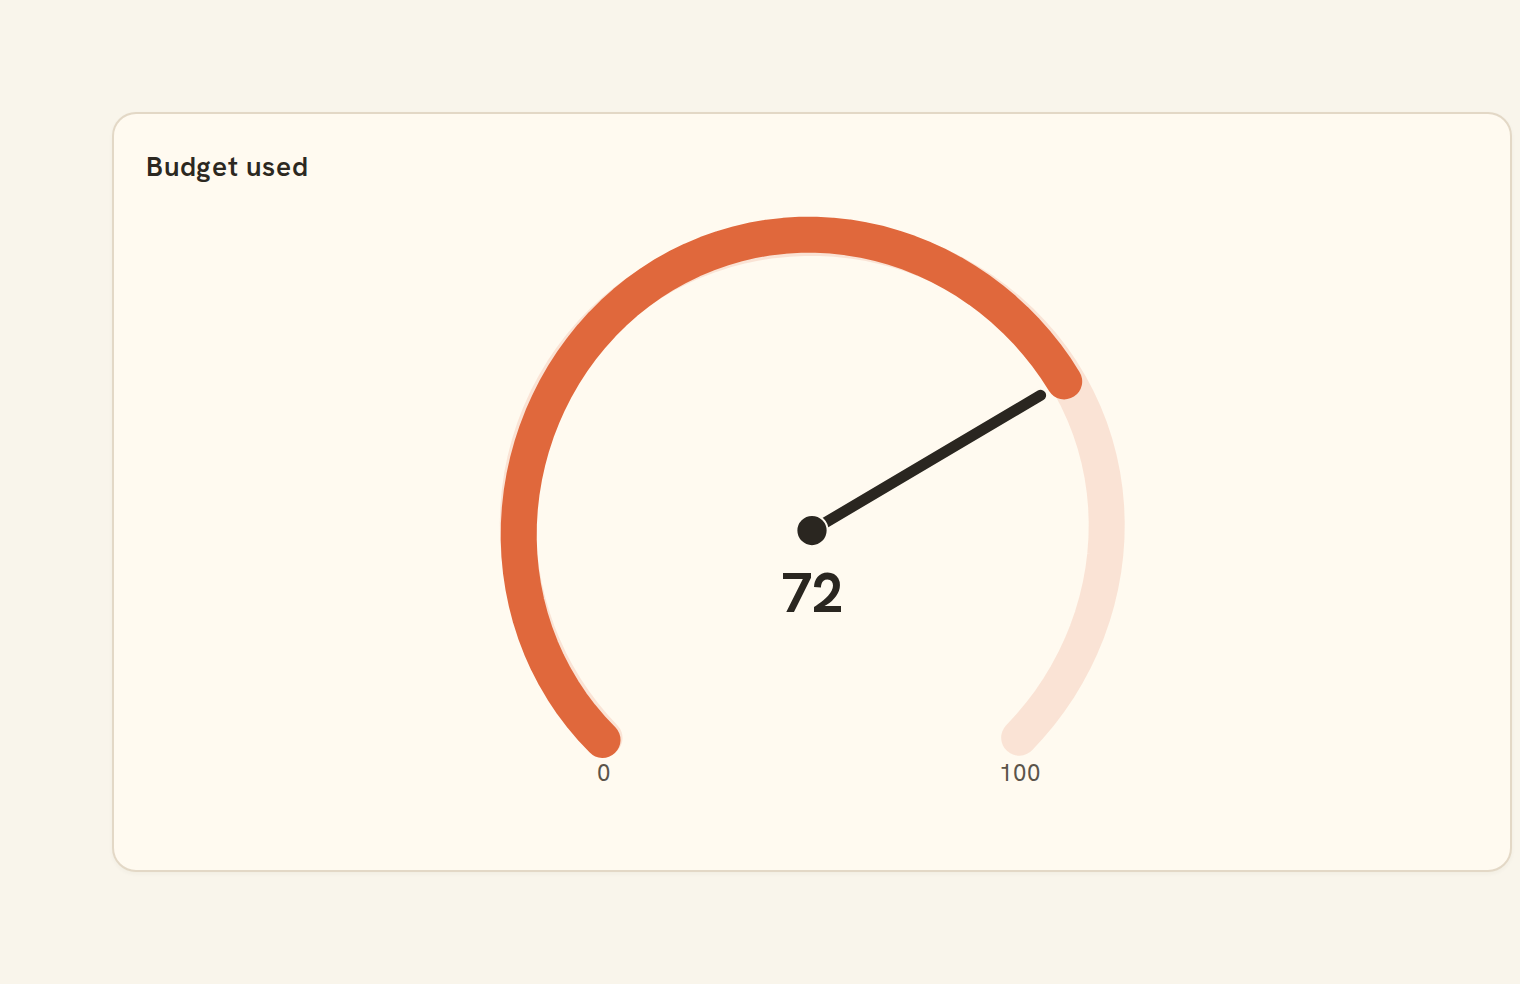
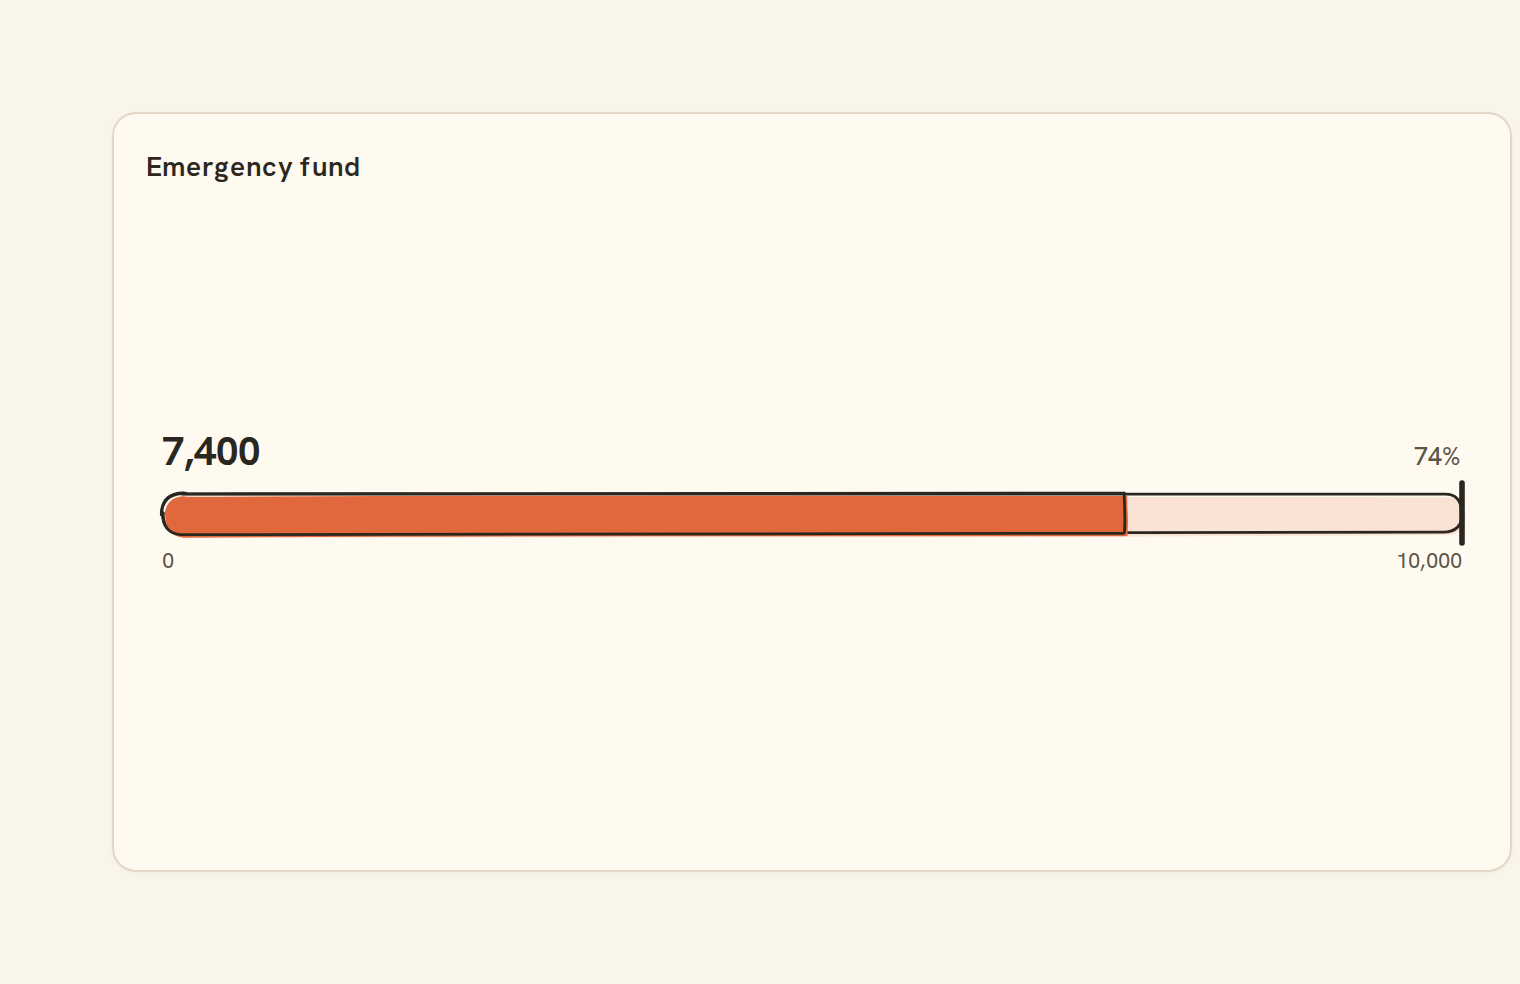
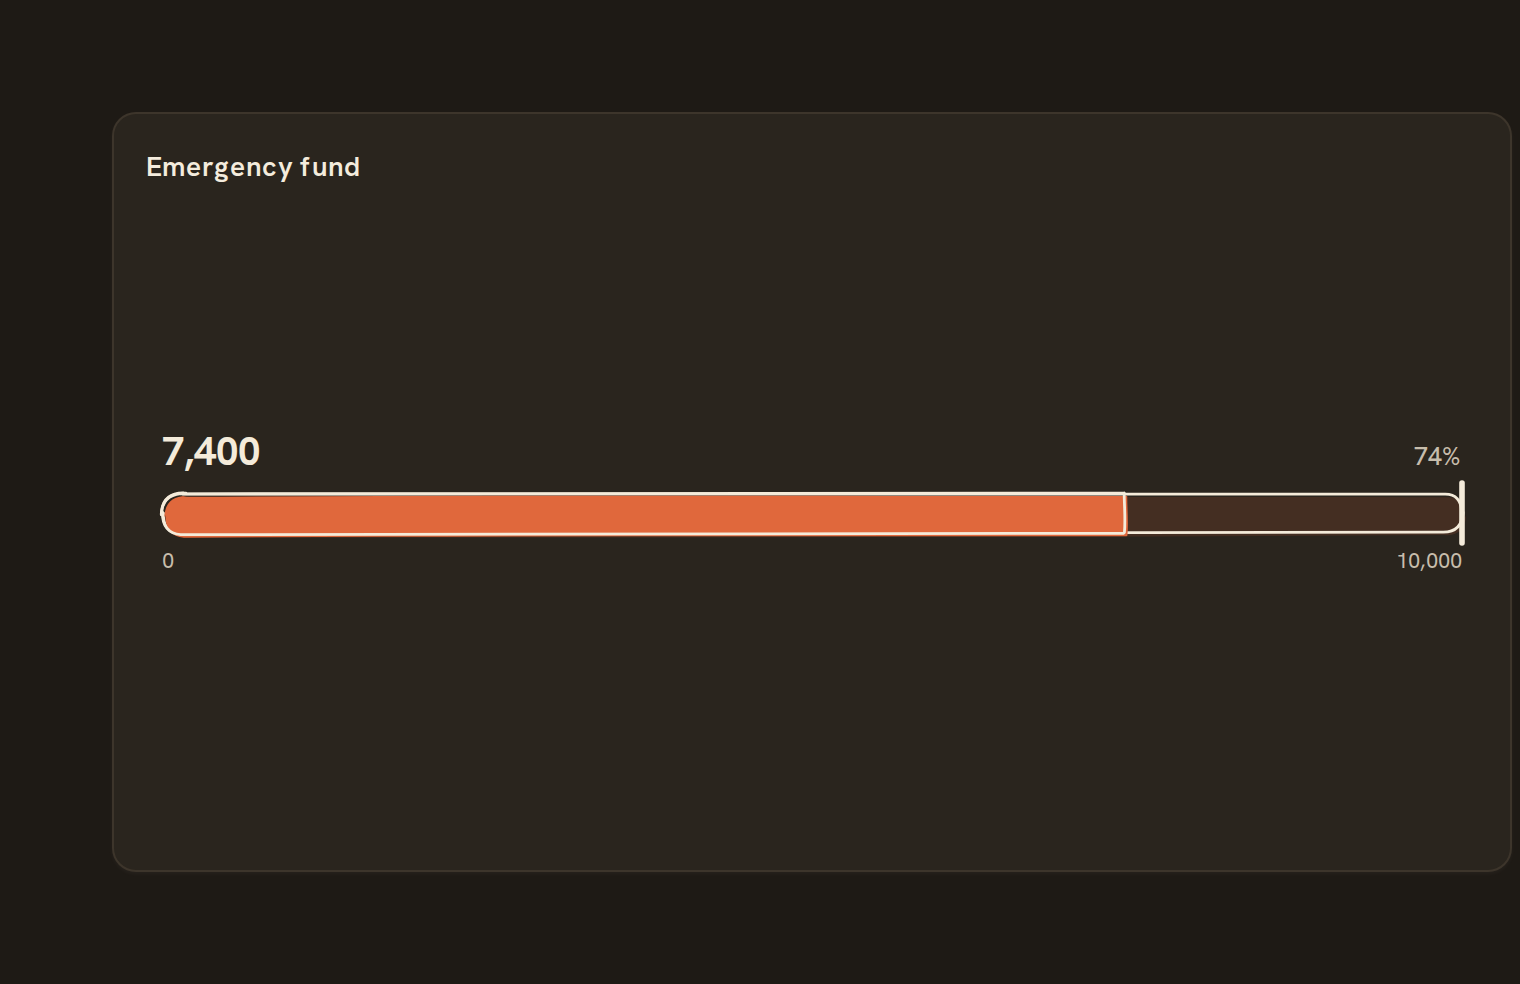
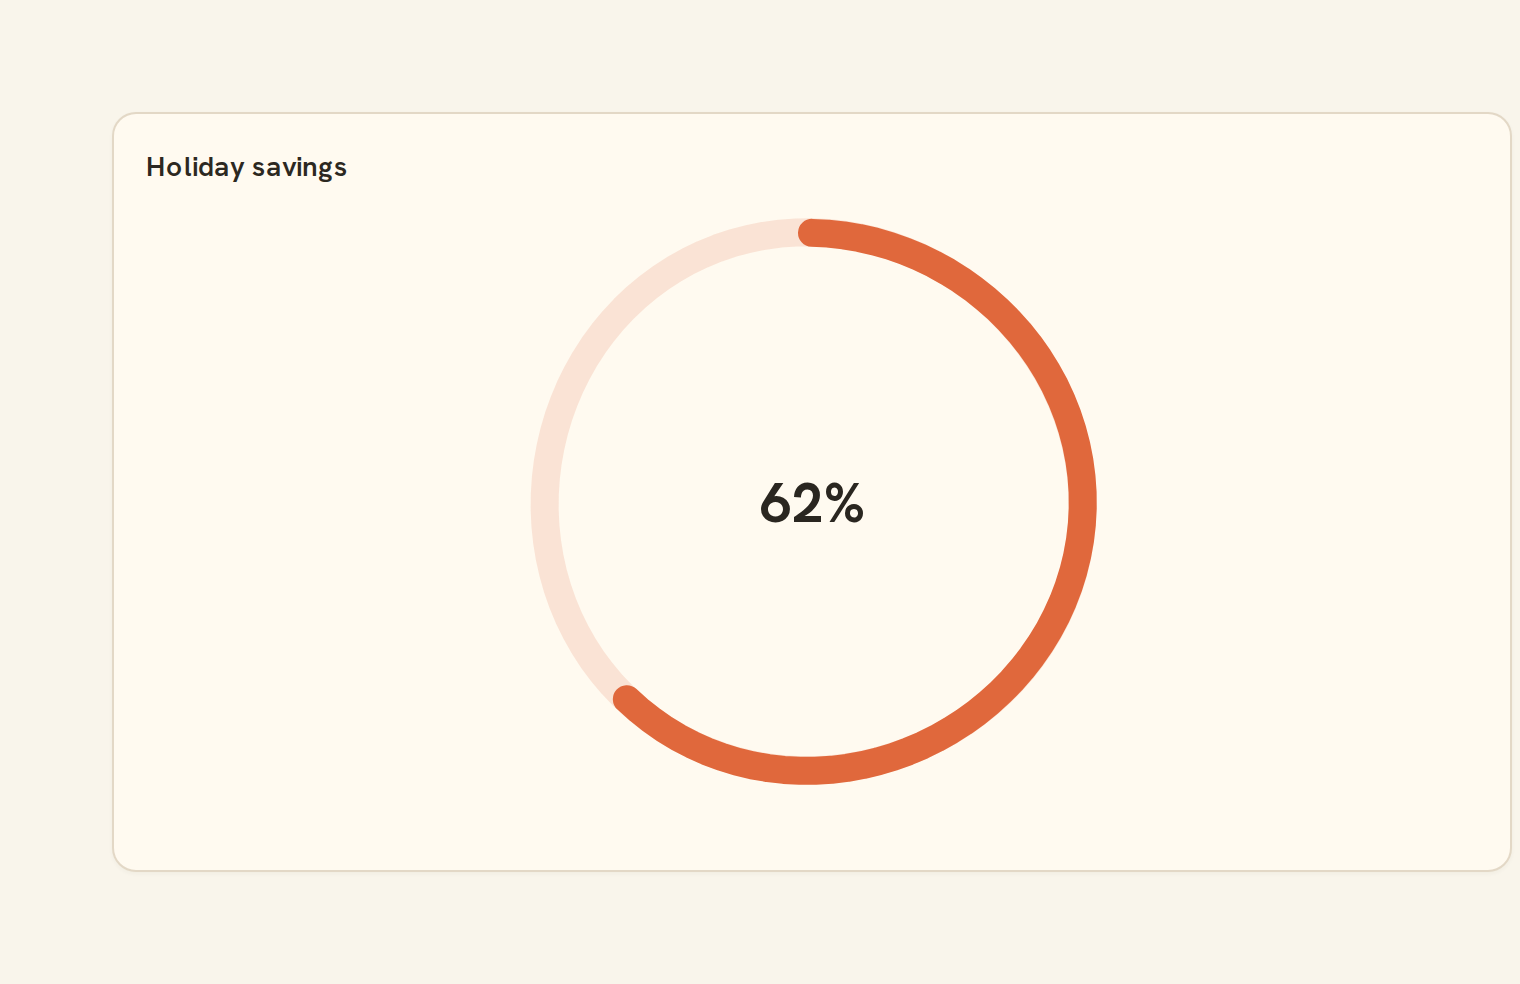
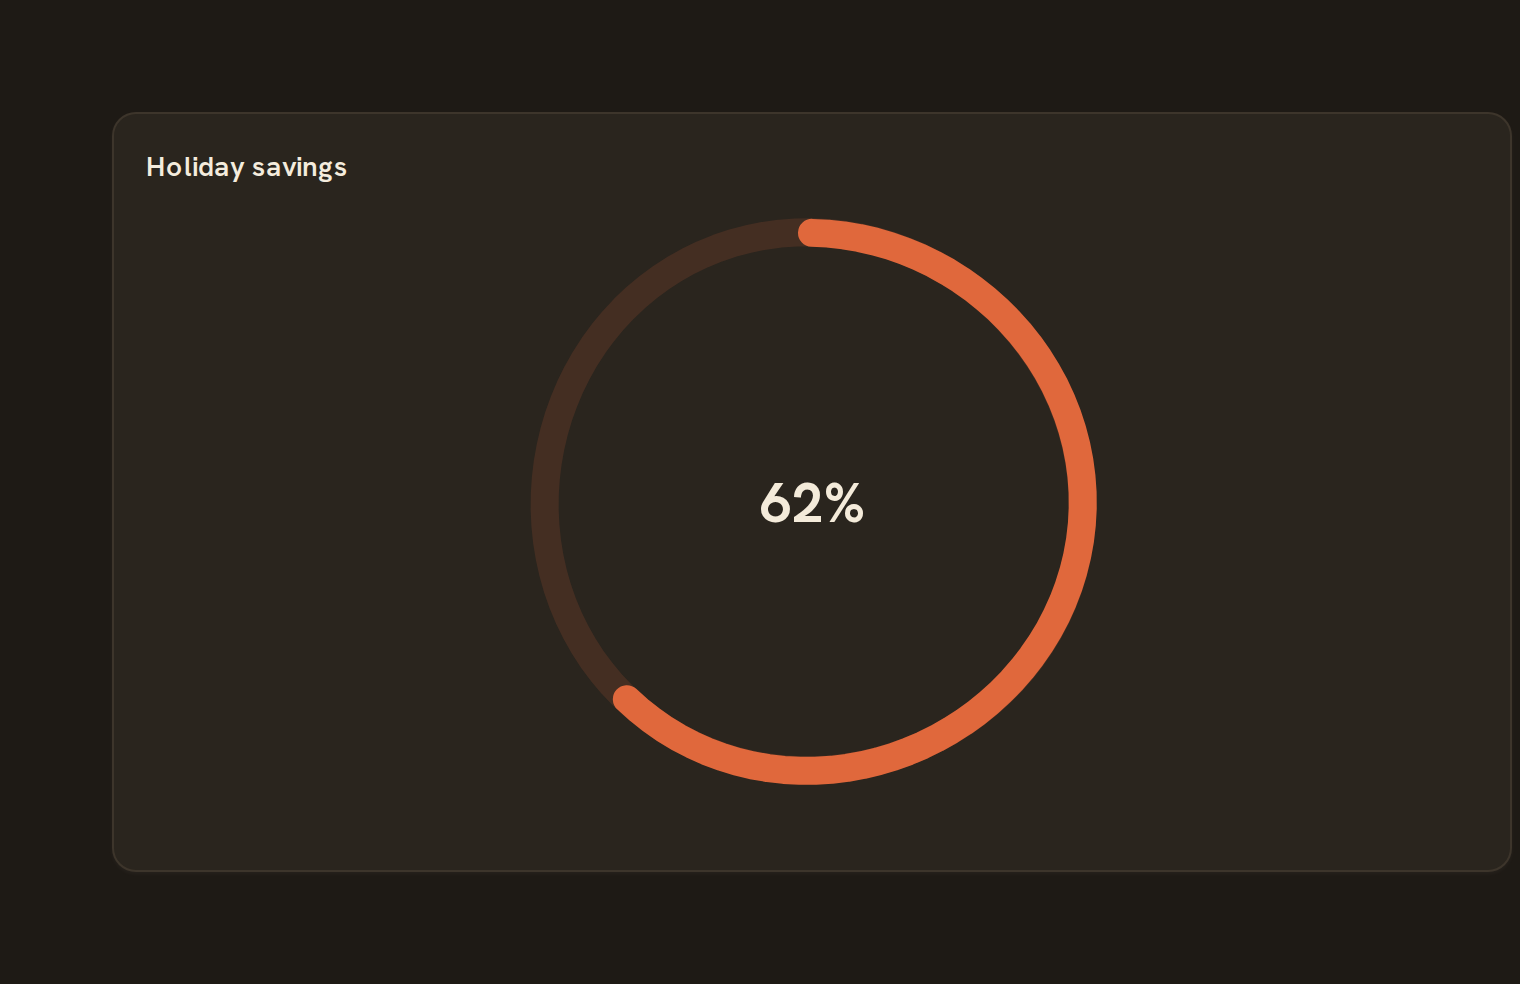
Flow & network#
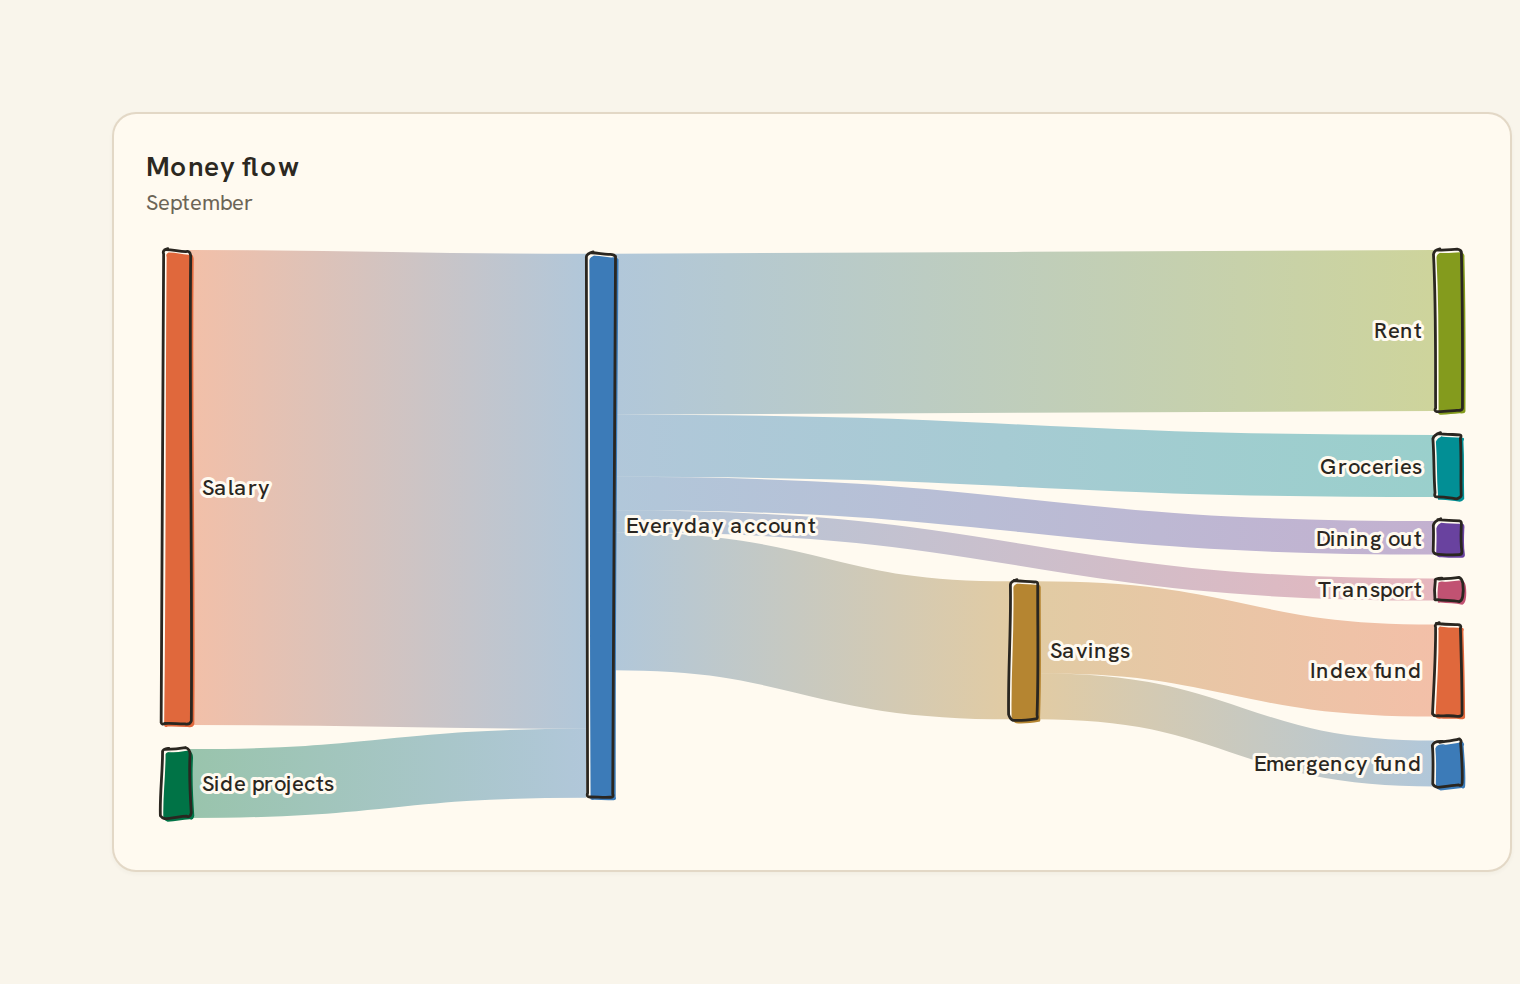
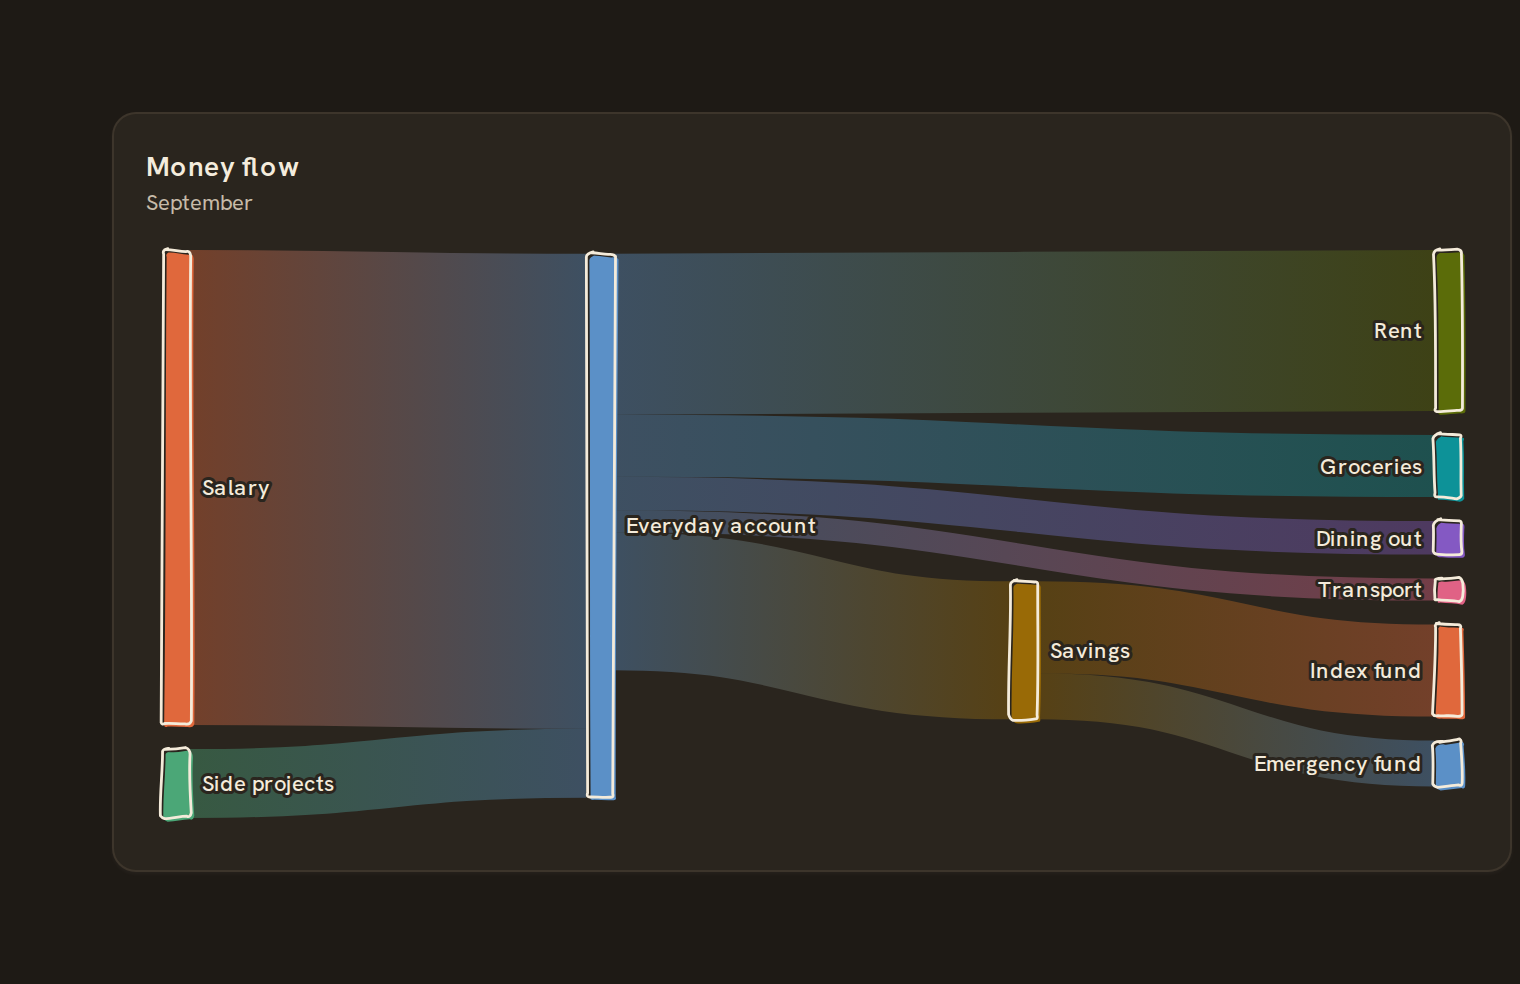 SankeyFlows between nodes
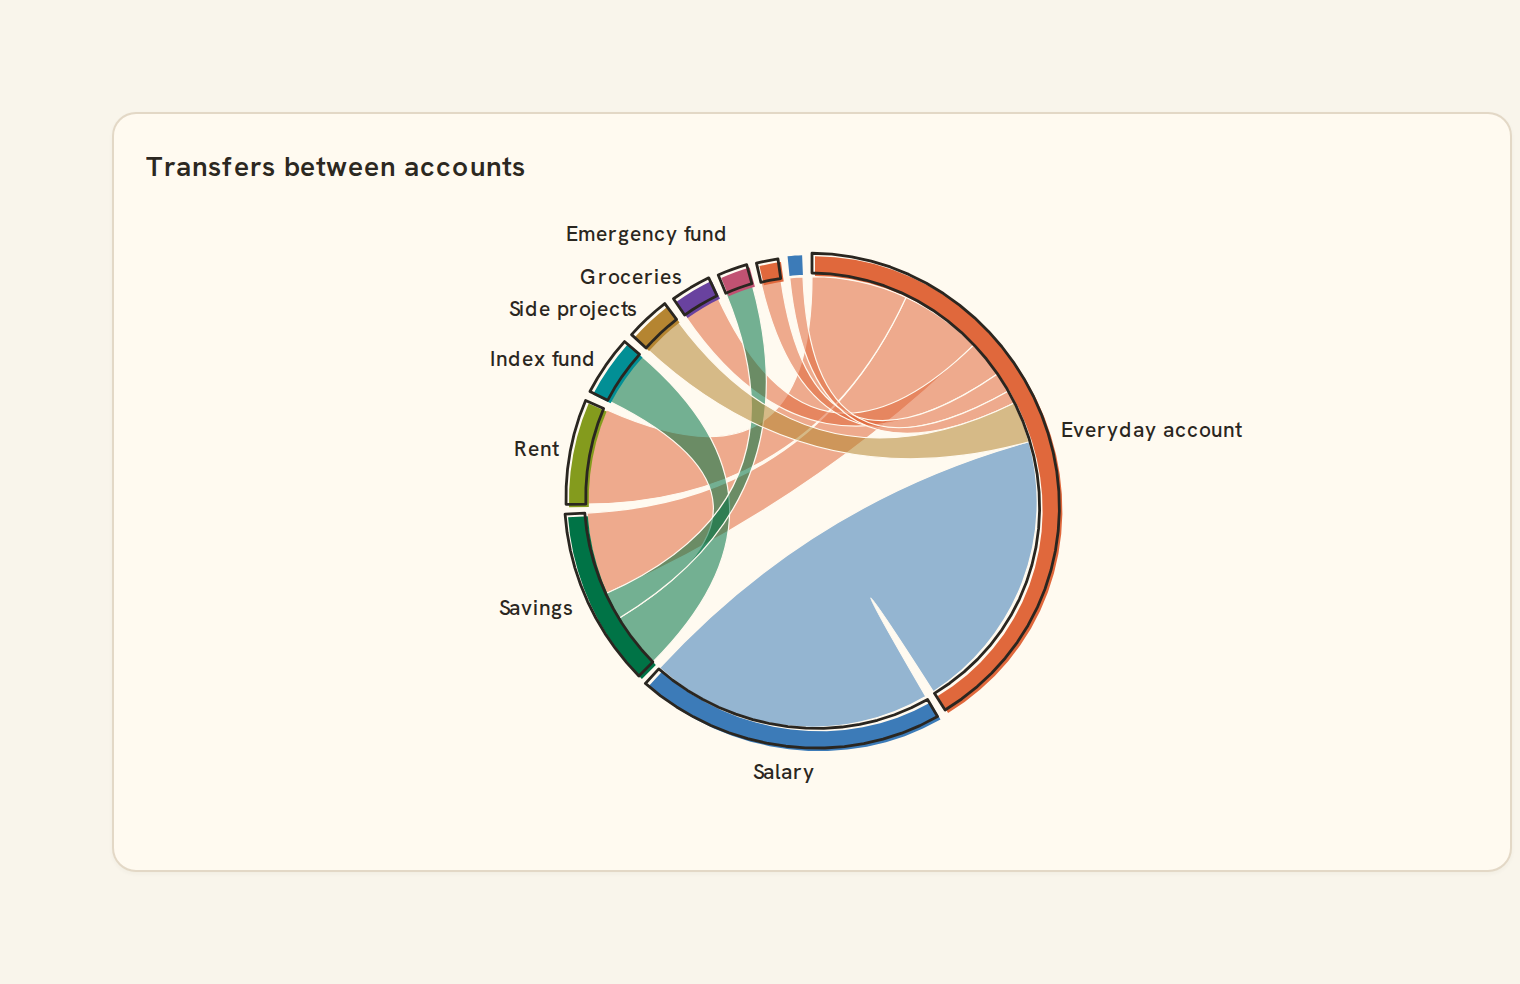
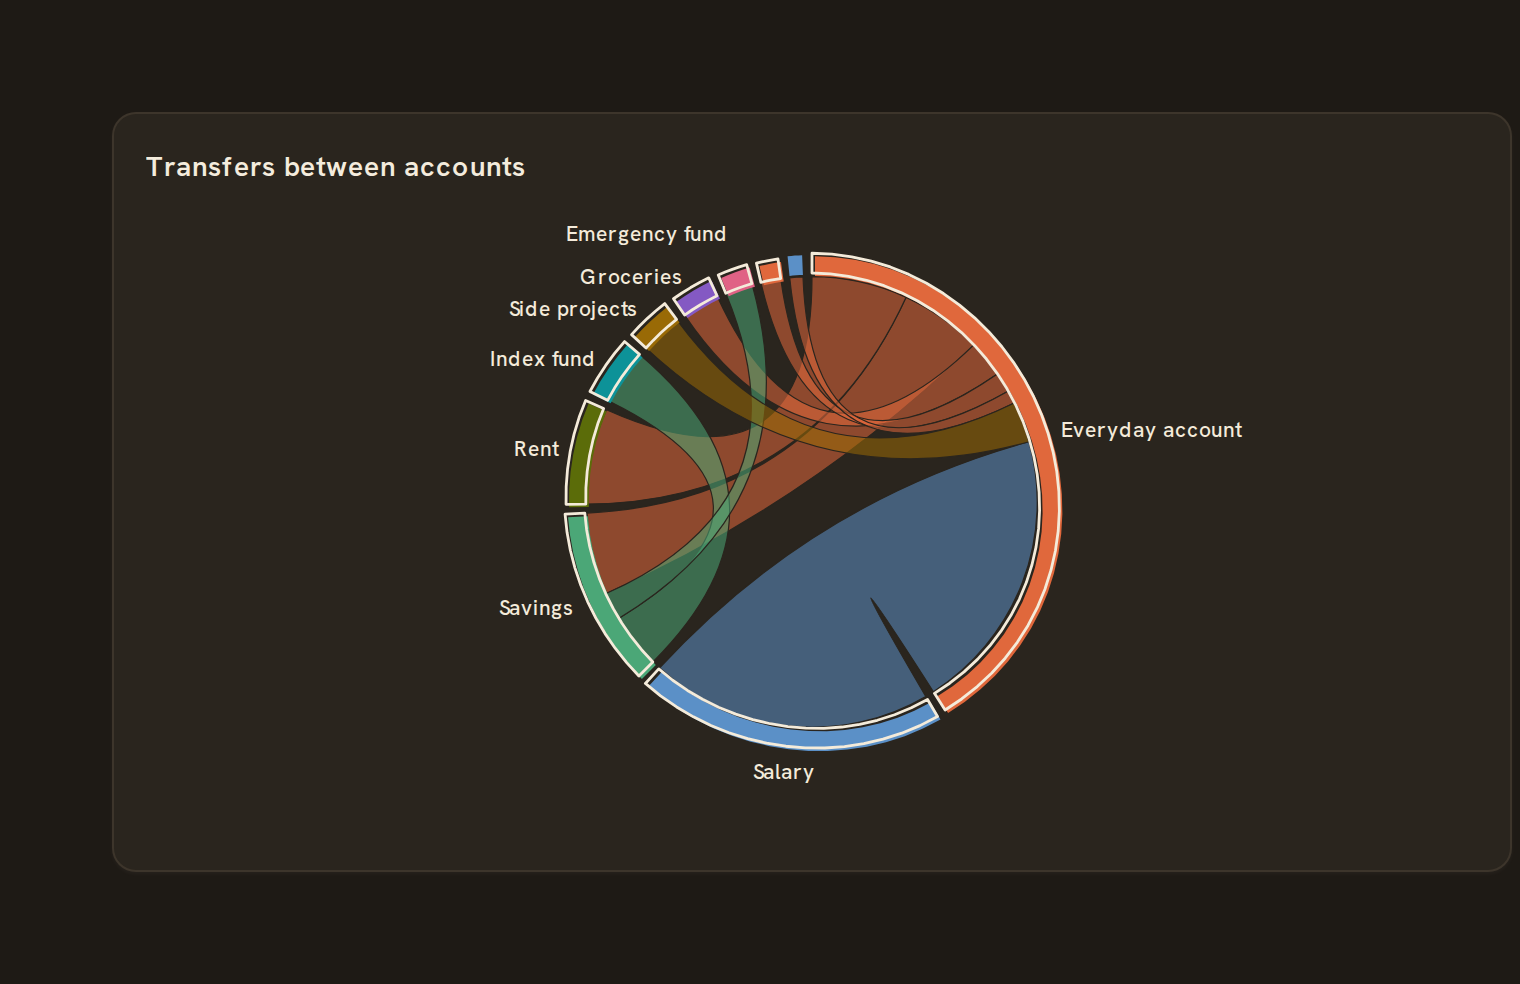 Chord diagramCross-category links
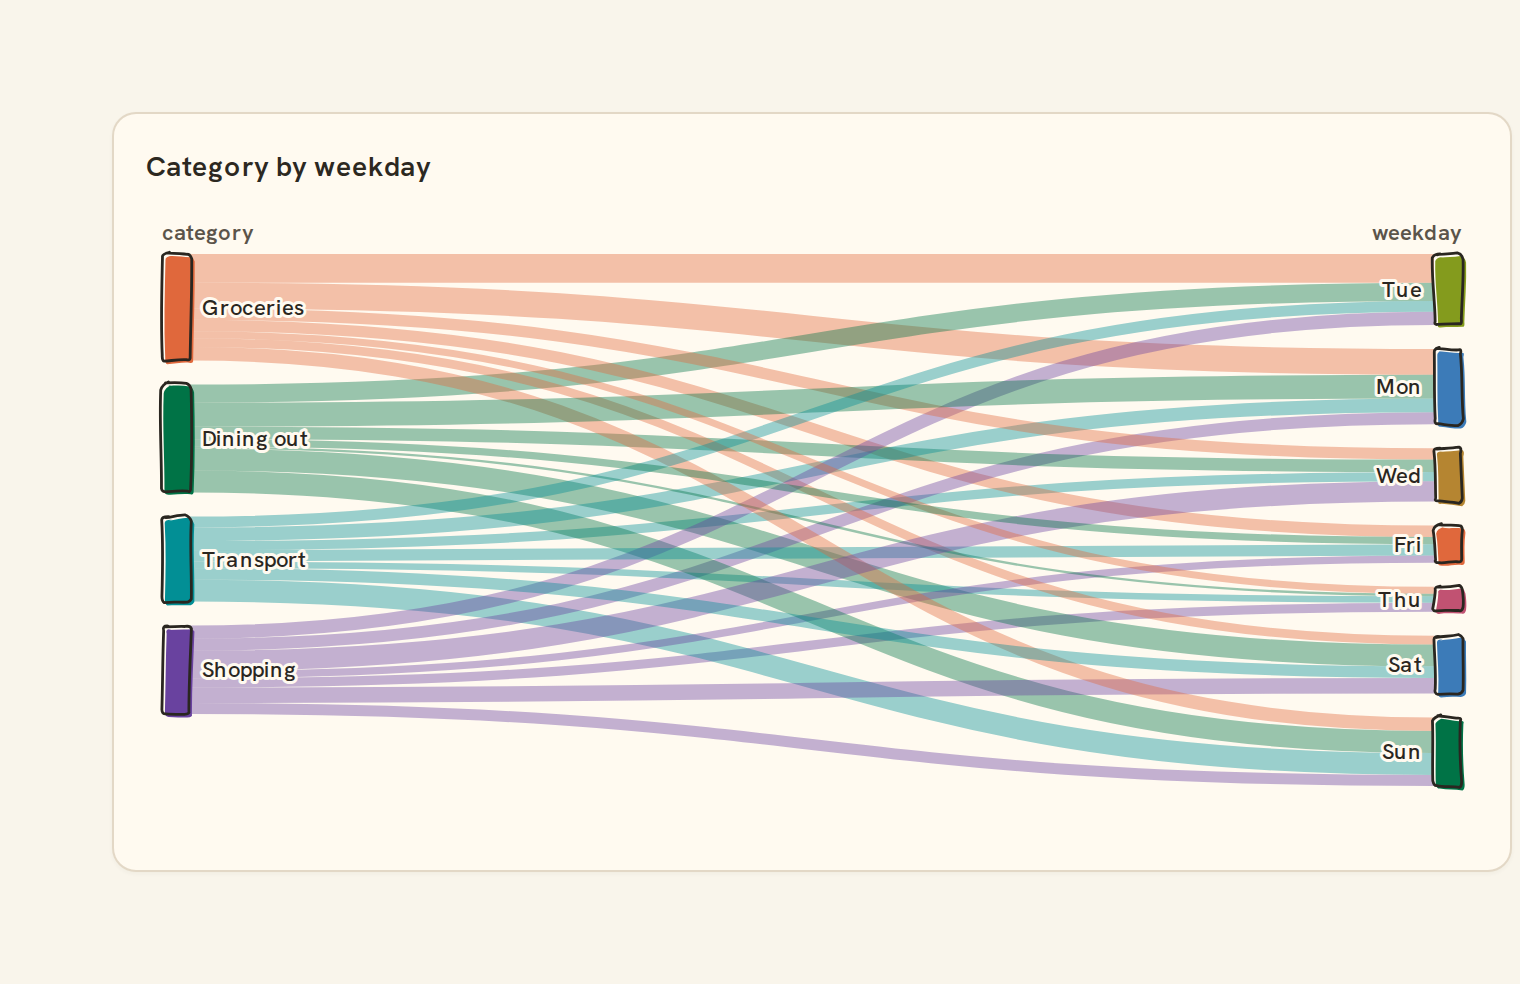
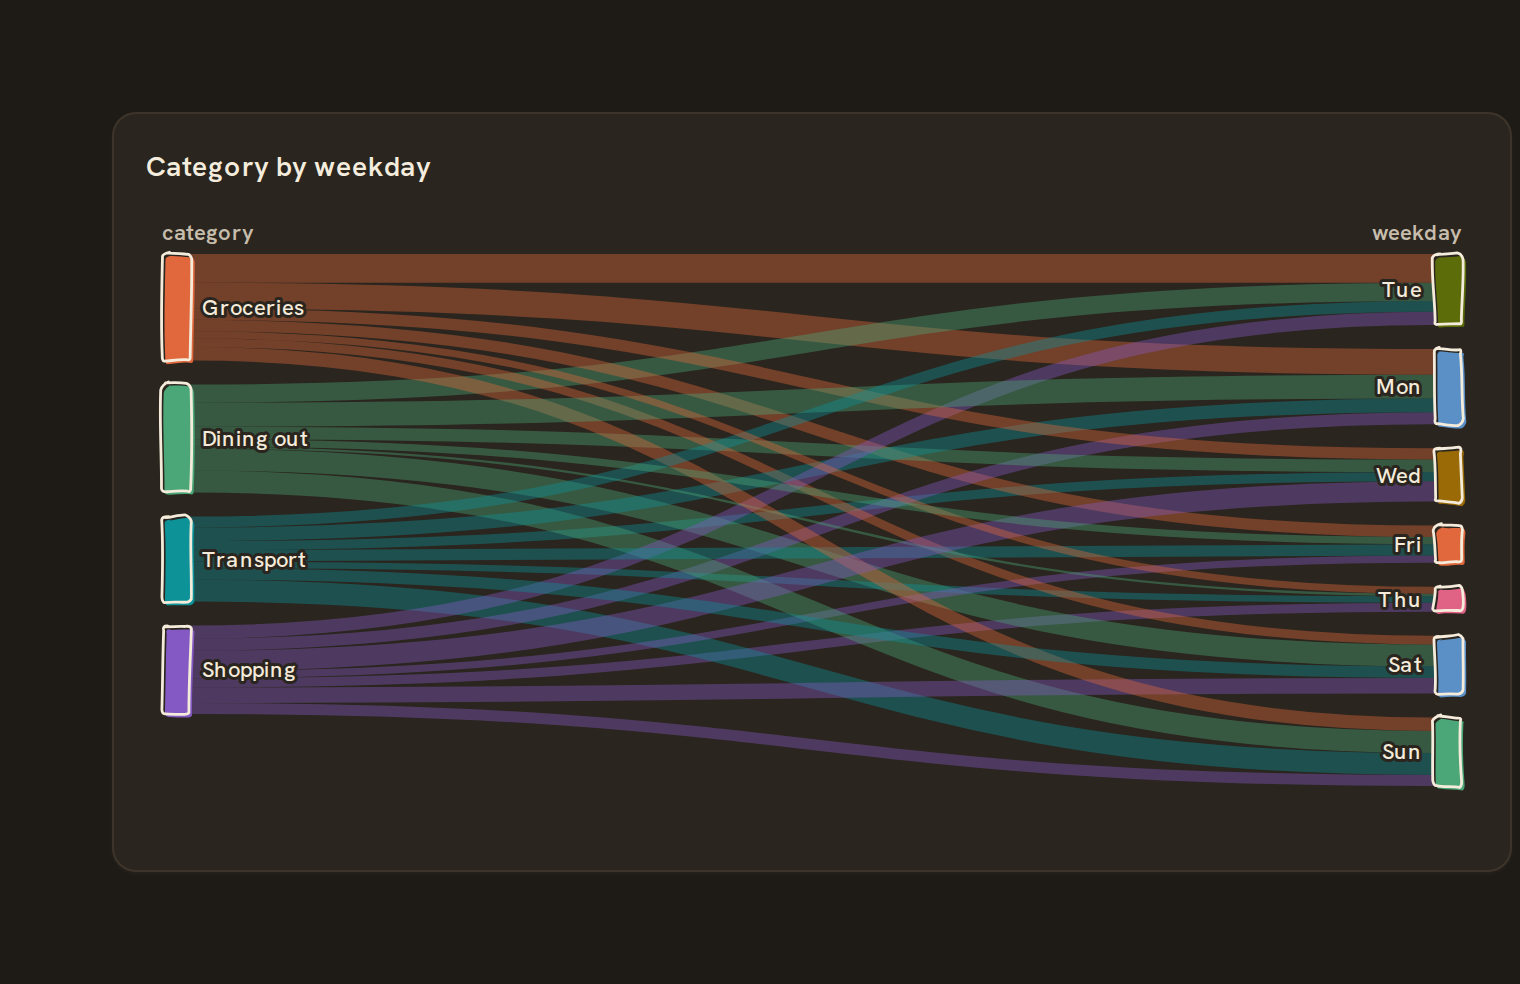 AlluvialMulti-stage flow
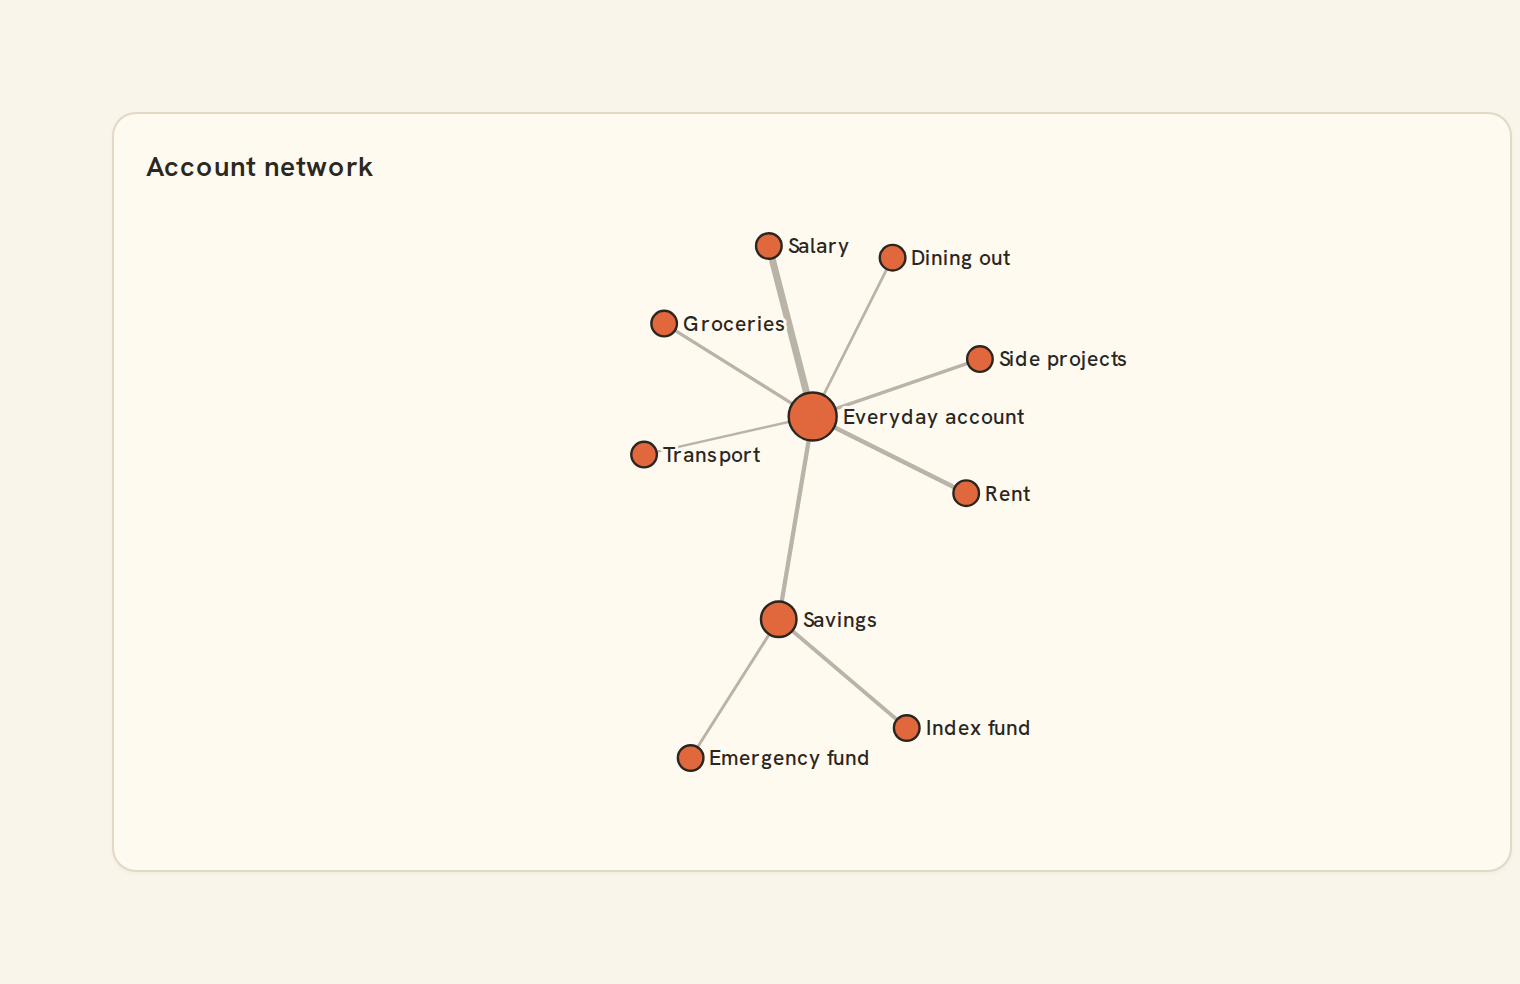
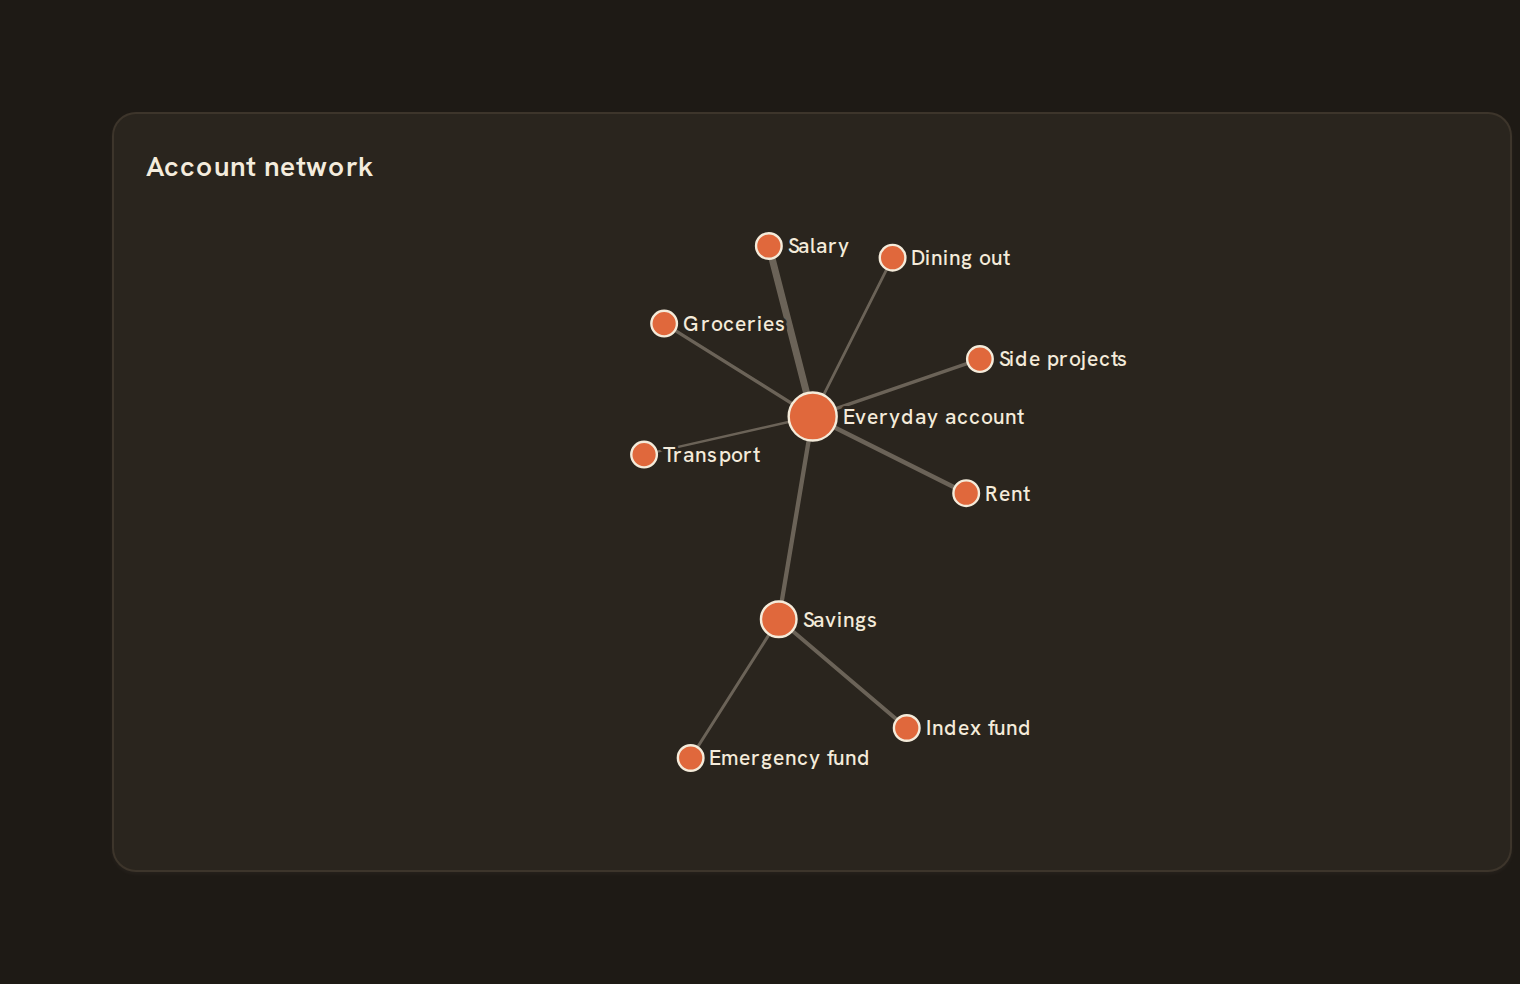 Network graphForce-directed nodes + edges
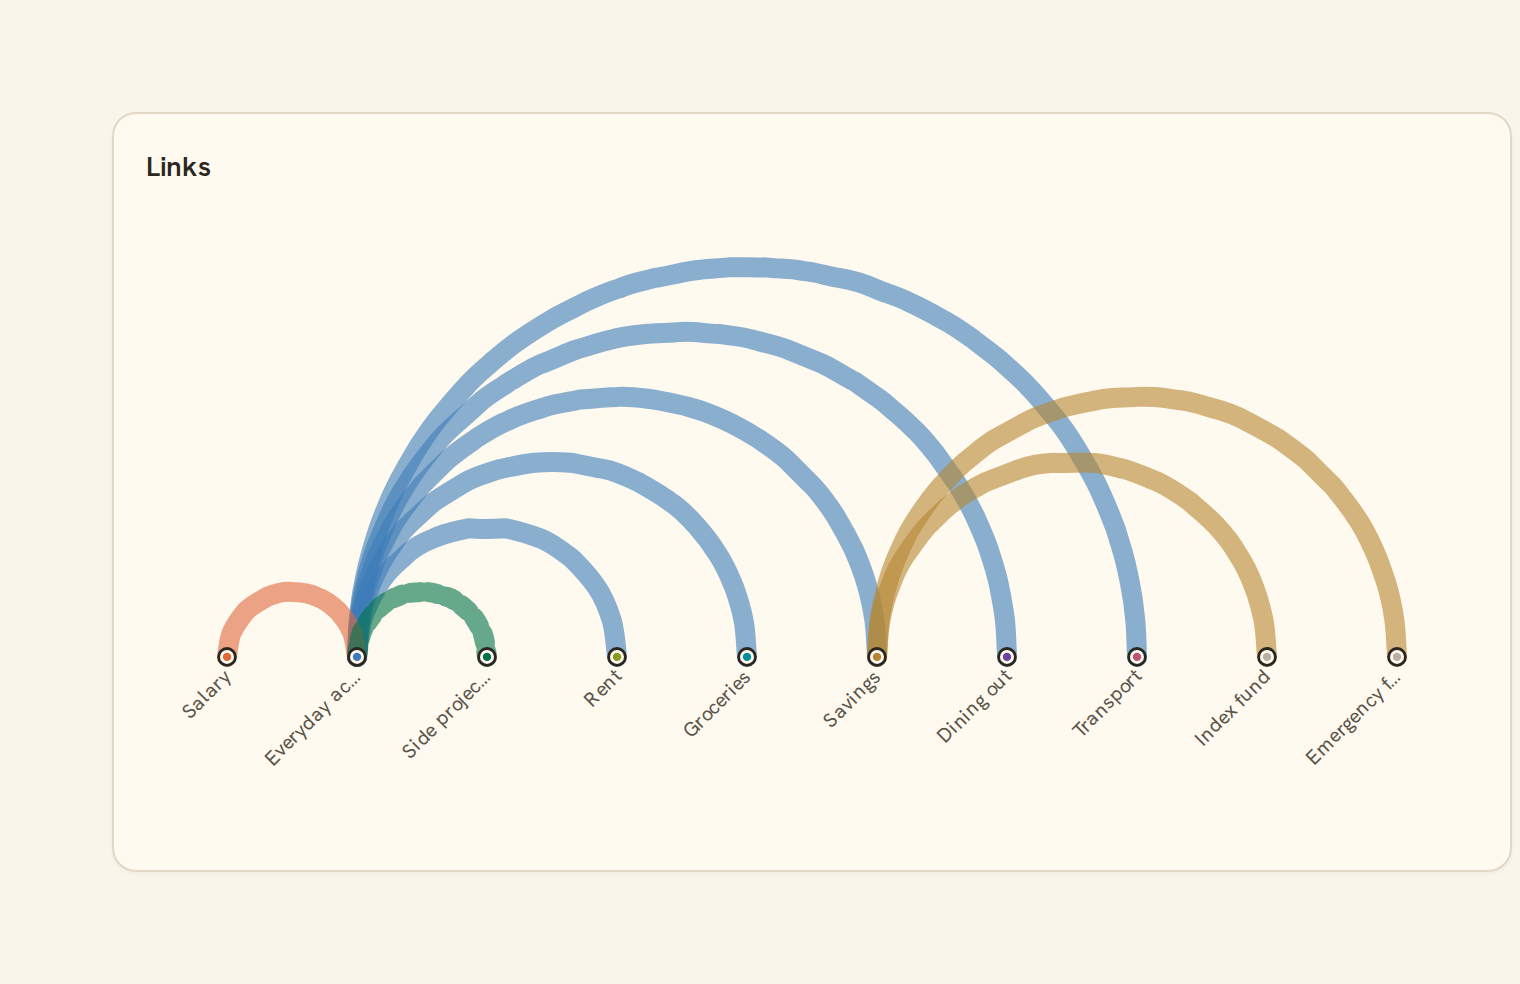
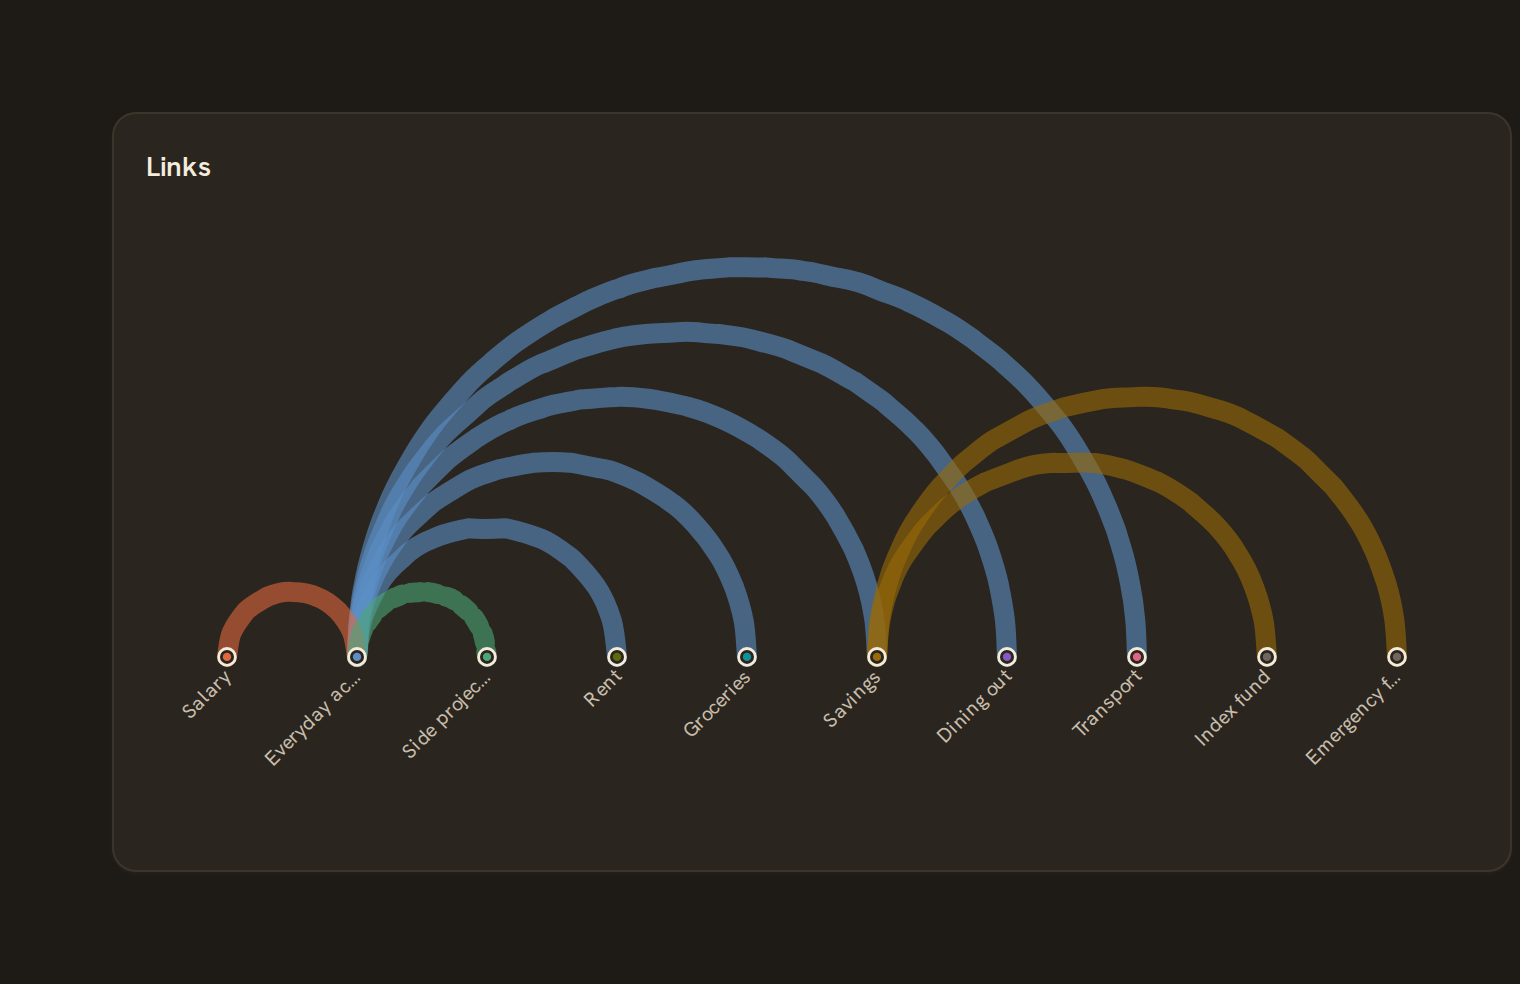 Arc diagramLinear node arcs
Financial#
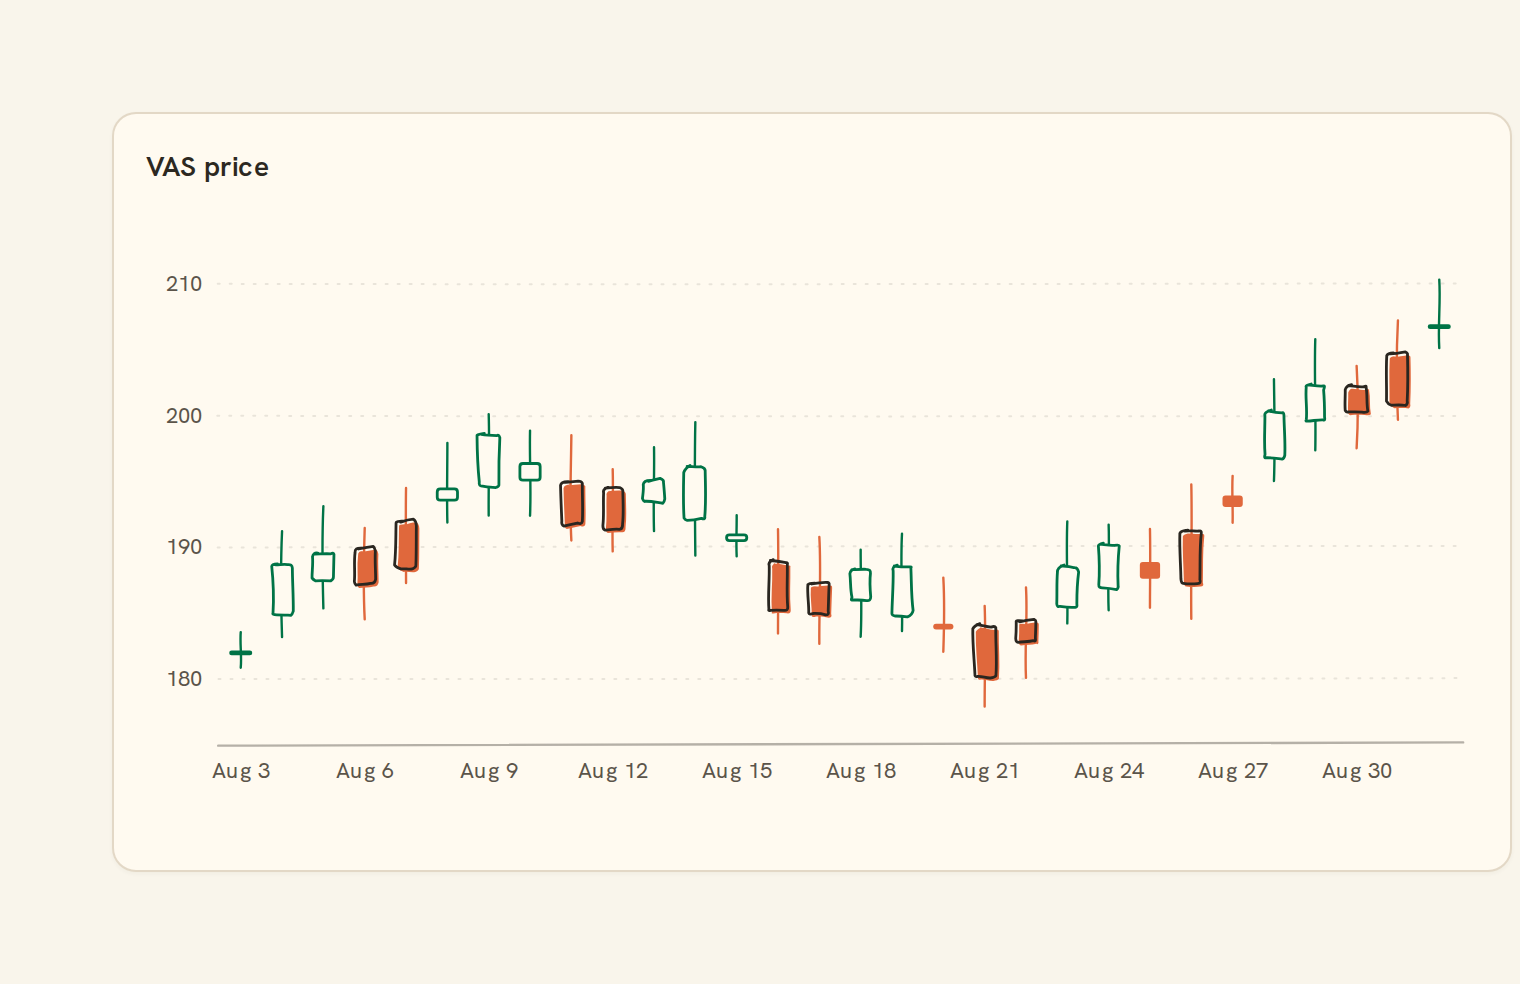
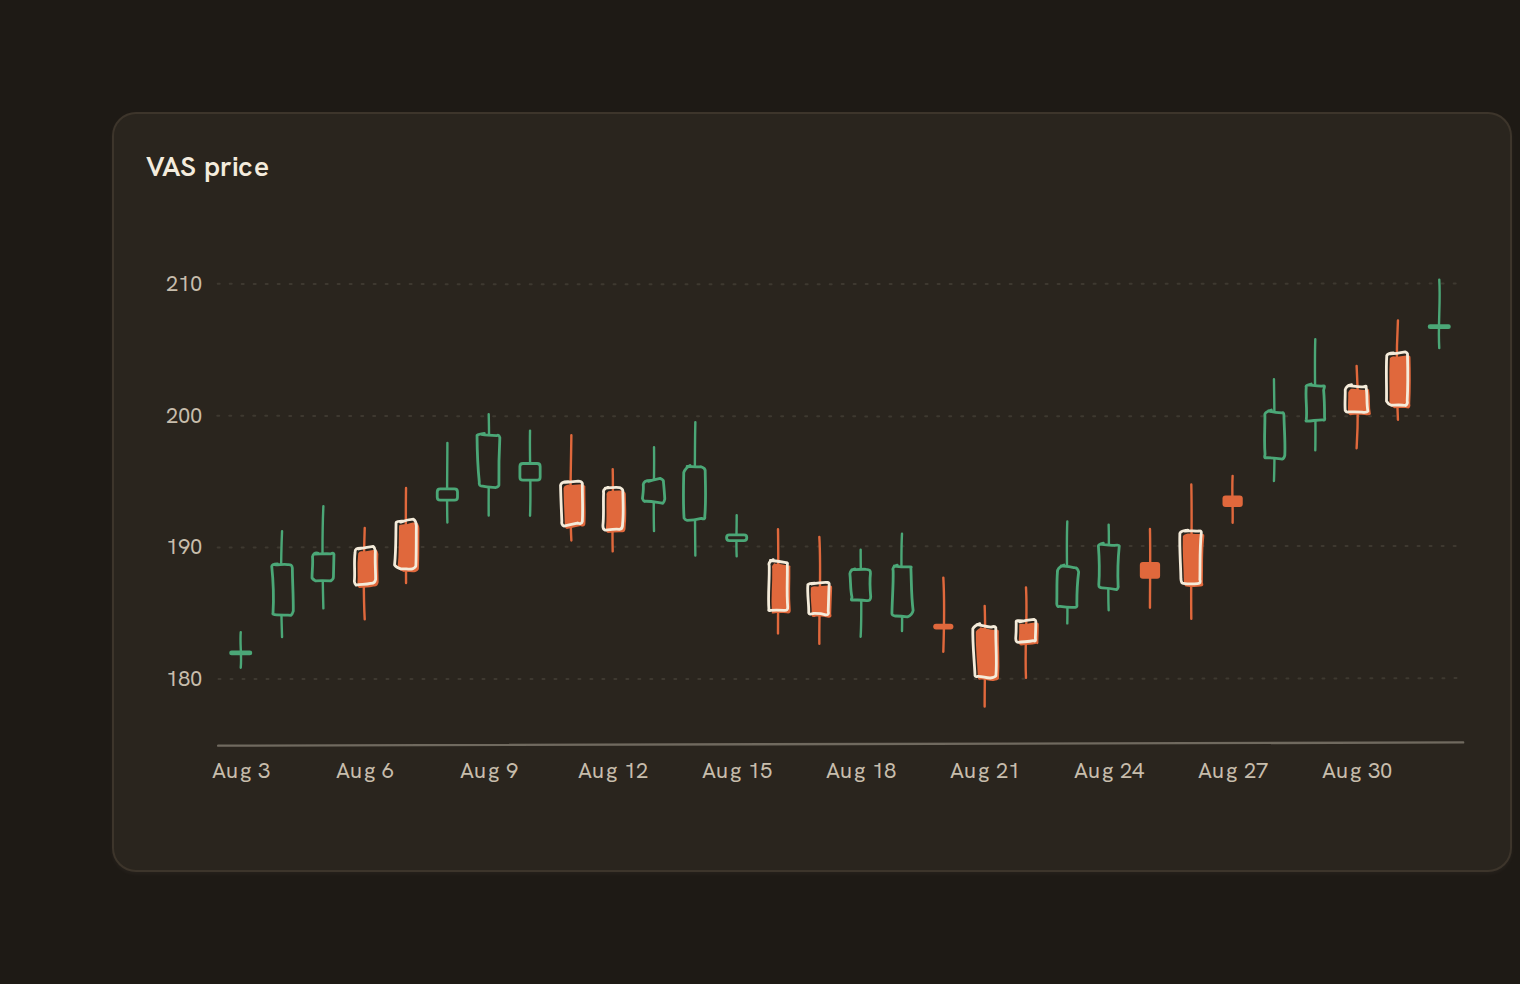 CandlestickOHLC price candles
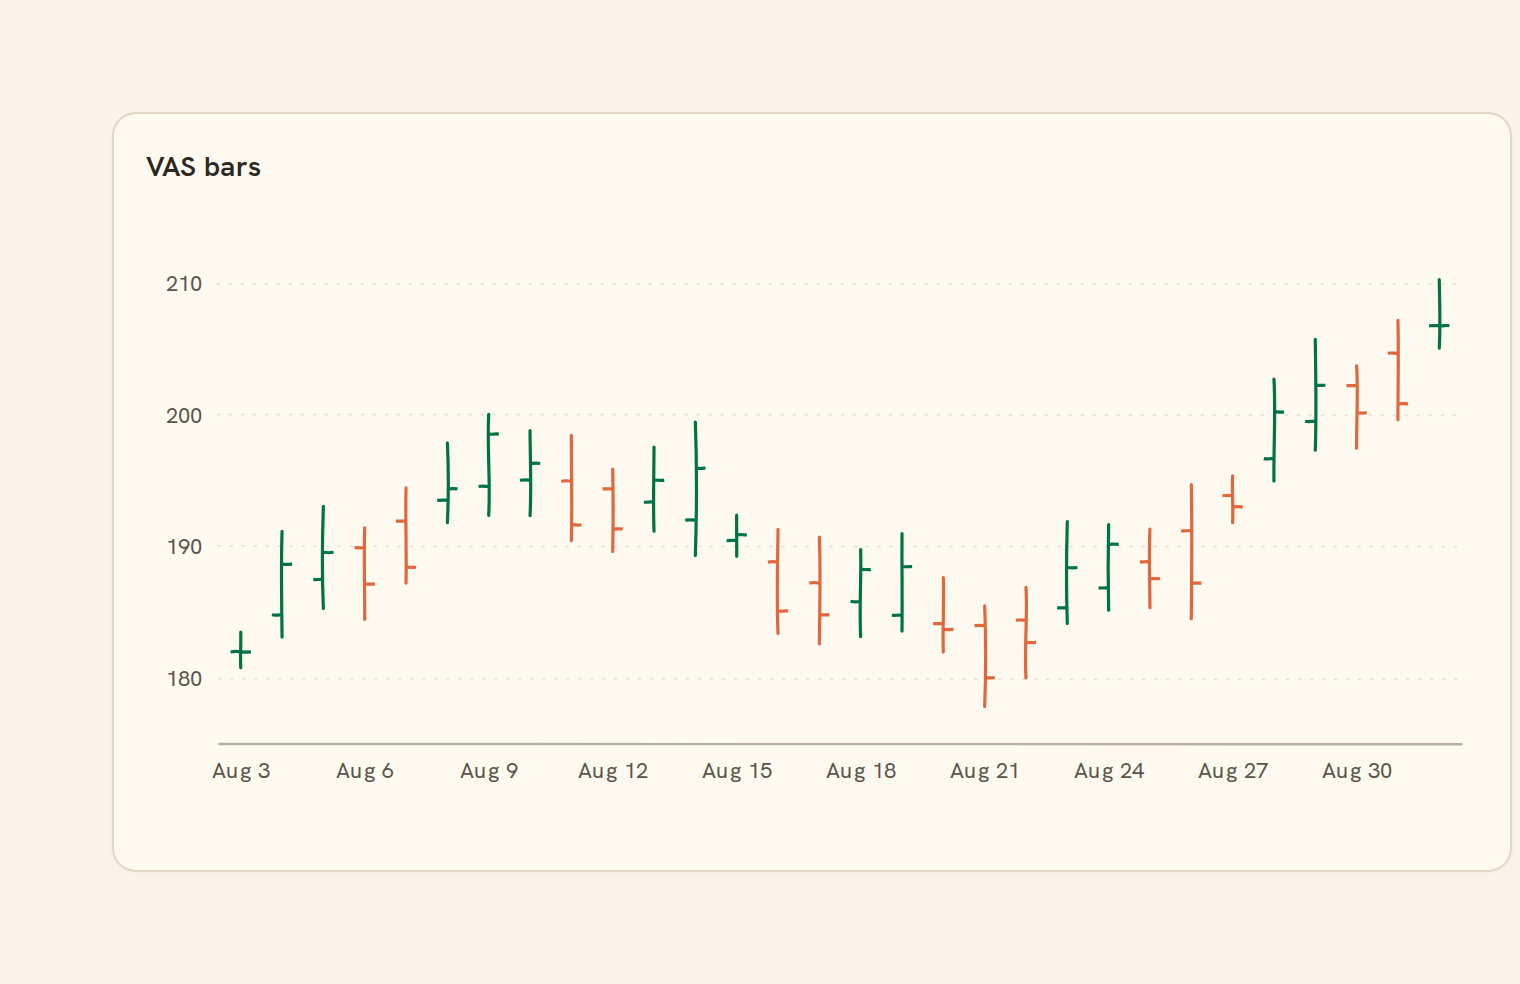
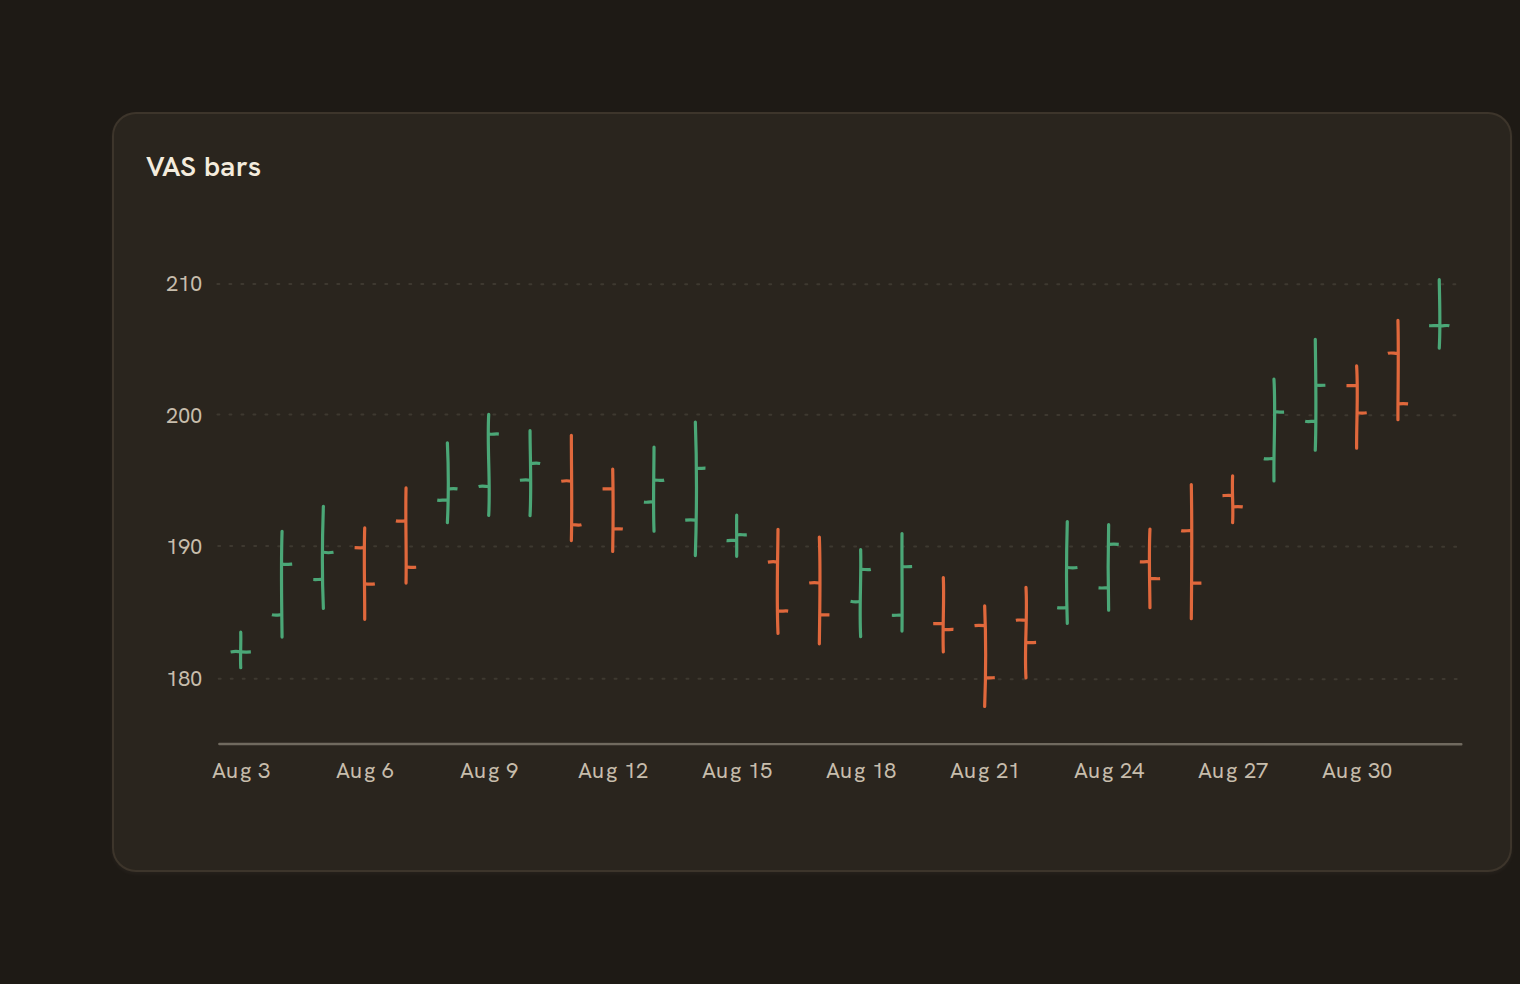 OHLCOpen-High-Low-Close bars
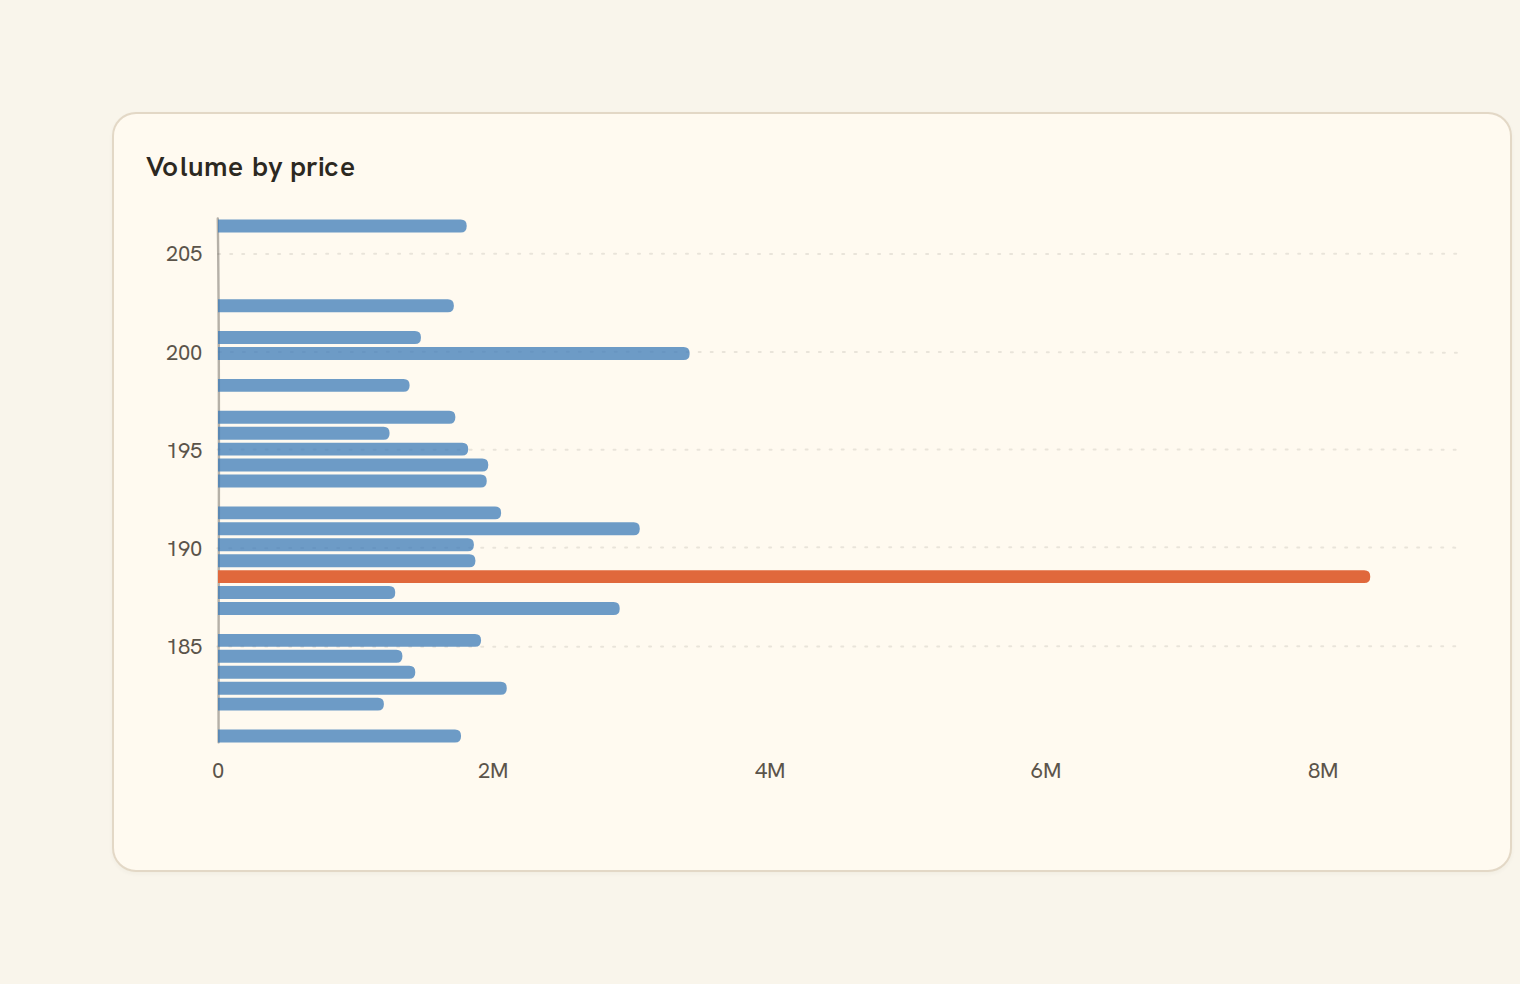
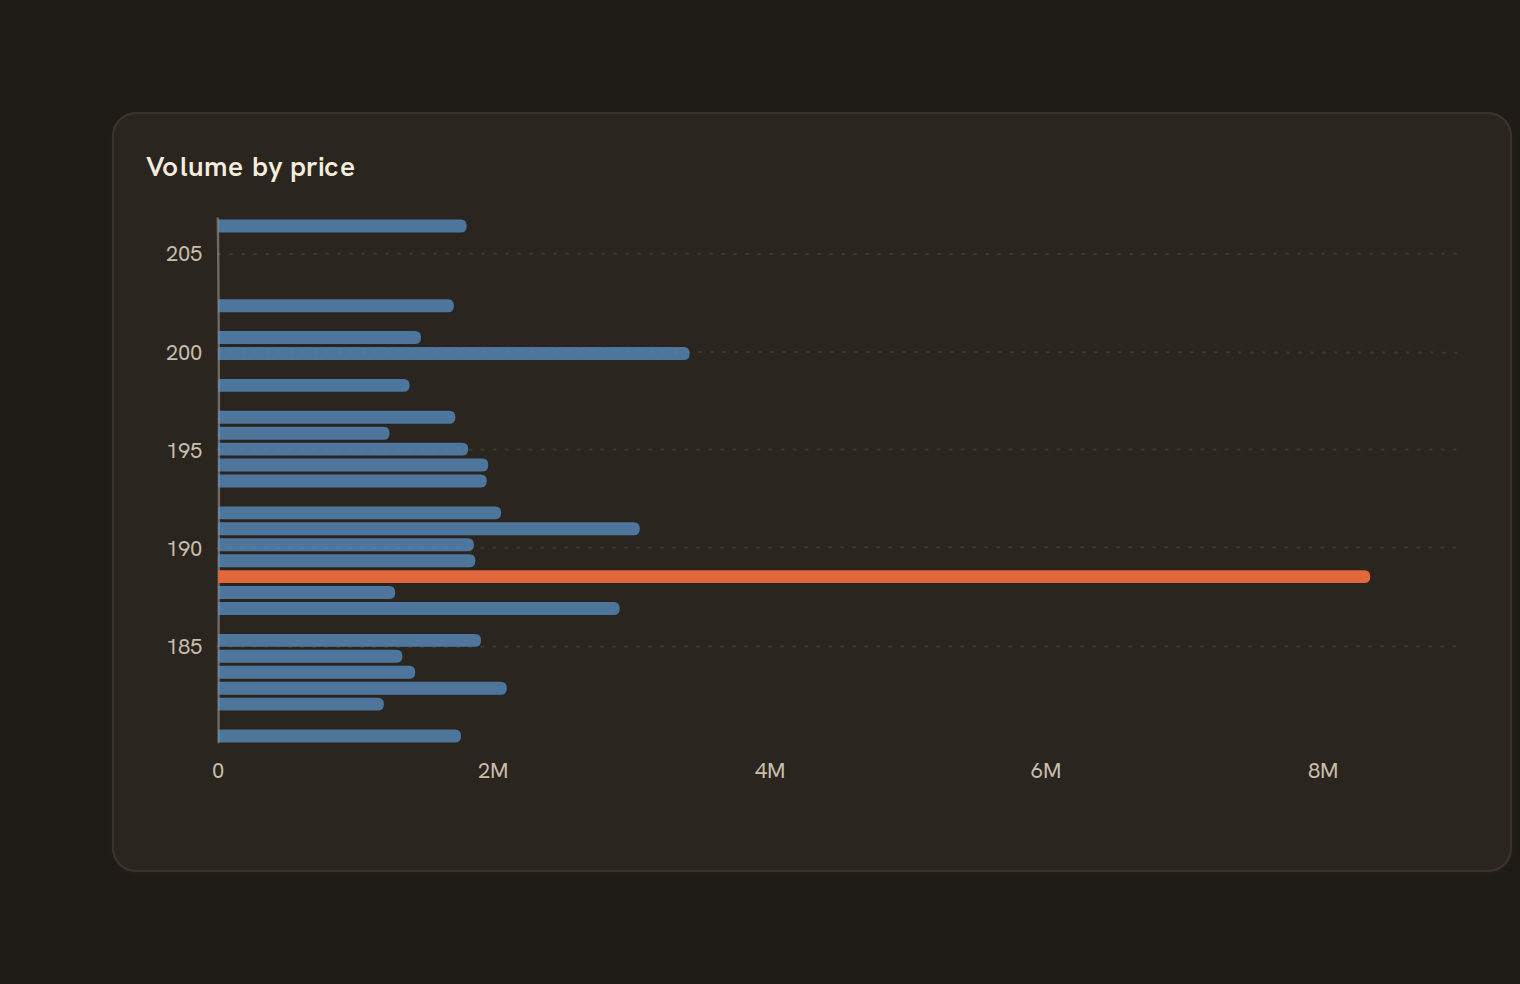 Volume profileVolume traded per price
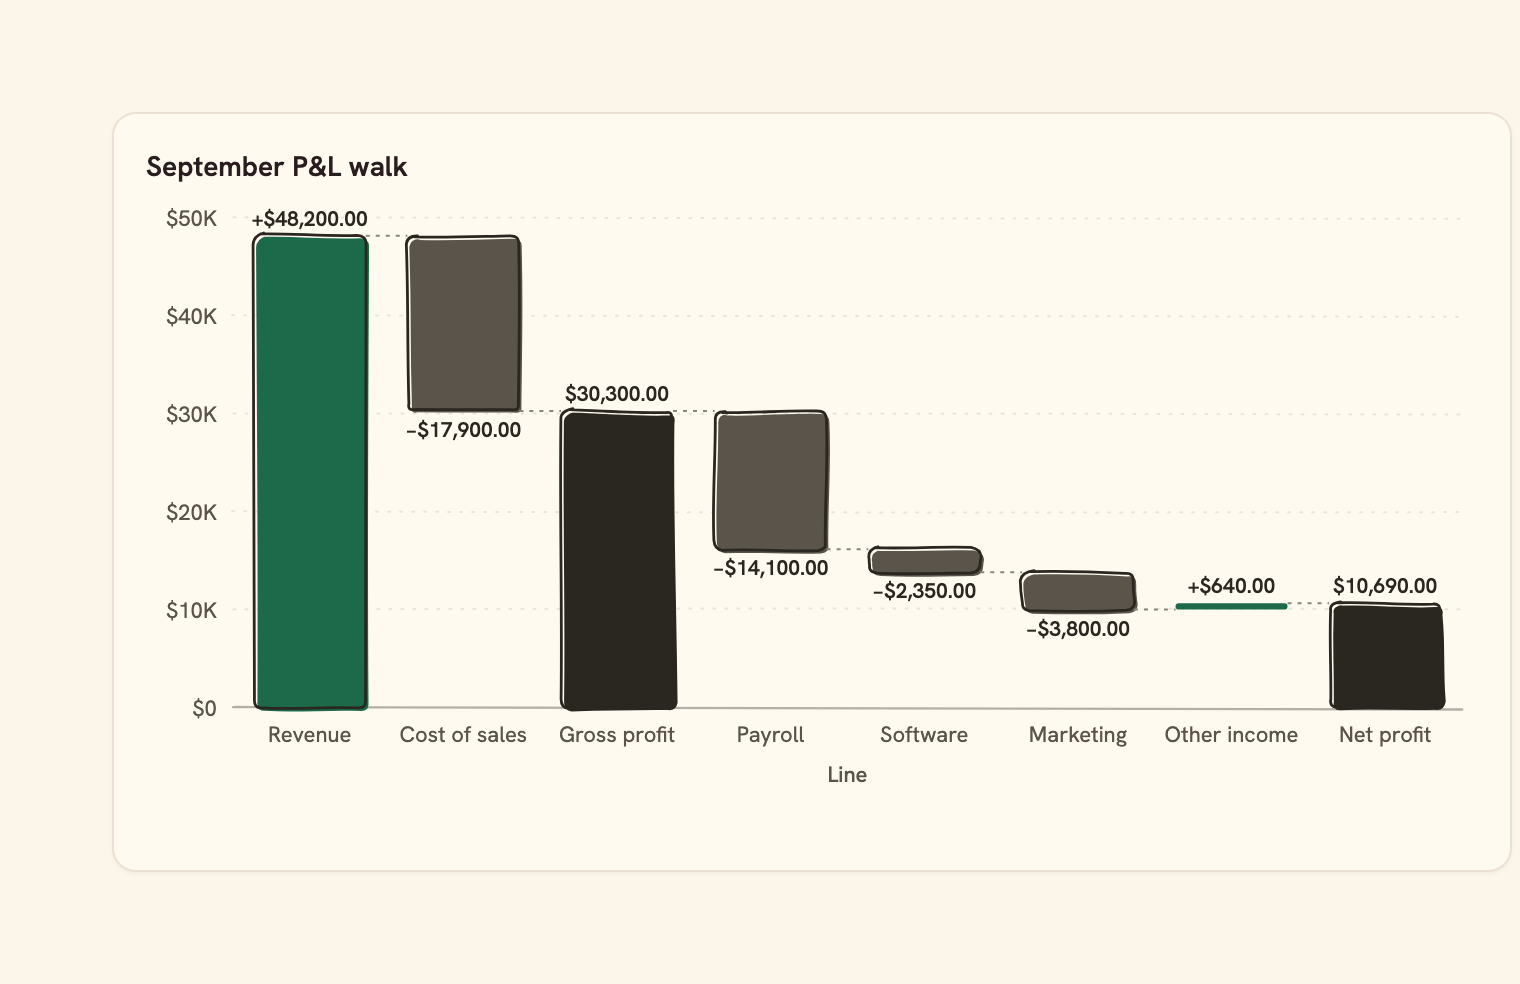
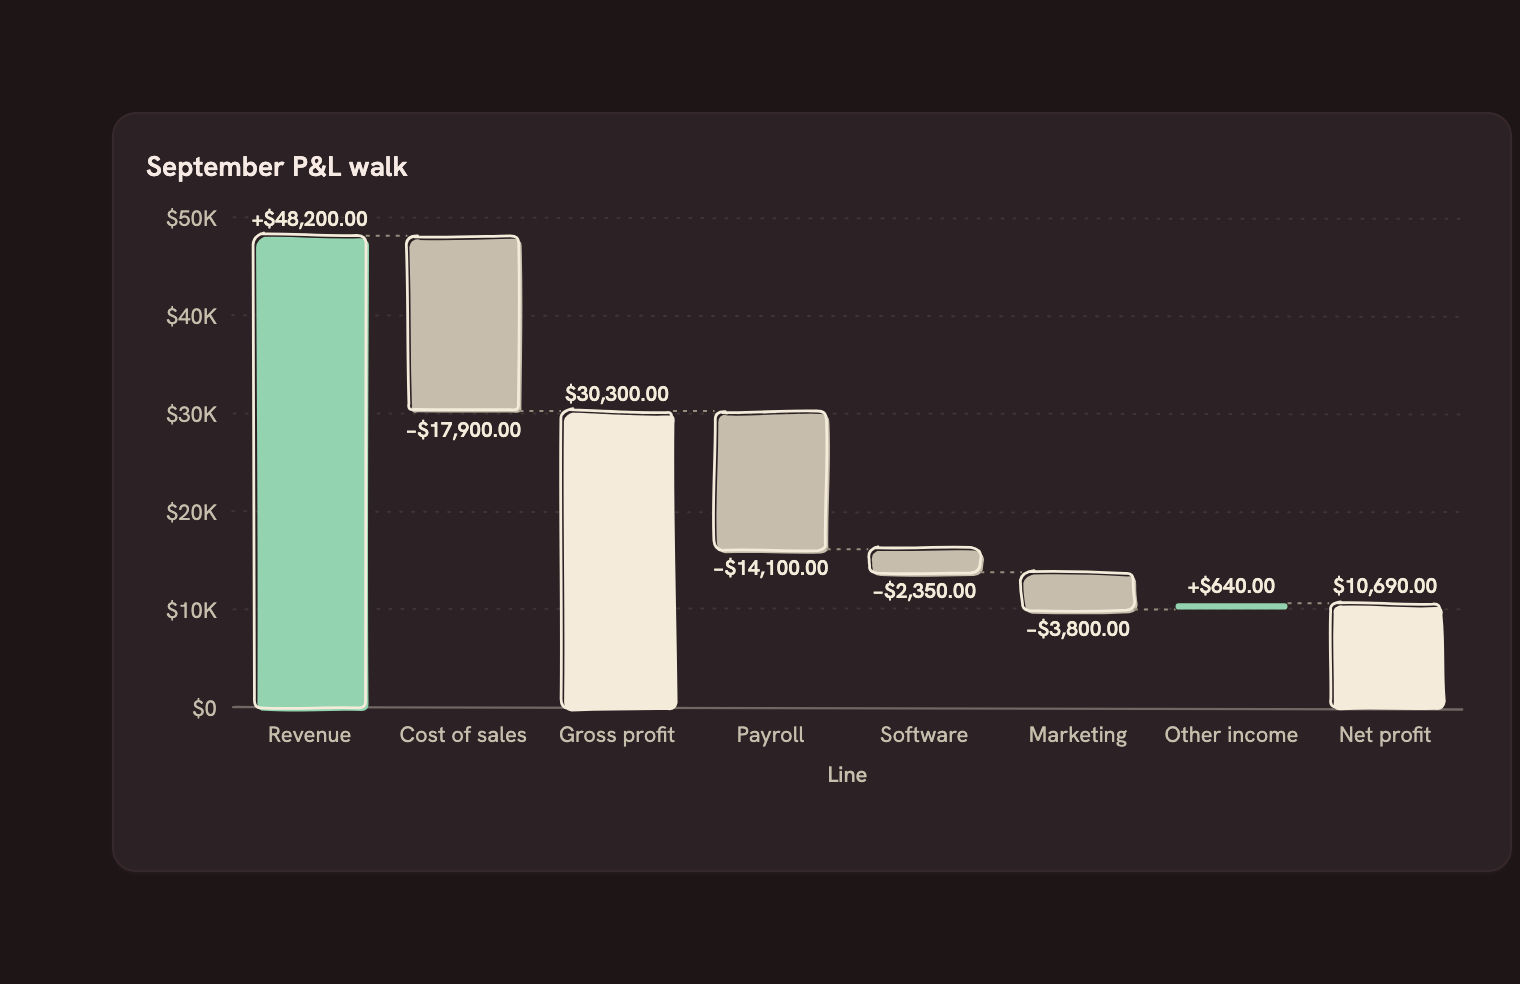 WaterfallWalk from a start to an end amount, step by step (P&L, net-worth change)
Advanced#
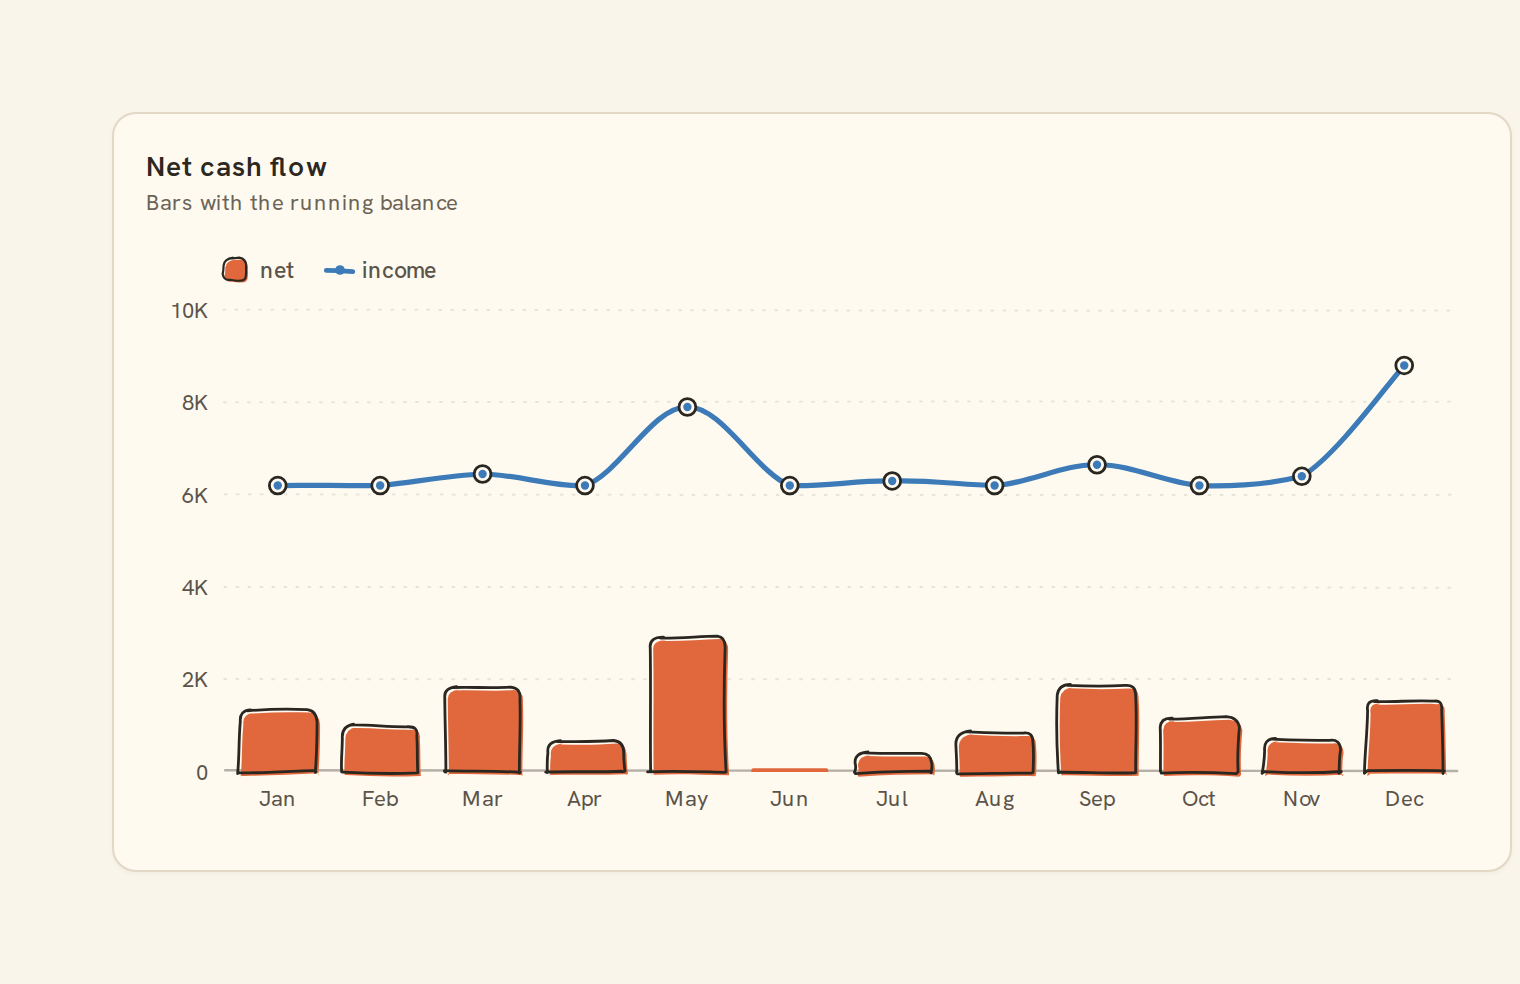
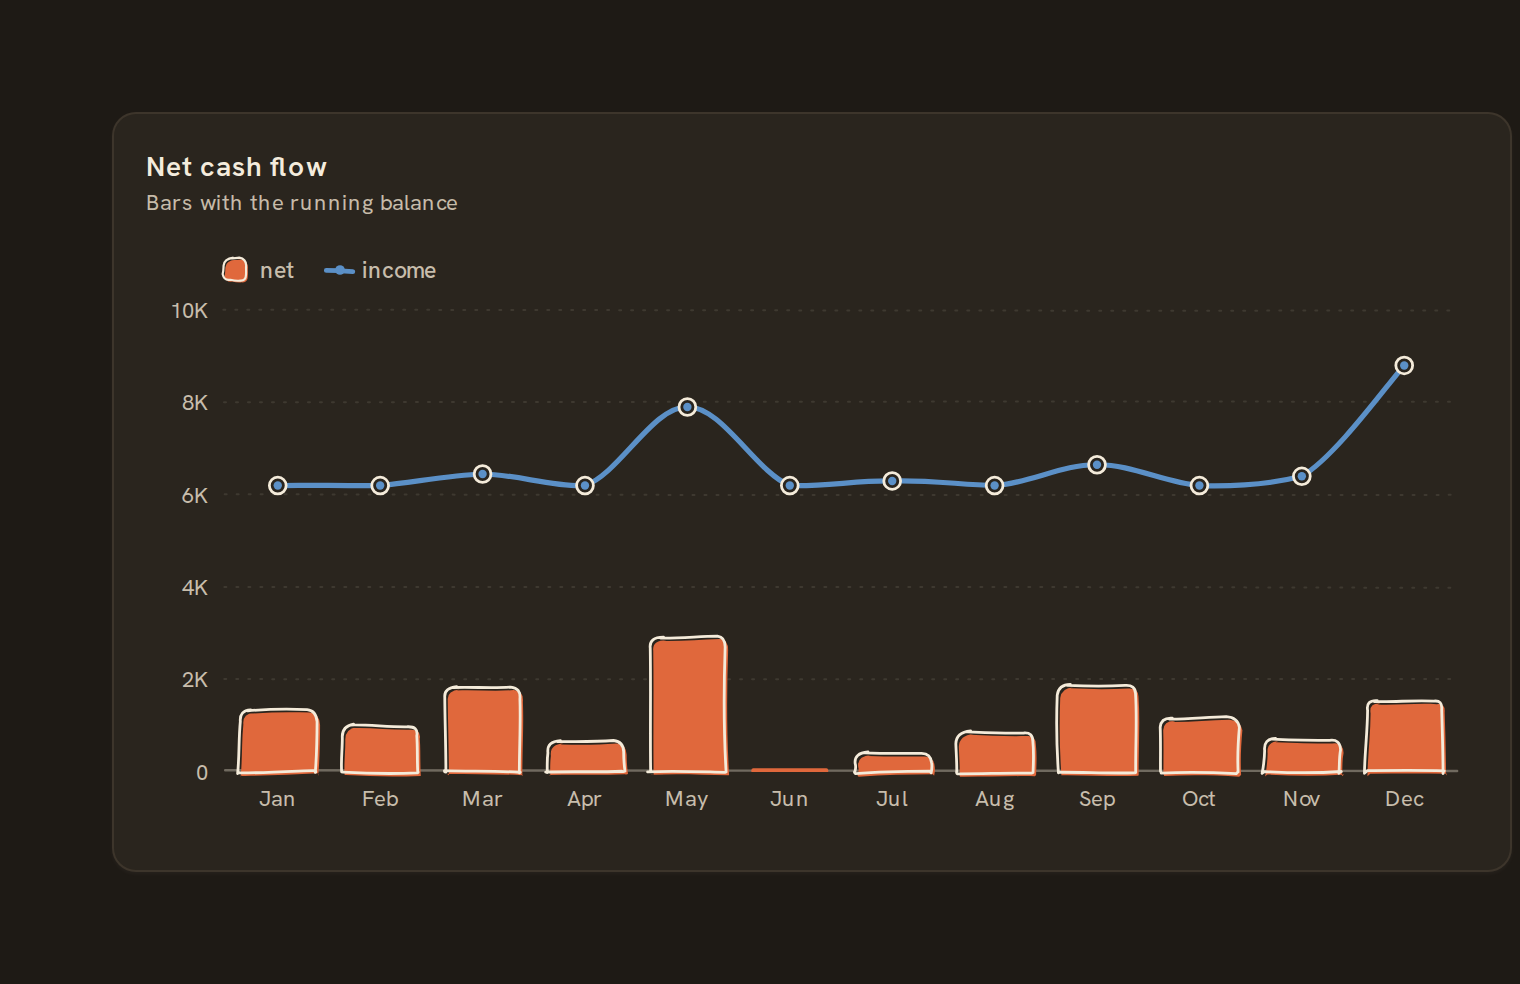
Numbers and tables#
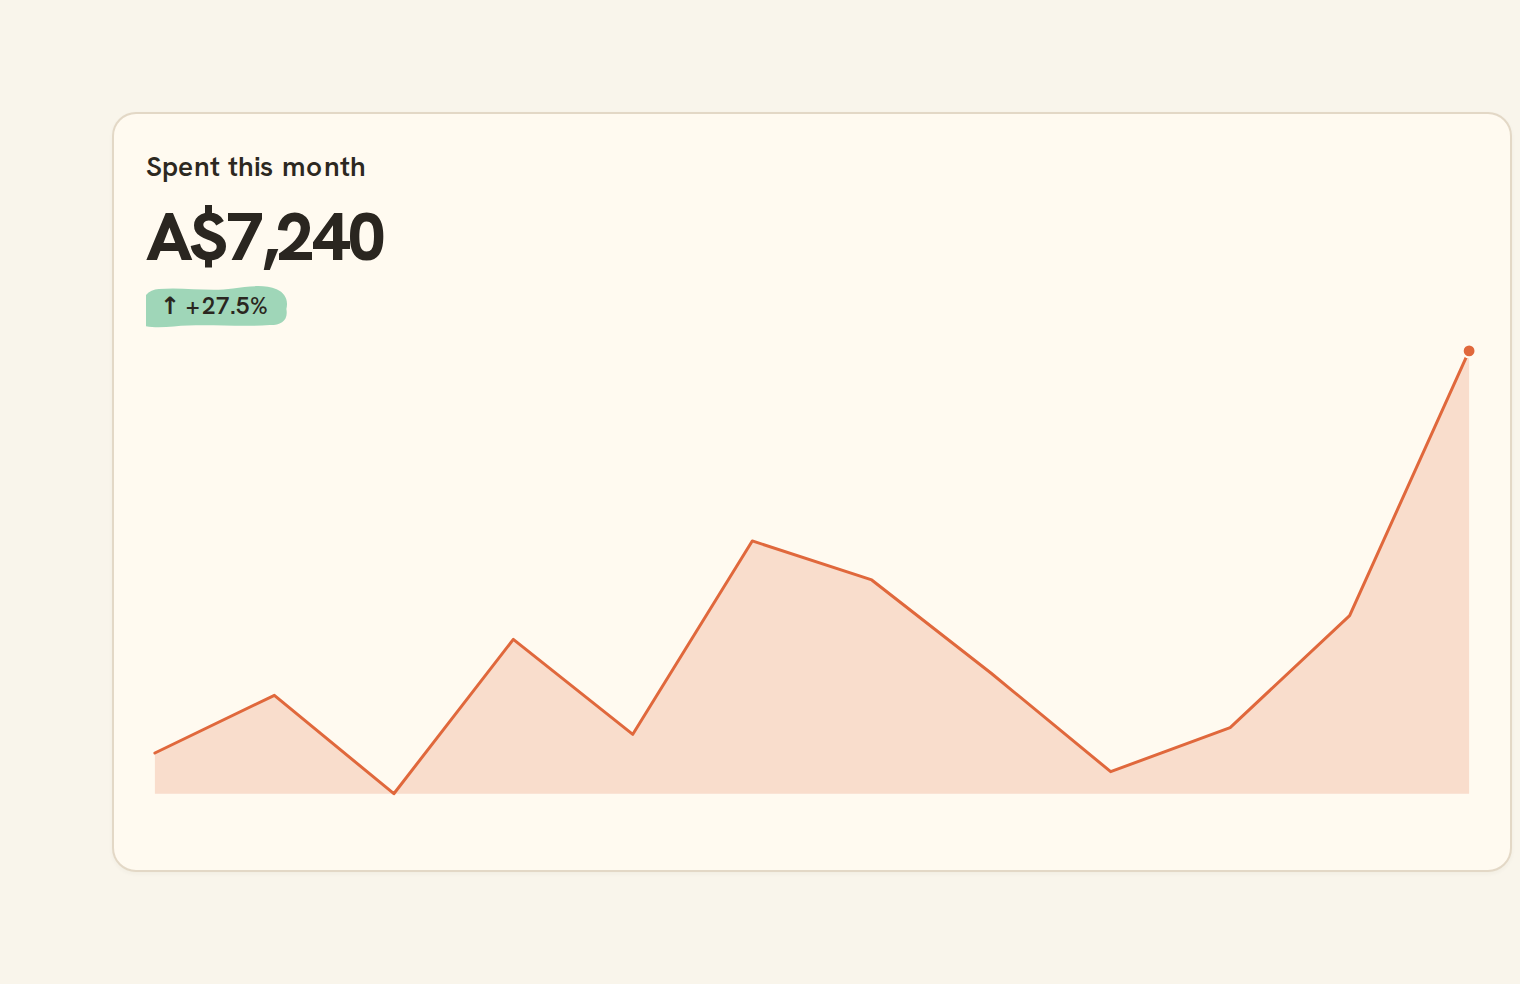
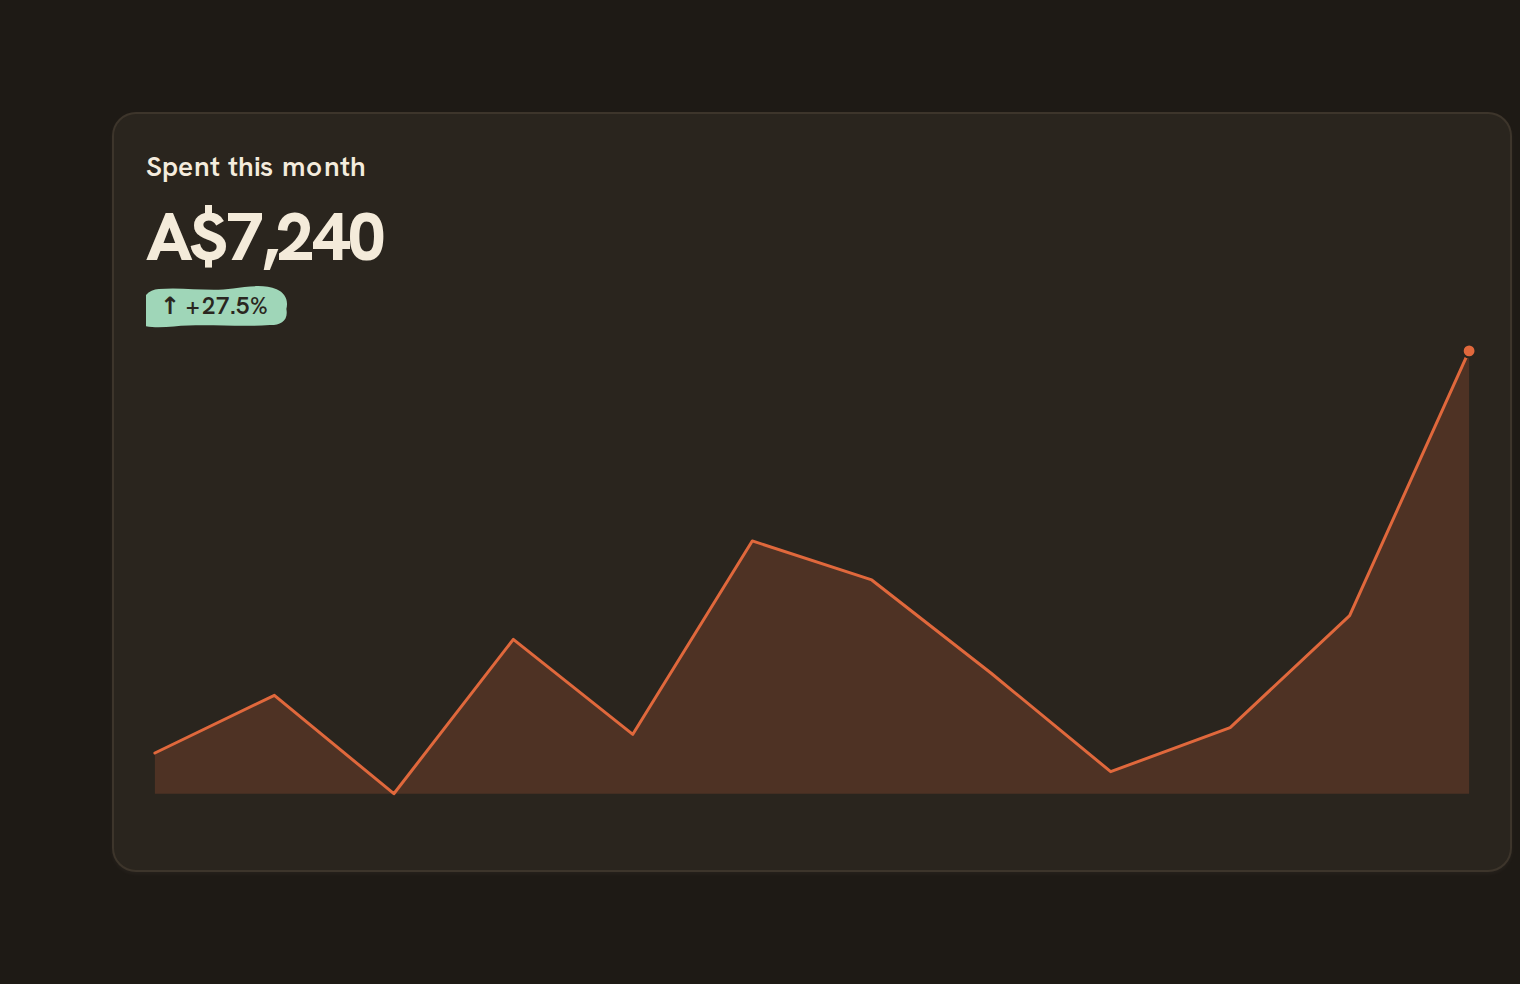
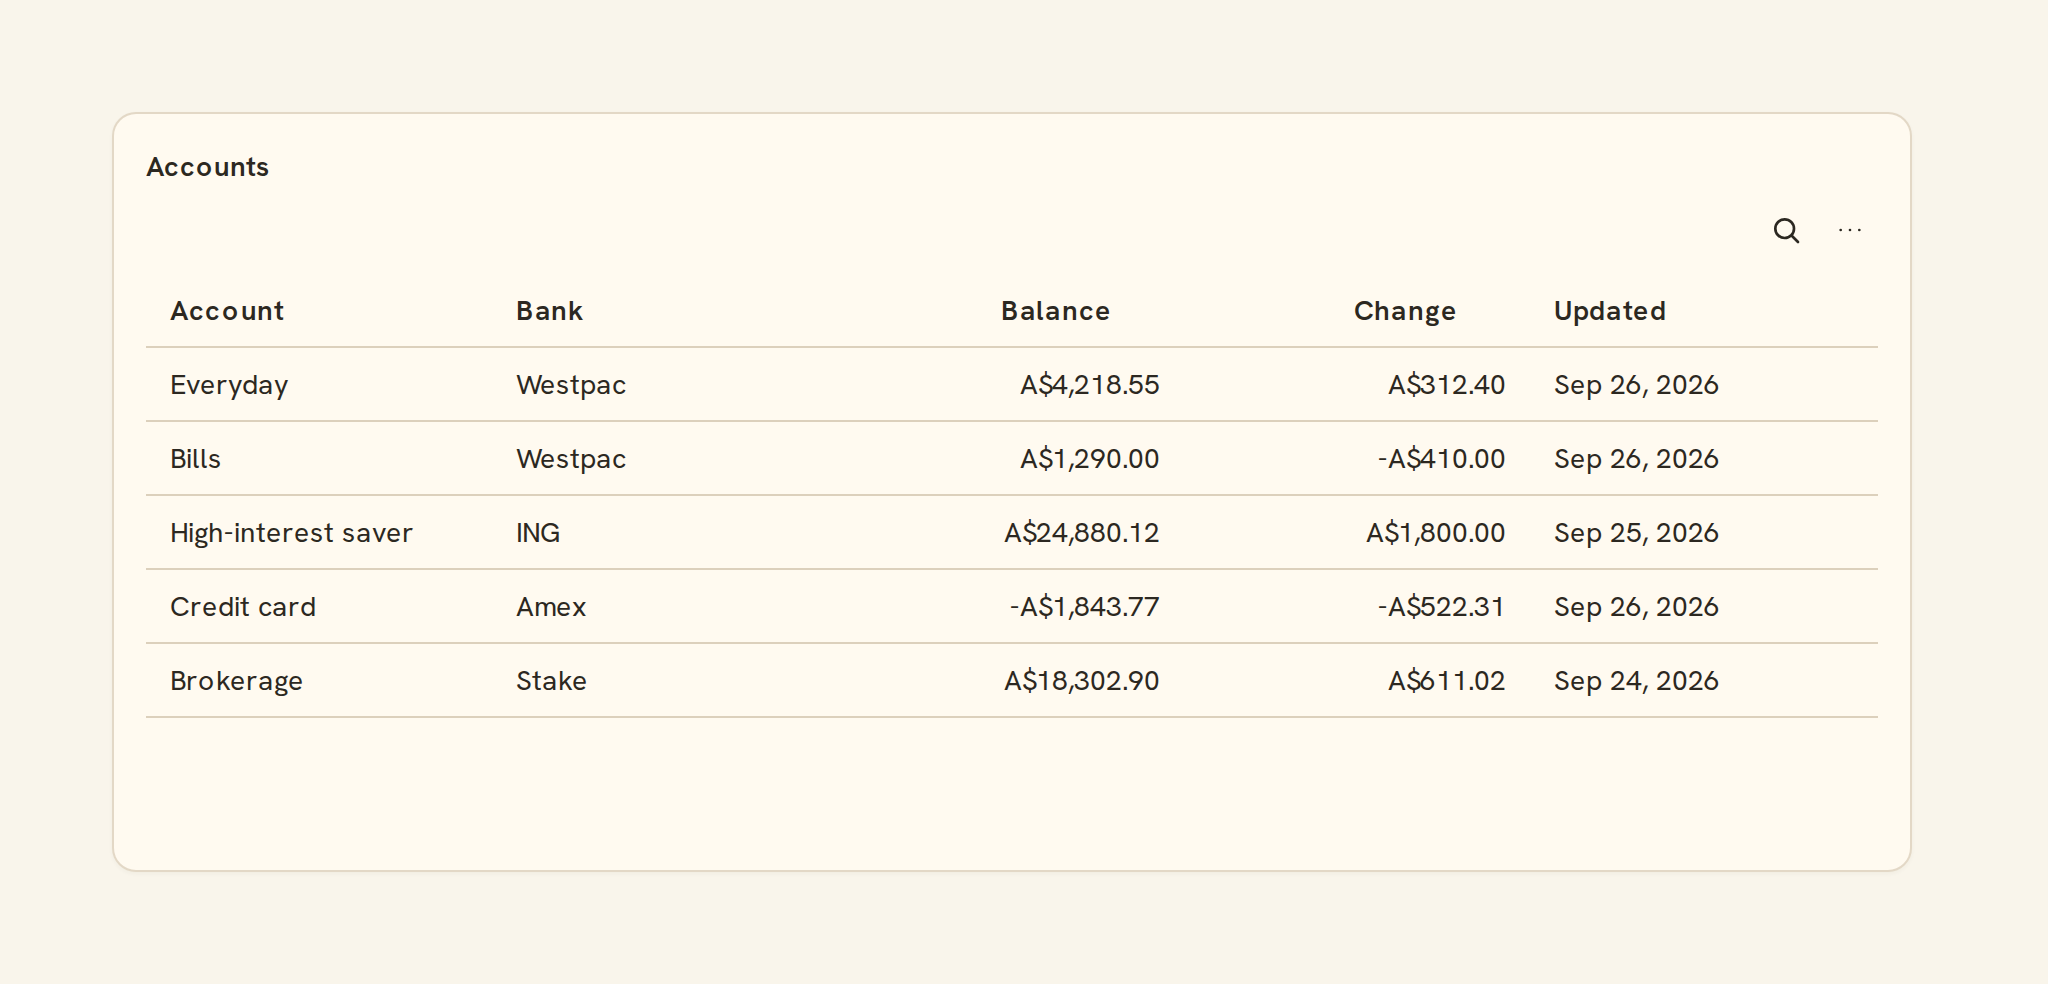
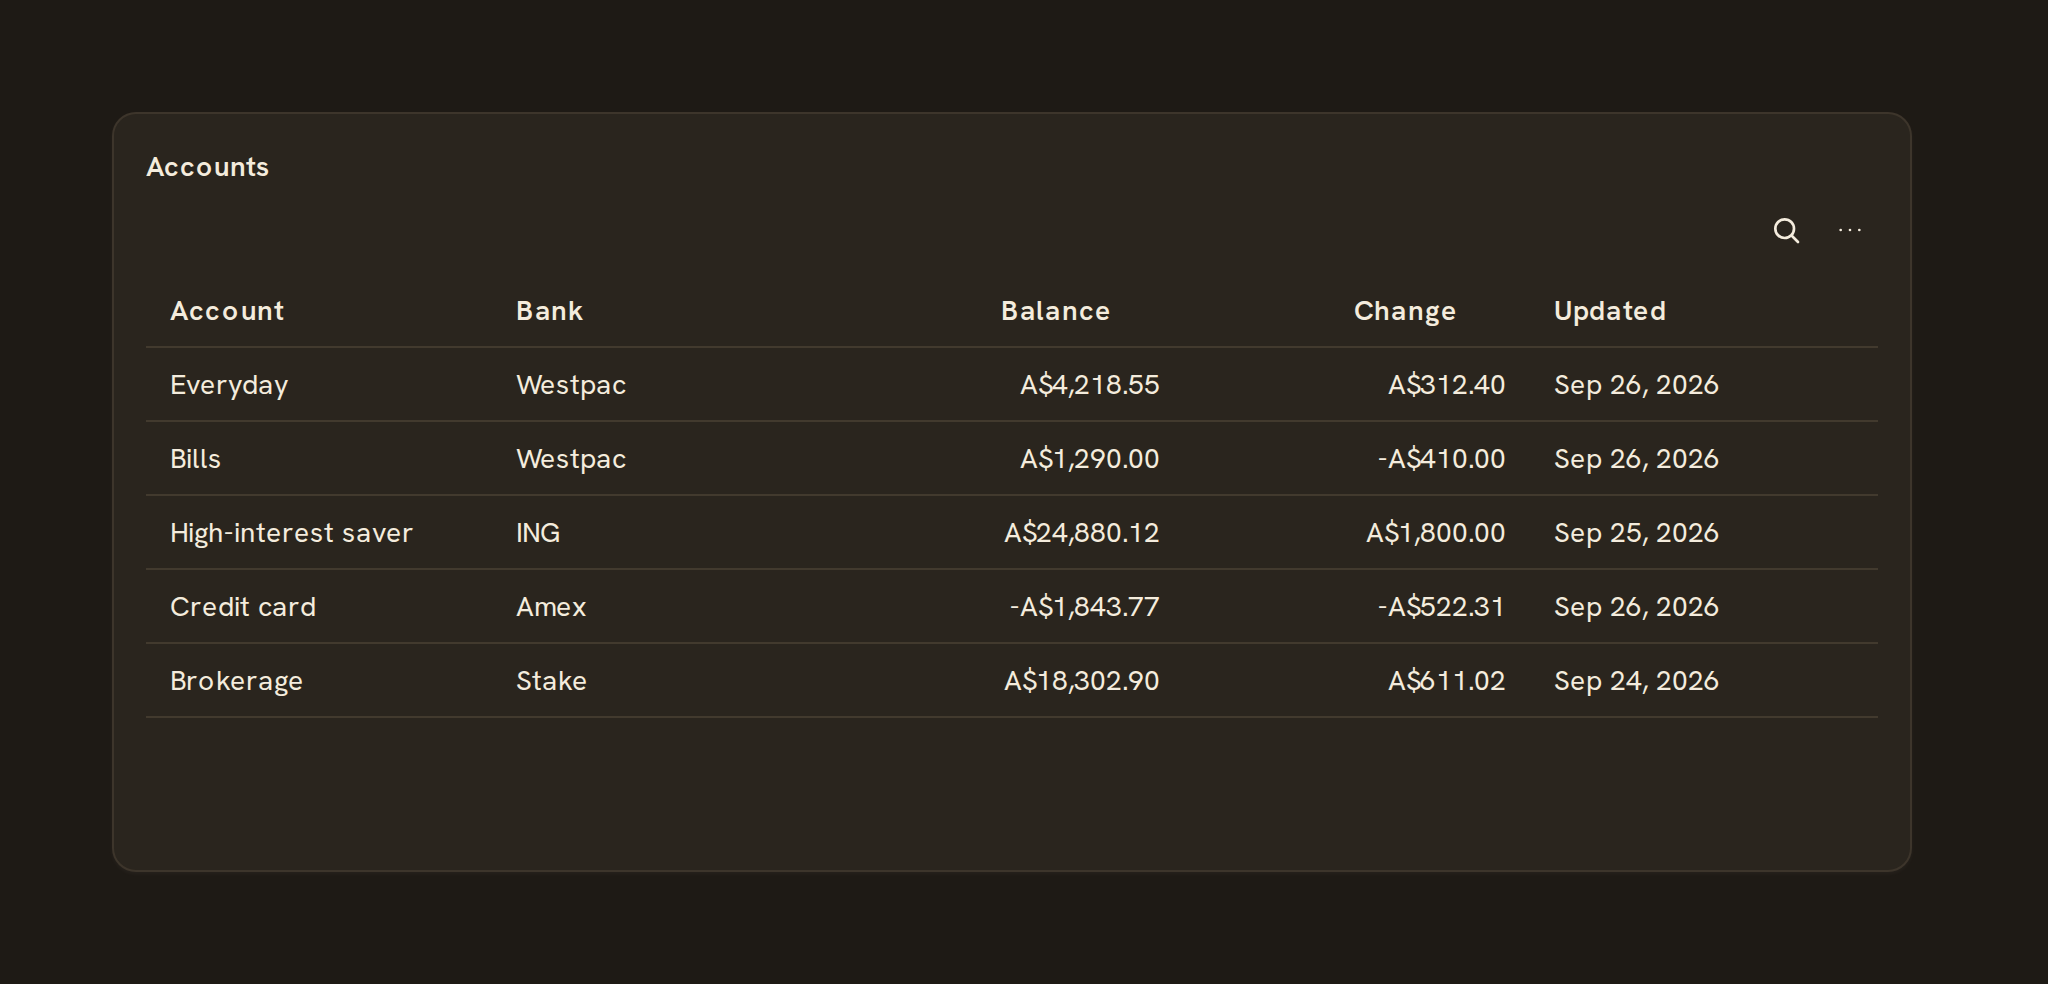
Correlation#
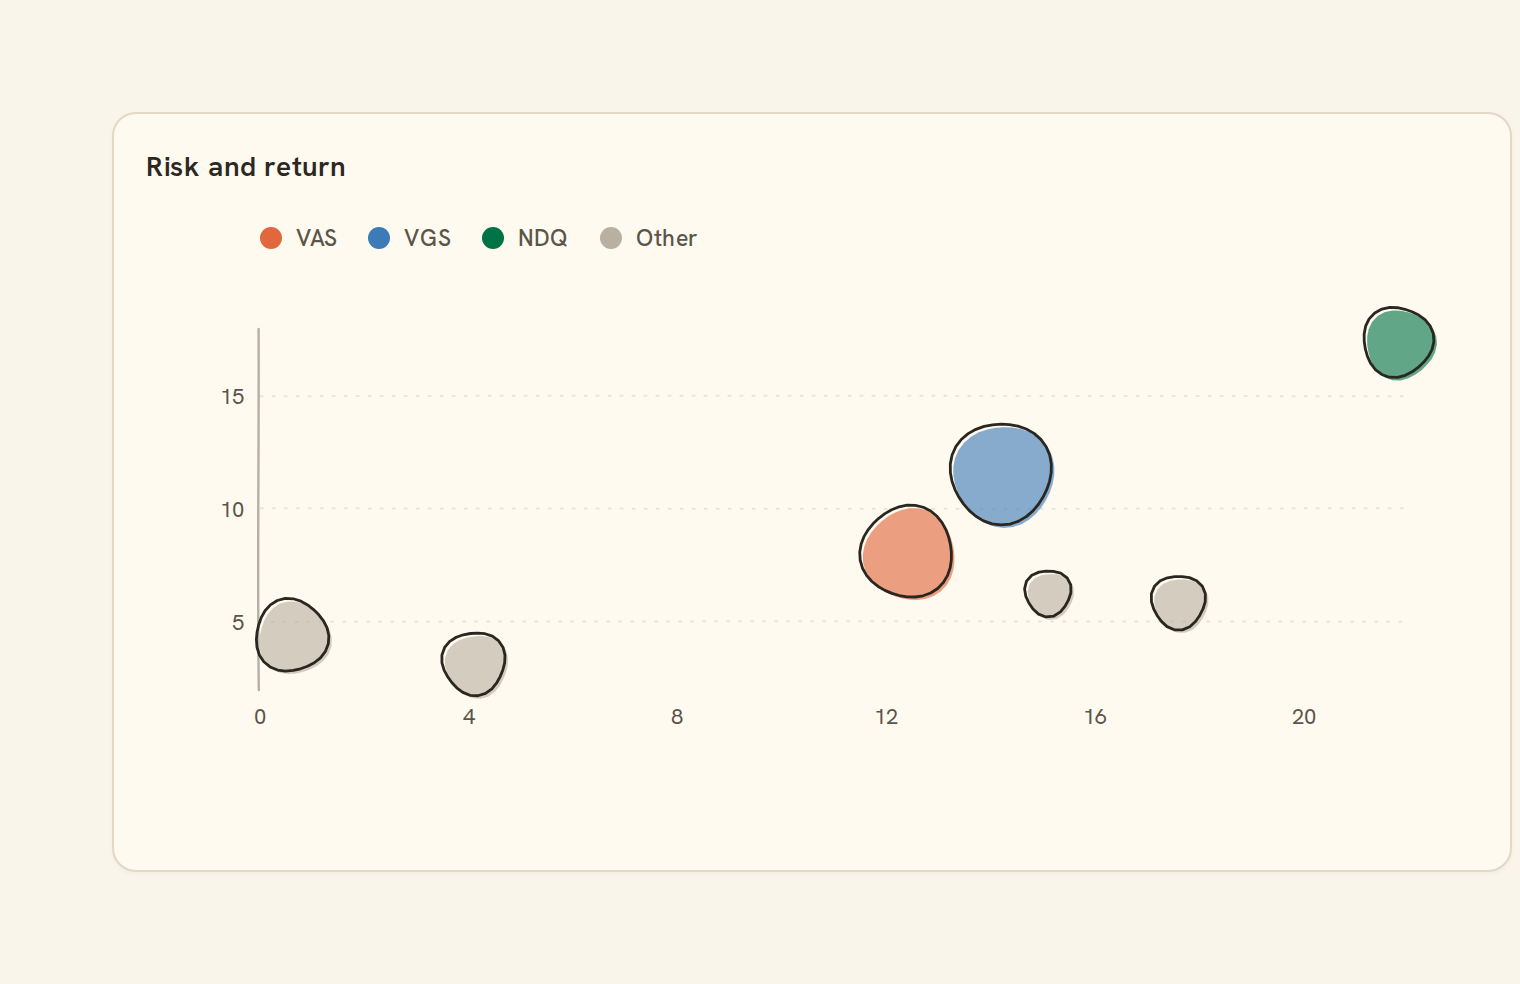
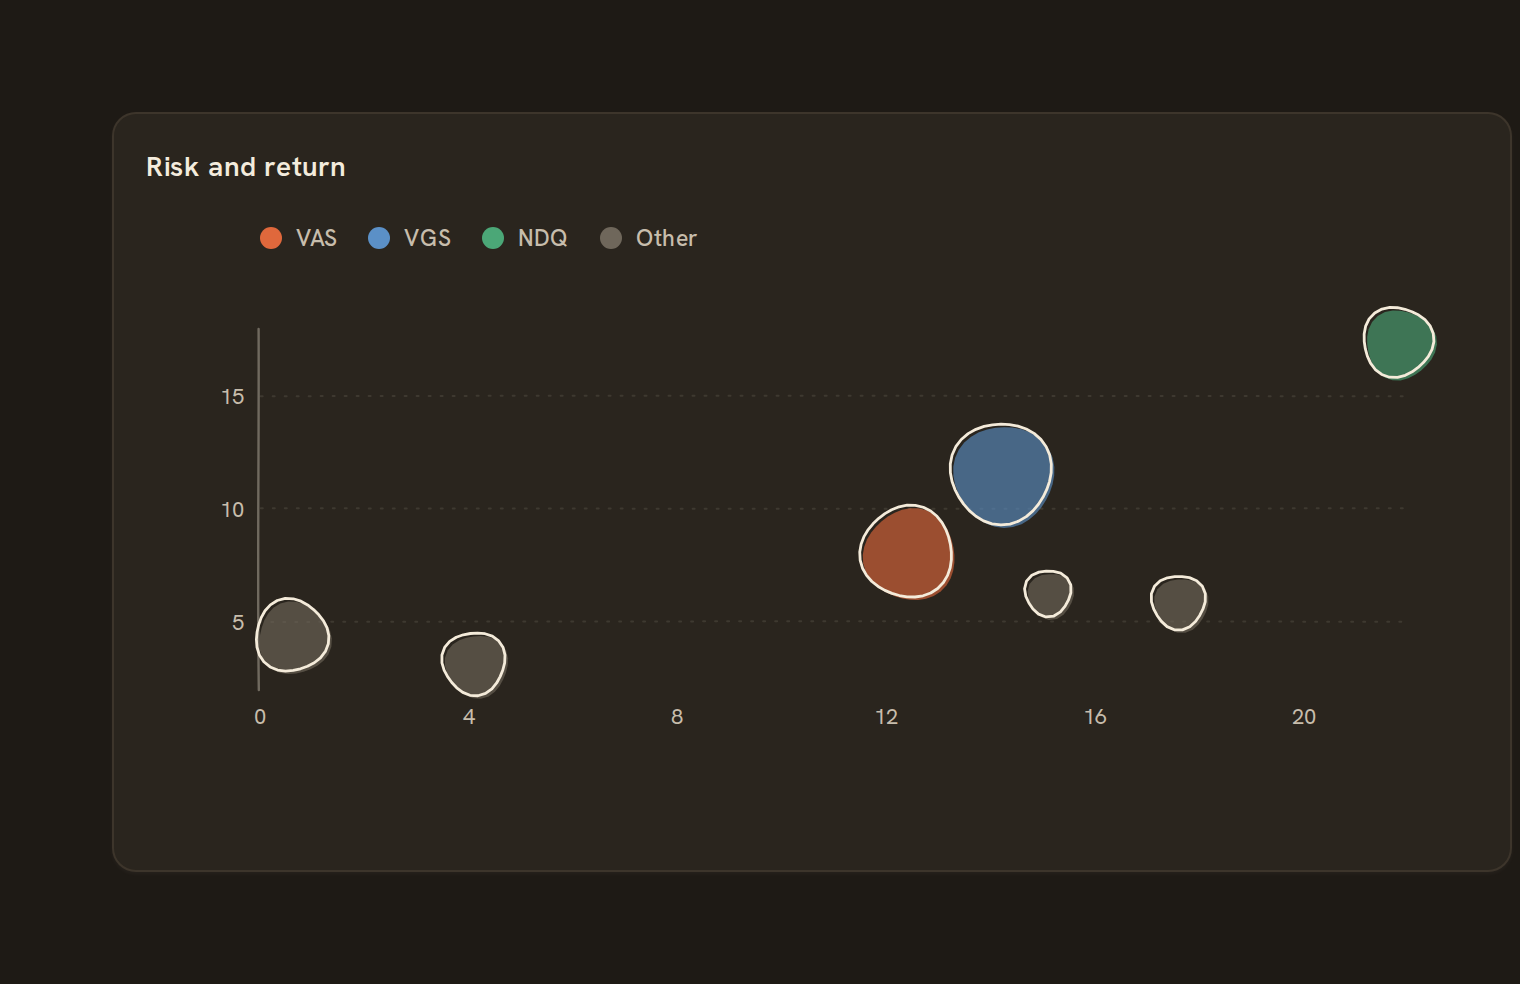 Bubble chartScatter sized by a field
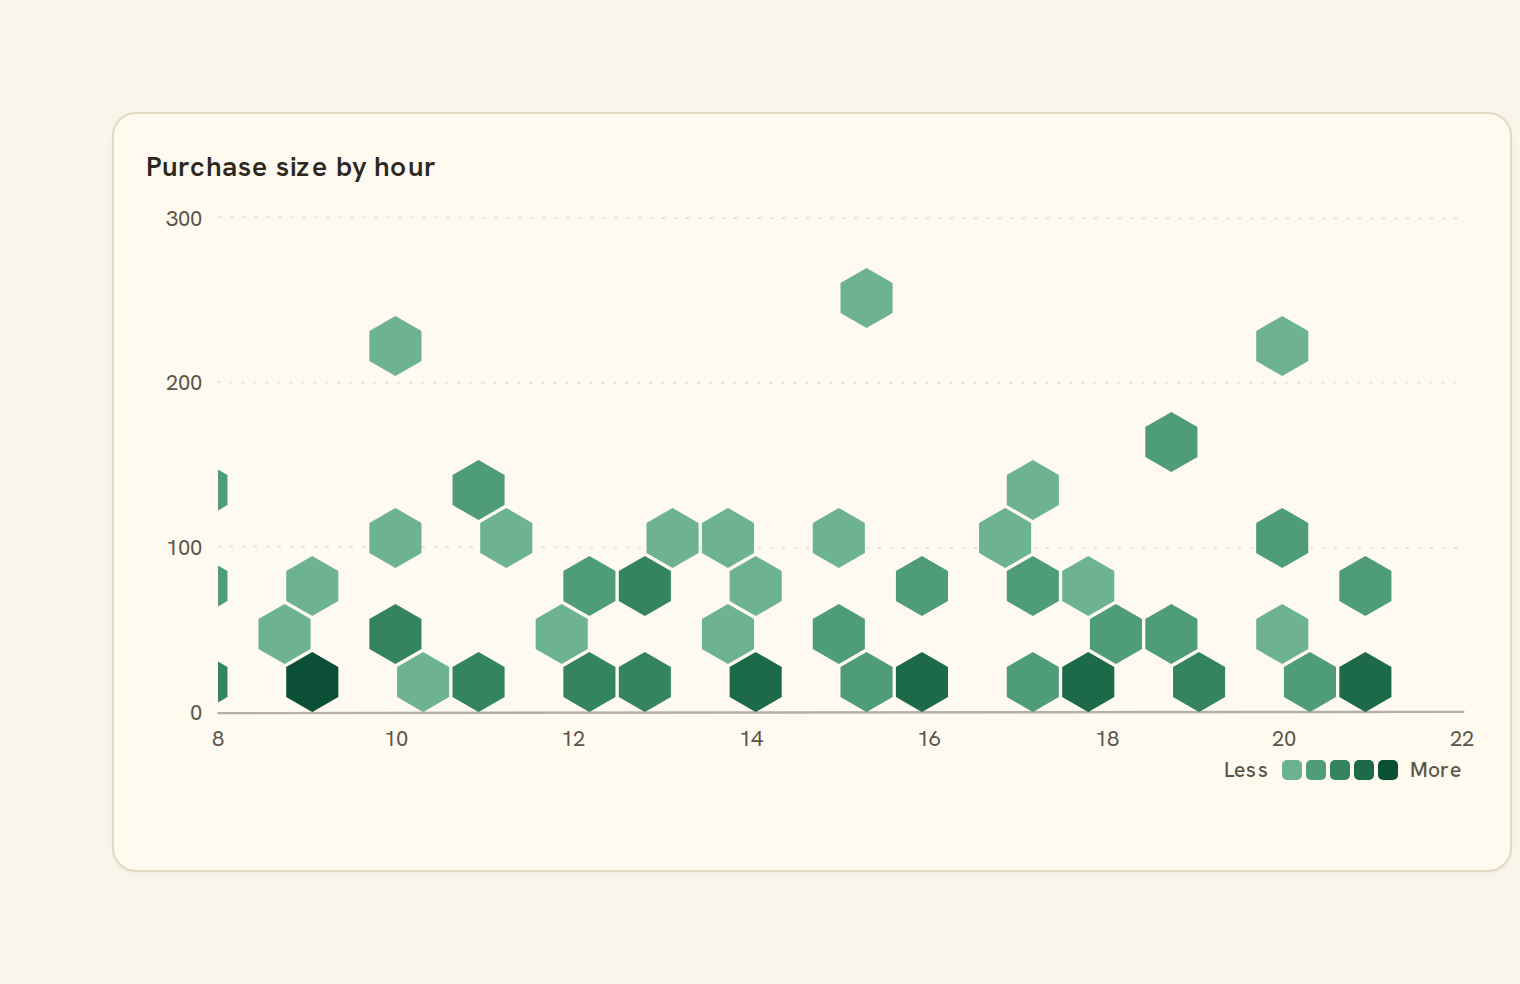
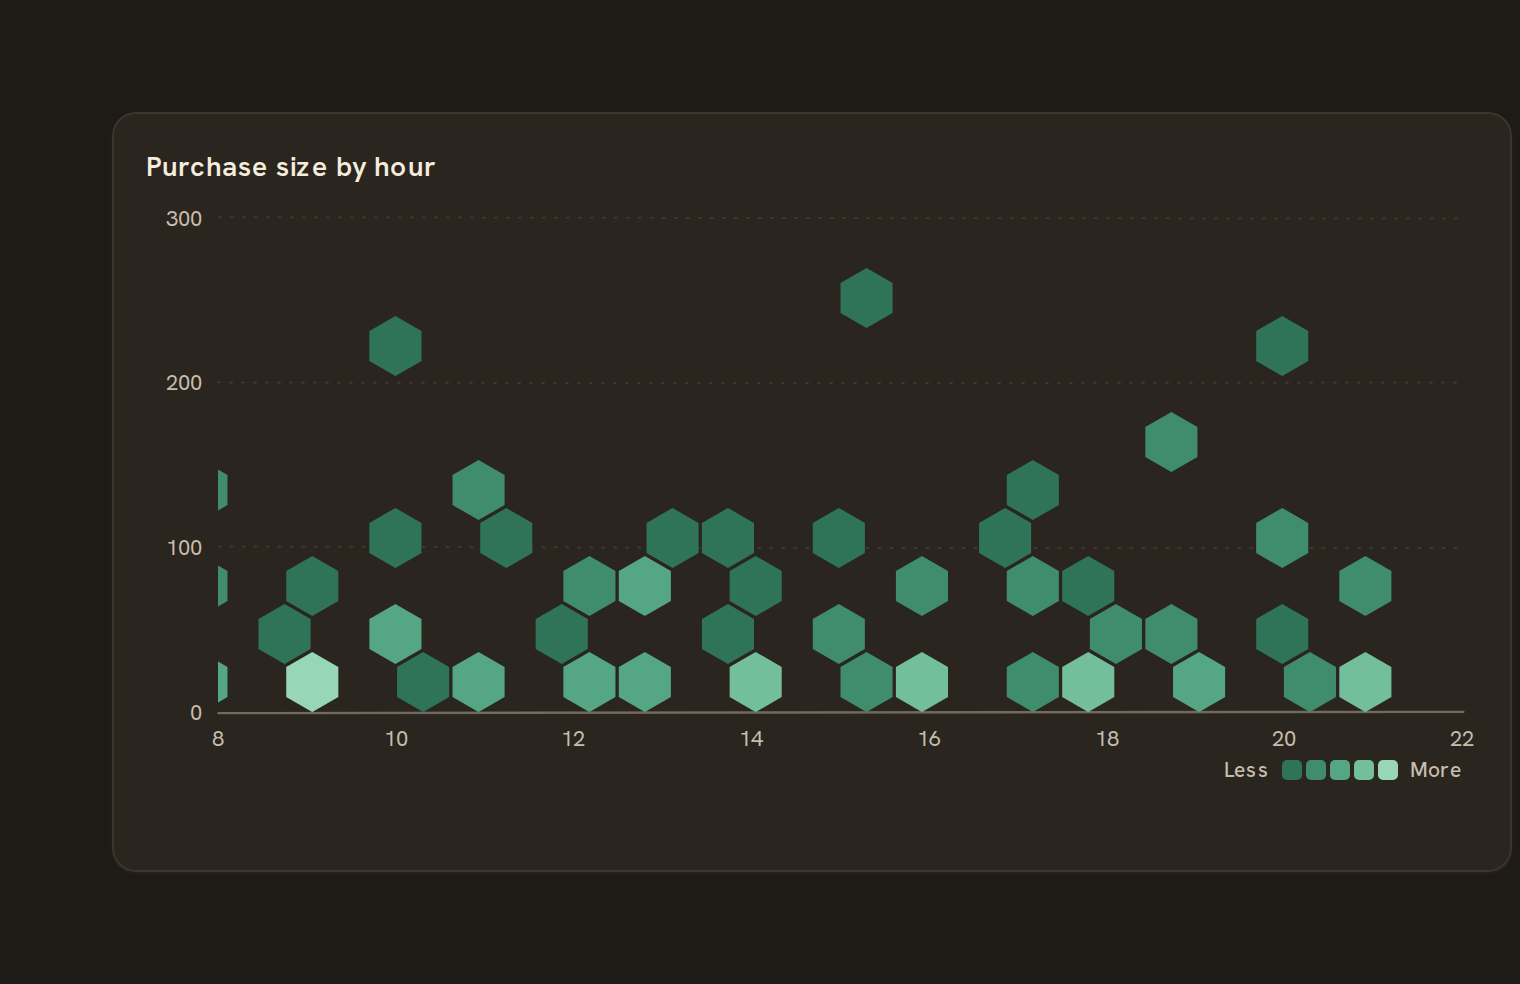 HexbinBinned 2D density
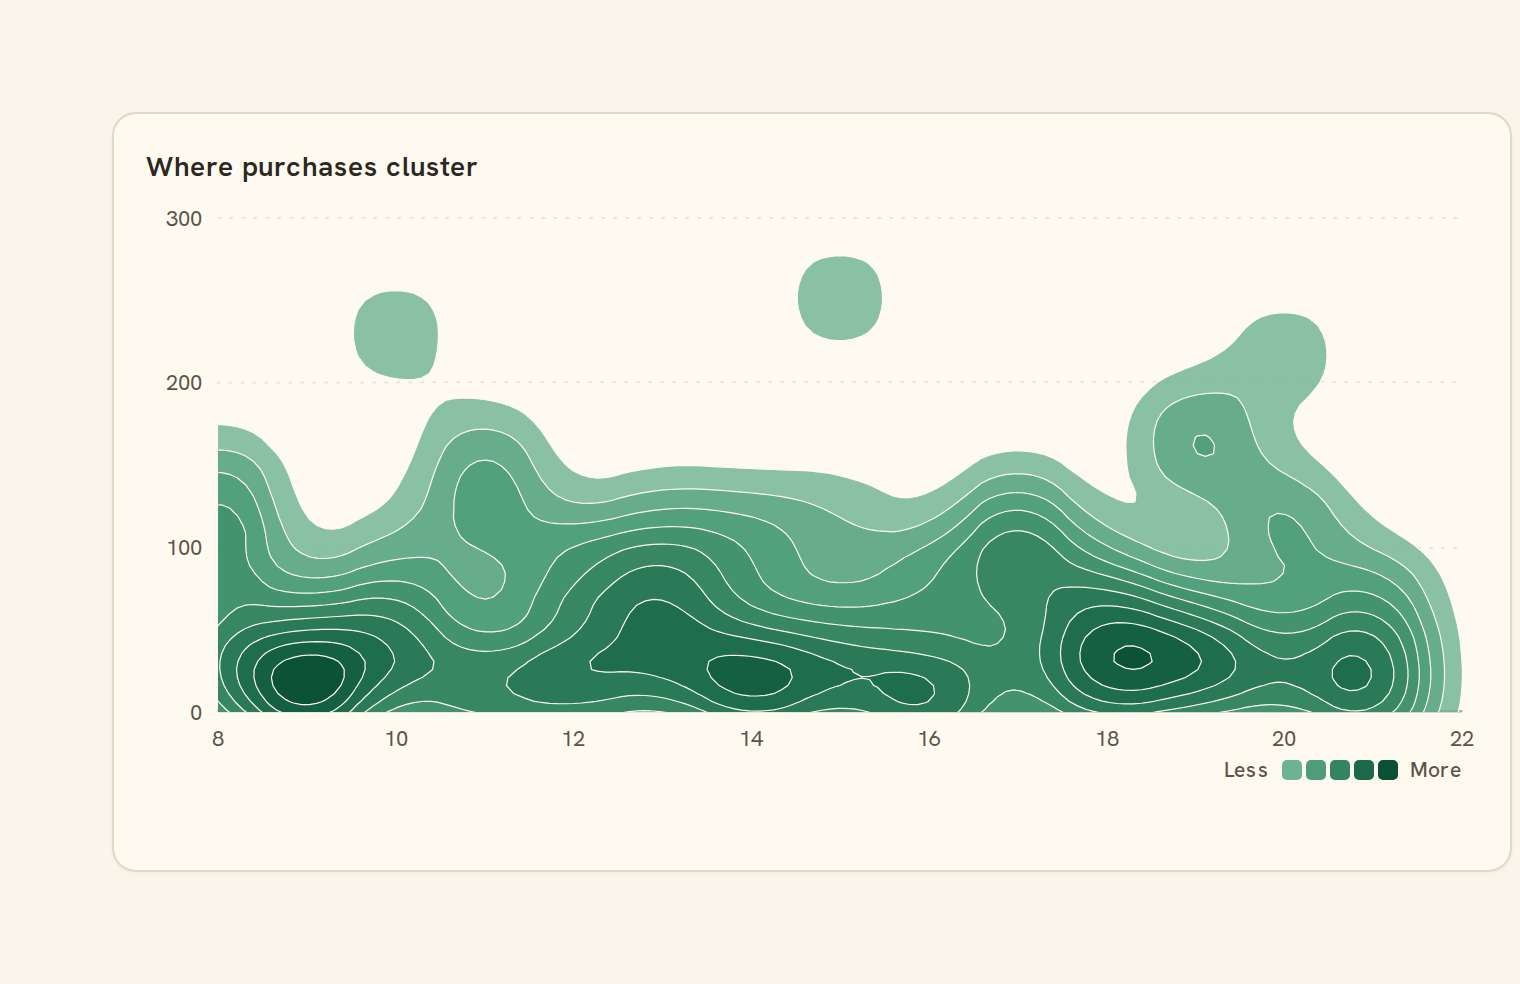
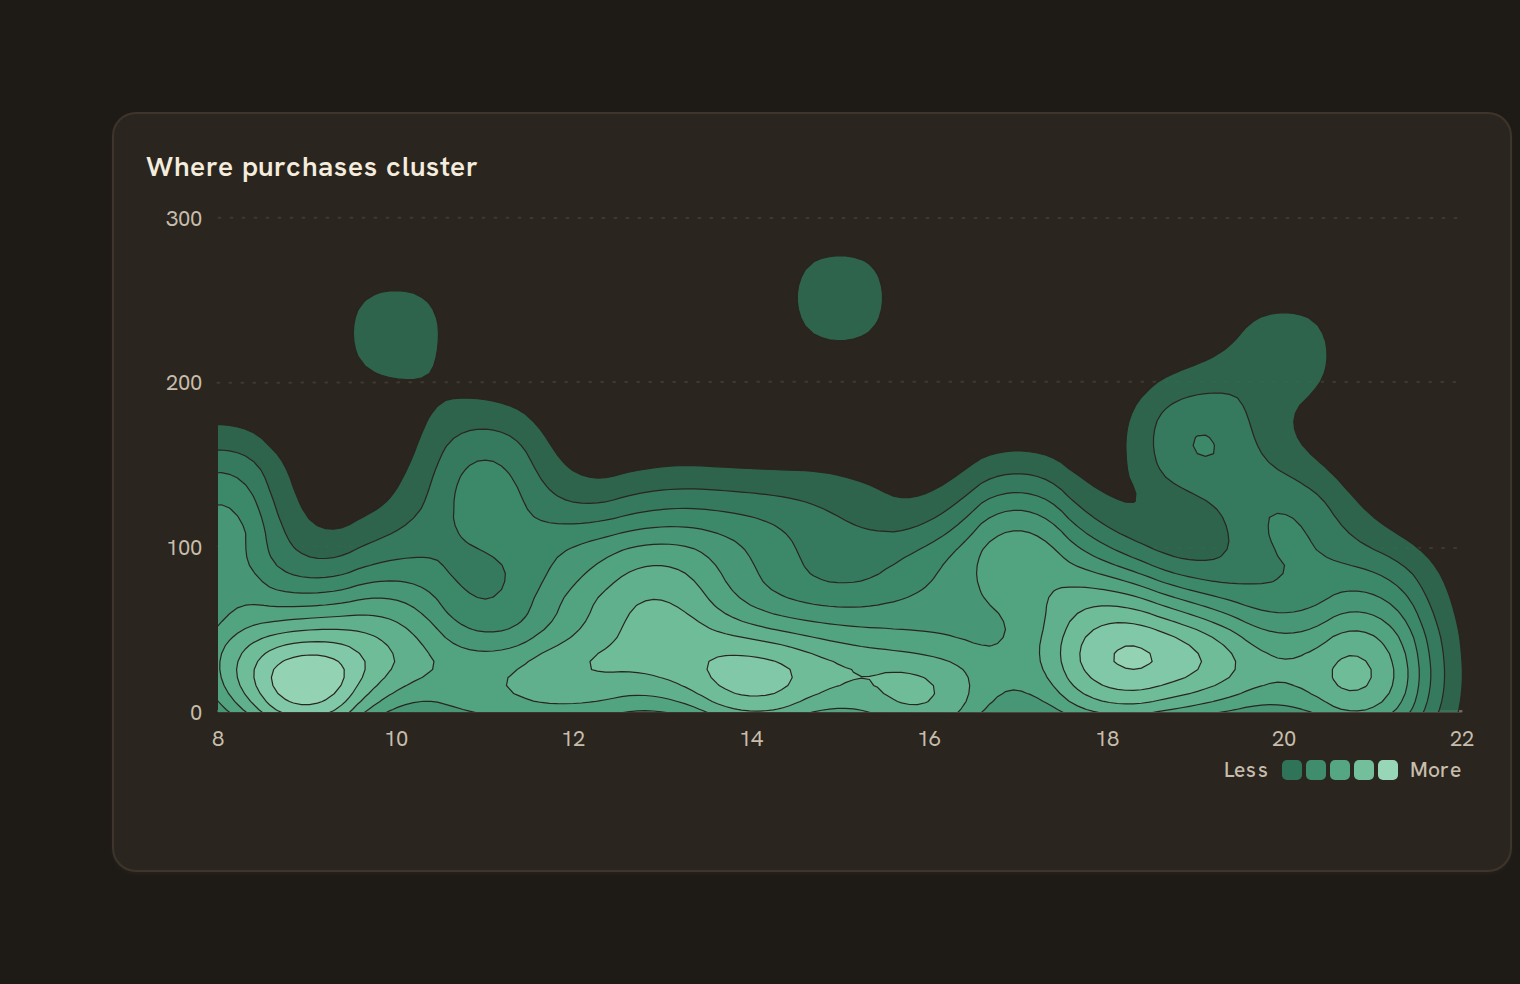 Contour2D density contours
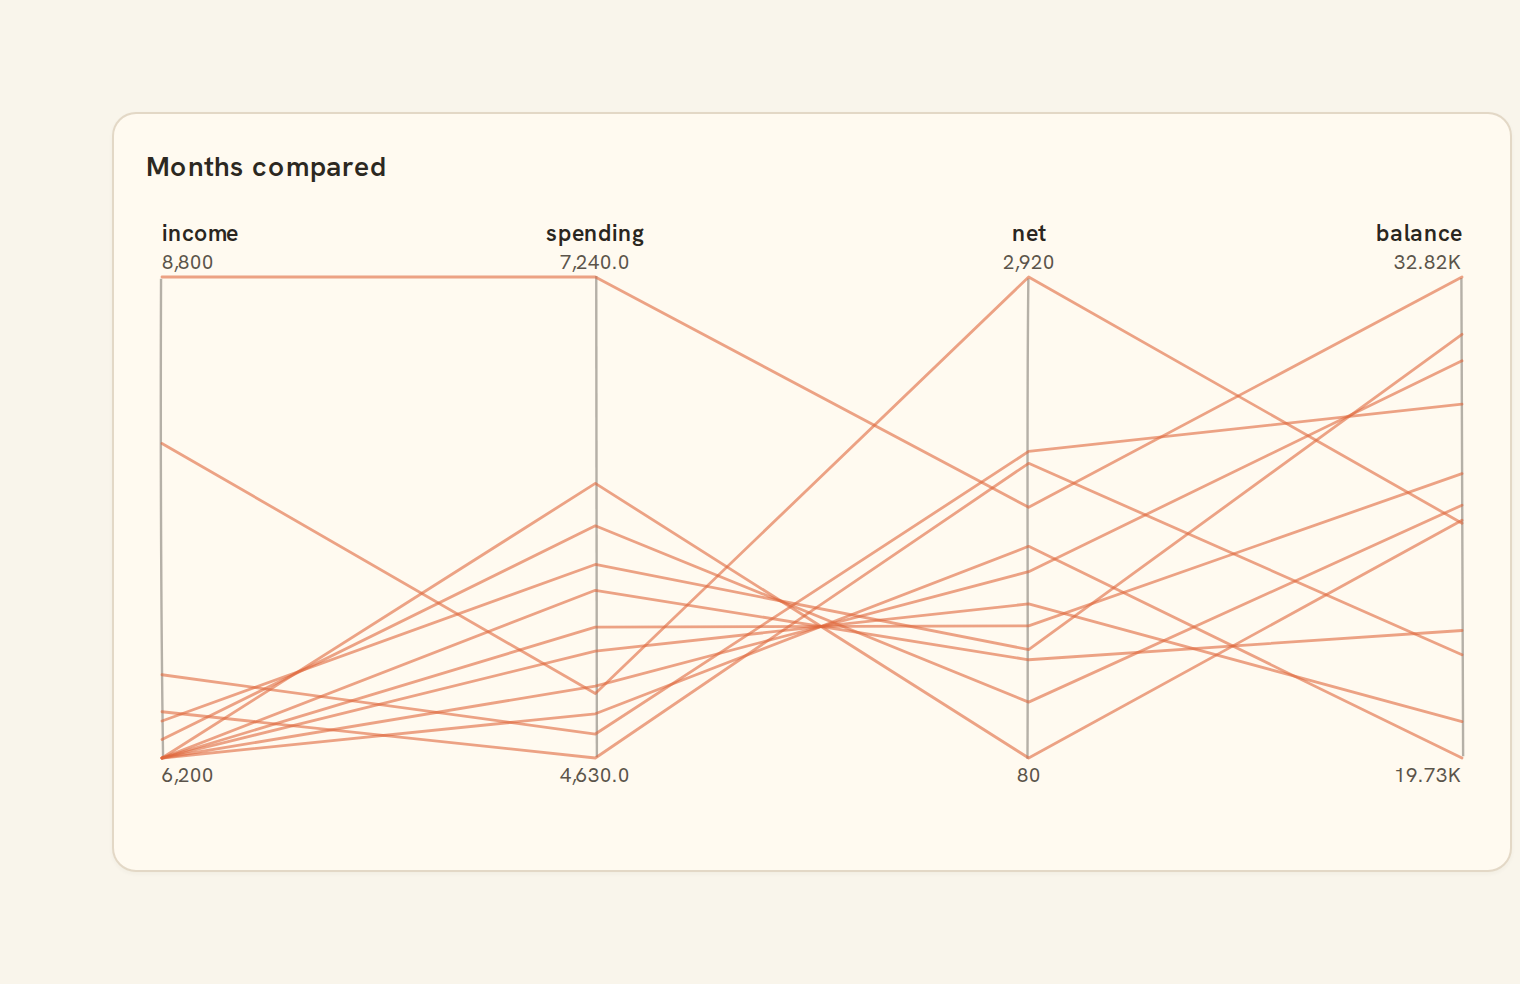
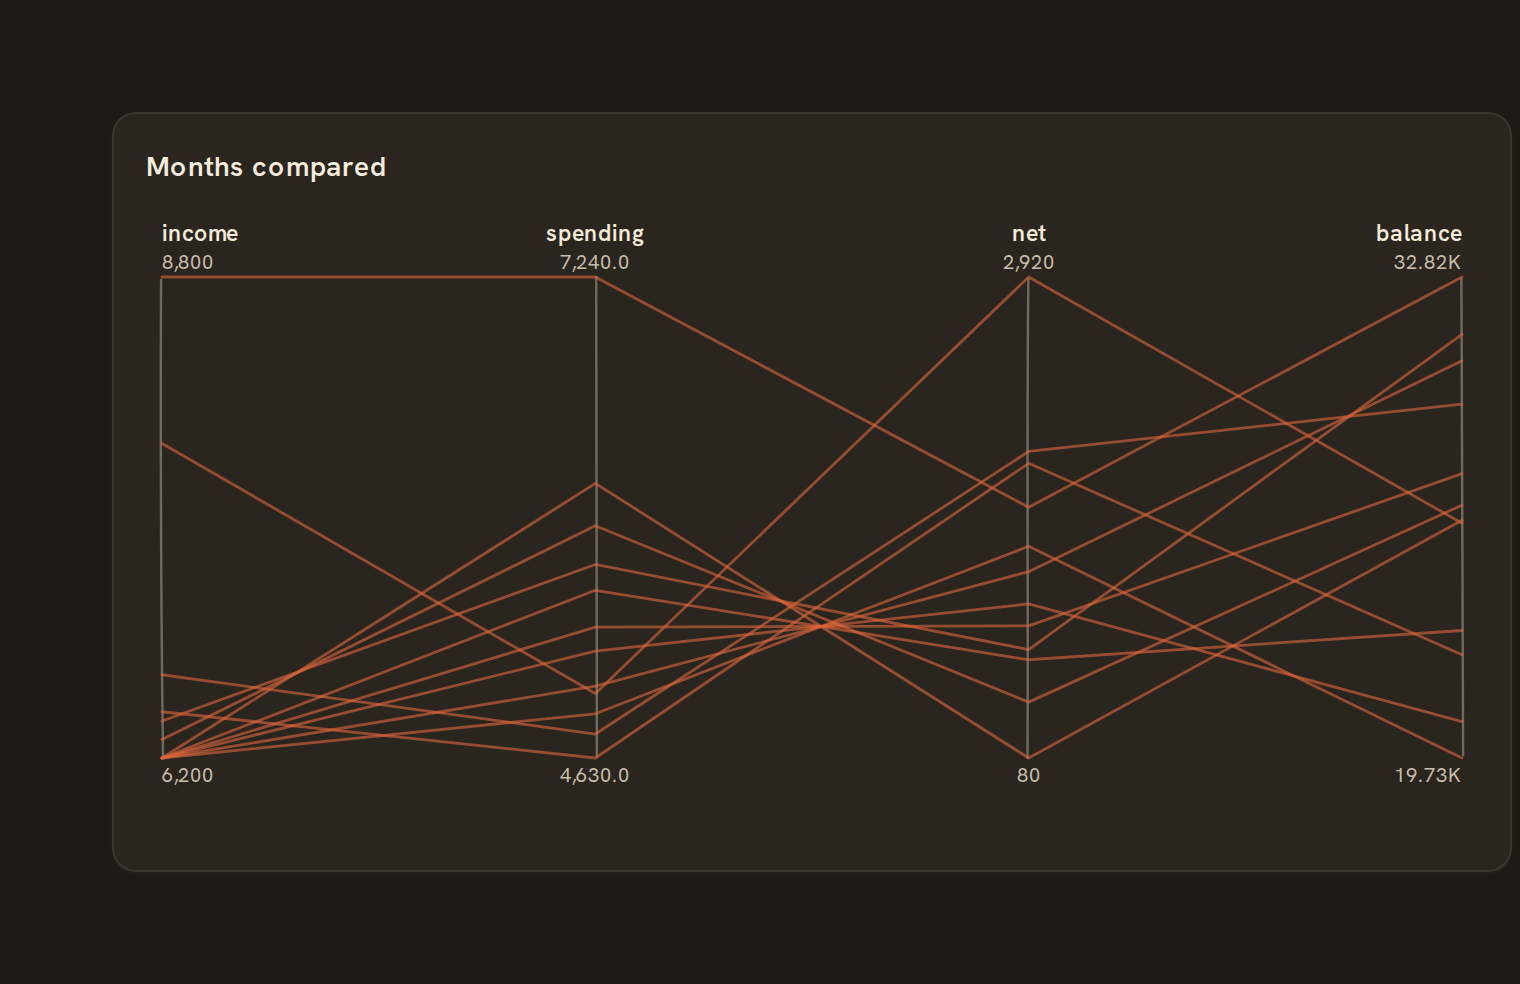 Parallel coordinatesMulti-dimensional comparison
Use this page with your AI assistant
Every BankSync doc is available as plain Markdown for agents and LLMs.