

Track spending against your budget

Explore category spending, remaining budget and the rows behind the totals.
Turn the data BankSync already syncs into dashboards you actually want to look at. Arrange widgets on desktop to build spending, cash-flow and portfolio views, then explore your saved dashboard on desktop or phone.
Explore income, outgoings, savings and connected account balances.
Preview a saved widget, edit its label, review its style, reuse it and check dependencies before removing an unused widget.
Explore spending, business cash flow, investments and savings through real widgets.
Explore category spending, remaining budget and the rows behind the totals.
Compare receipts, operating costs, reserves and account balances.
Review portfolio value, allocation and the holdings behind each view.
Inspect client income, expenses and the detail behind your monthly review.
Ask for a dashboard, review the draft and explore your savings goals.
BankSync keeps syncing transactions, balances, holdings and loans into the tools you already use. Dashboards add a place to see your connected accounts, synced feeds and BankSync Tables. Save a useful widget, reuse it across dashboards, and review the same workspace data from another angle.
Mix and match widgets on a flexible grid. Filter, group and aggregate each one independently, with no formulas and no BI tool.
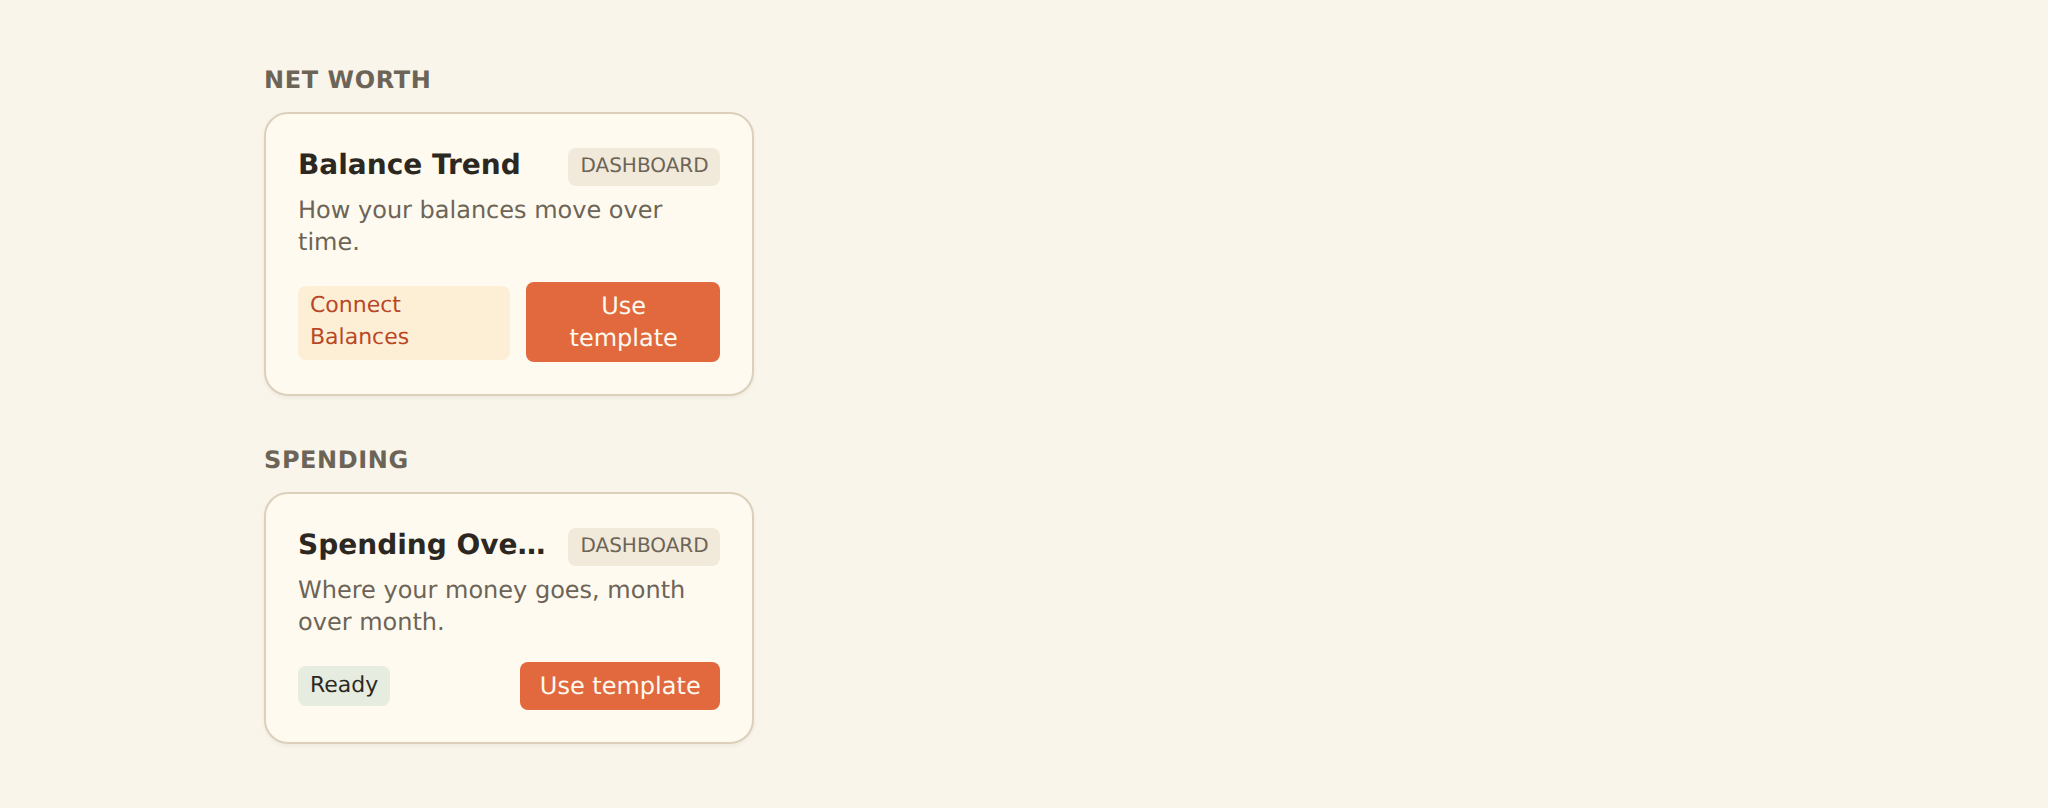
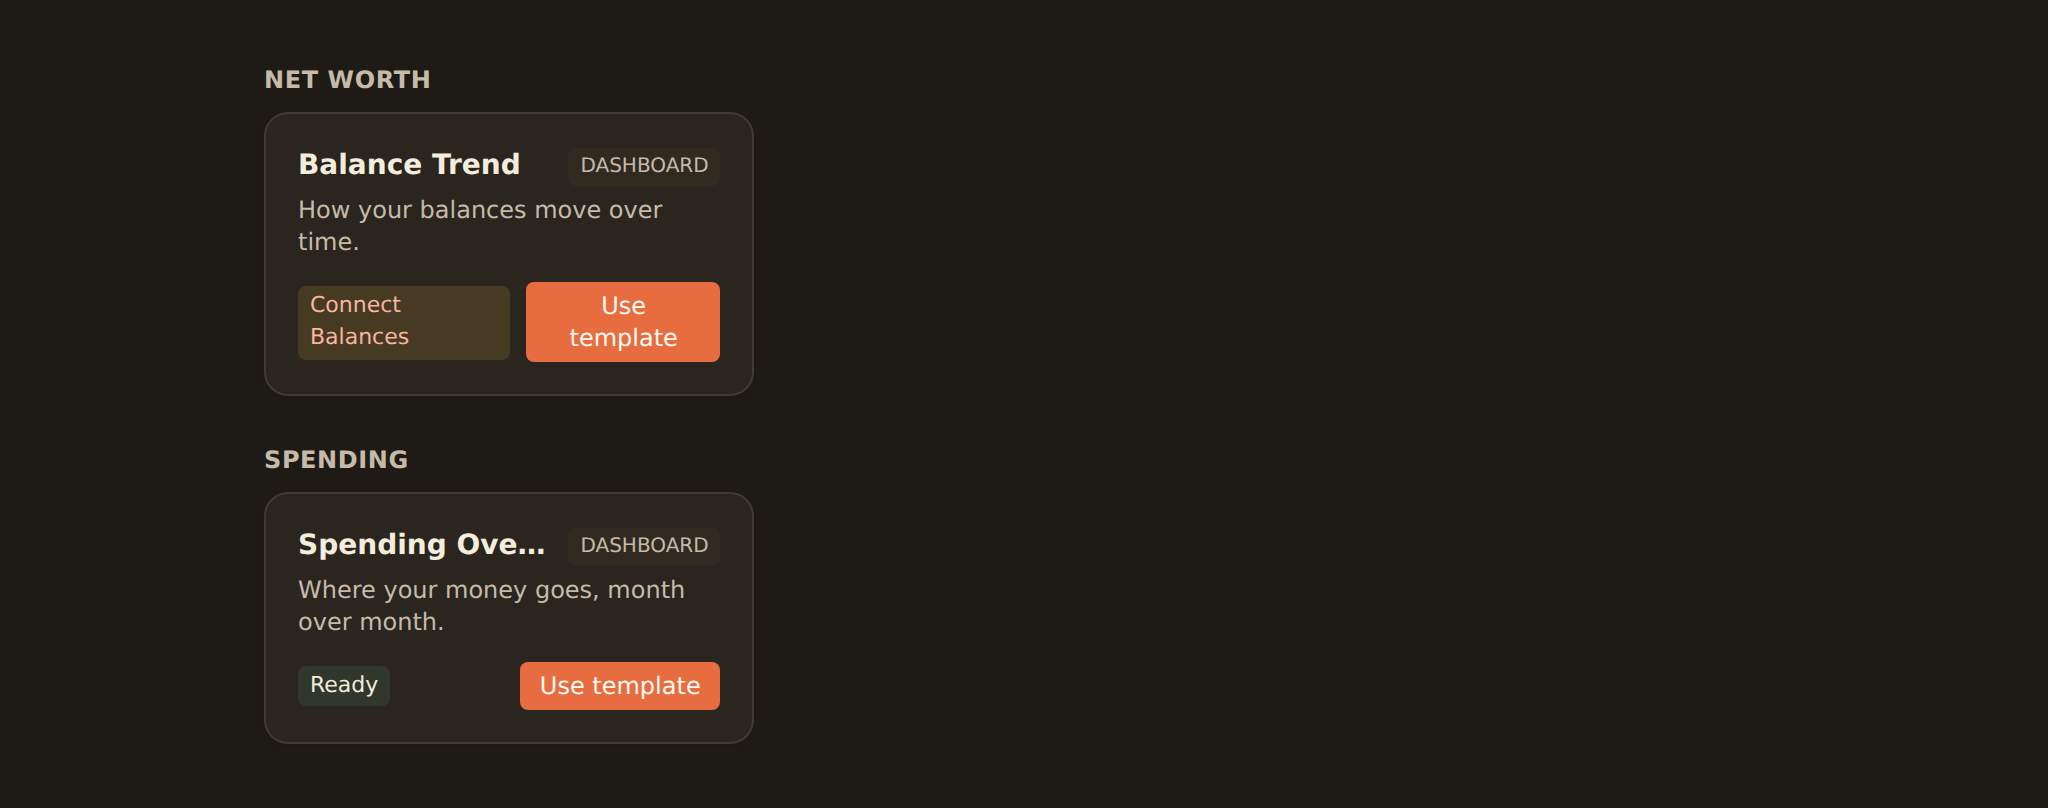
start from a template, or blank
Net worth, total balance, monthly spend, runway.
Spend by month, income by source, fees by account.
Balance over time, cash-flow runway, portfolio value.
Asset allocation, category breakdowns, account mix.
Filterable, sortable tables with only the columns you want.
Top merchants, biggest expenses, largest holdings.
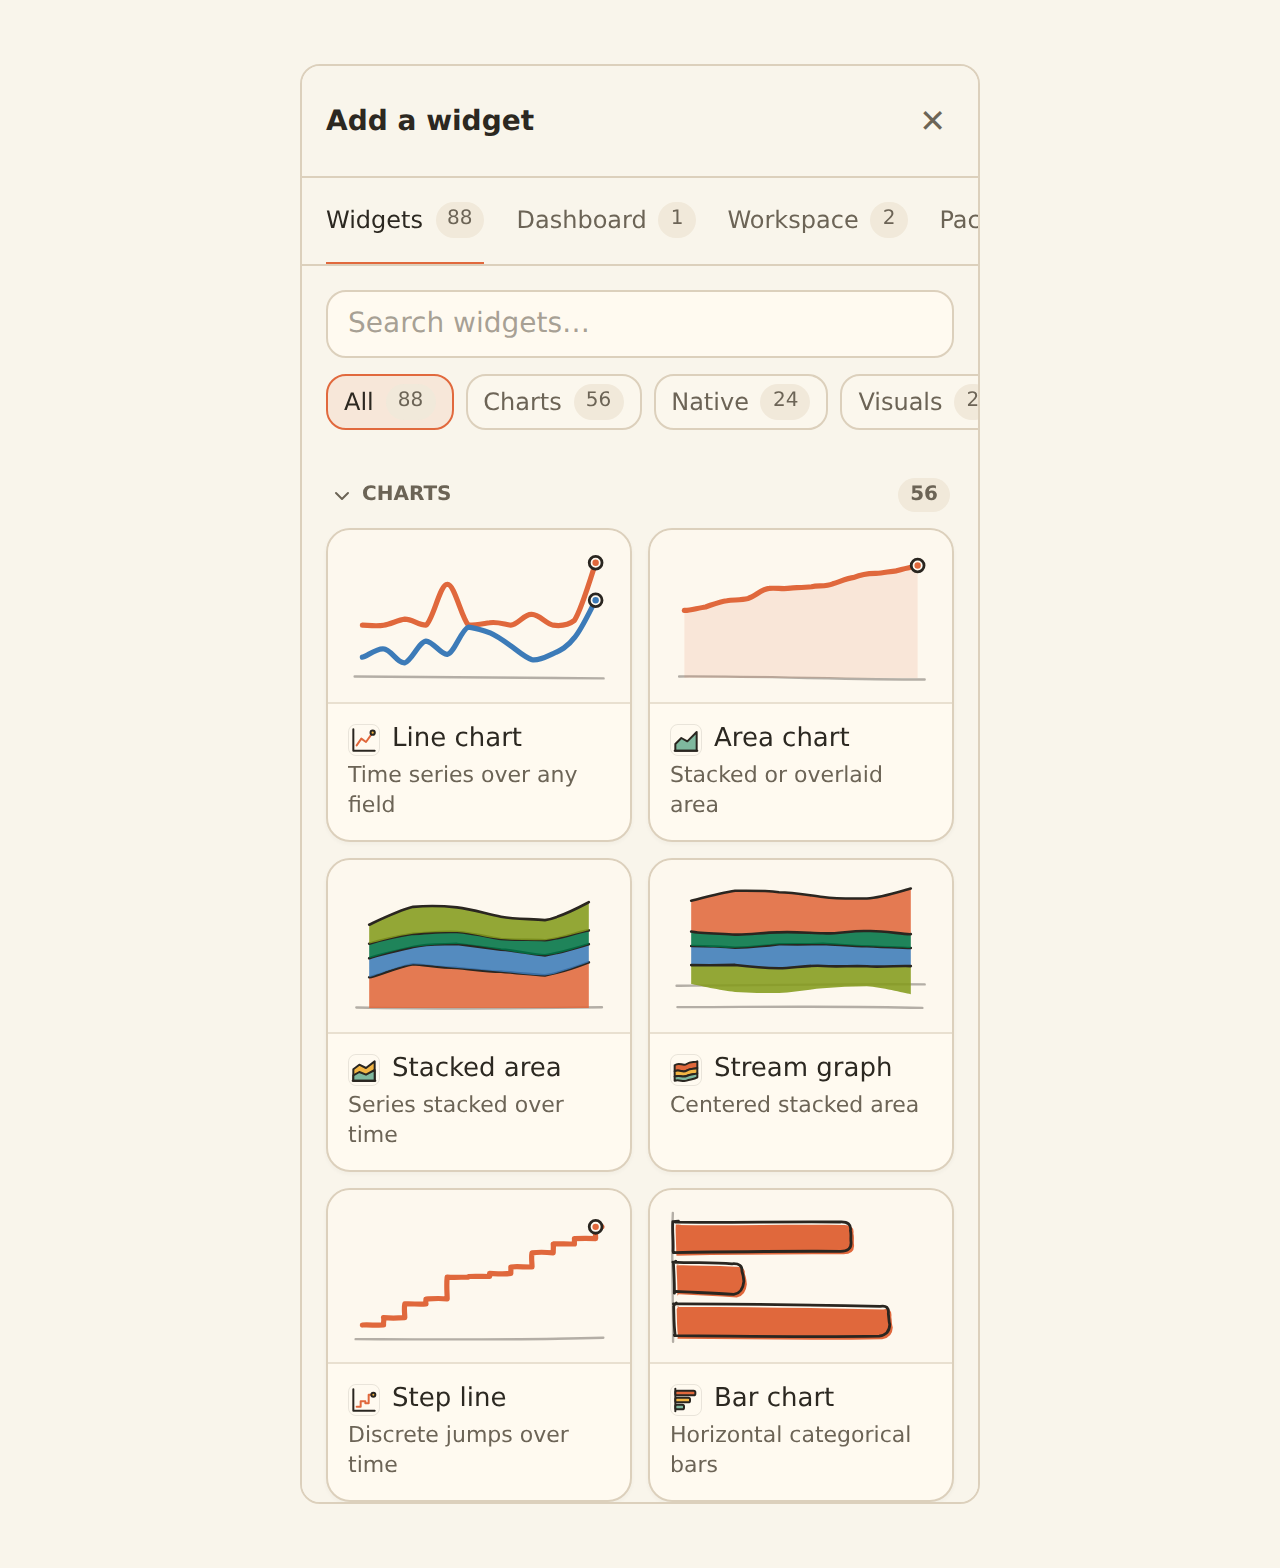
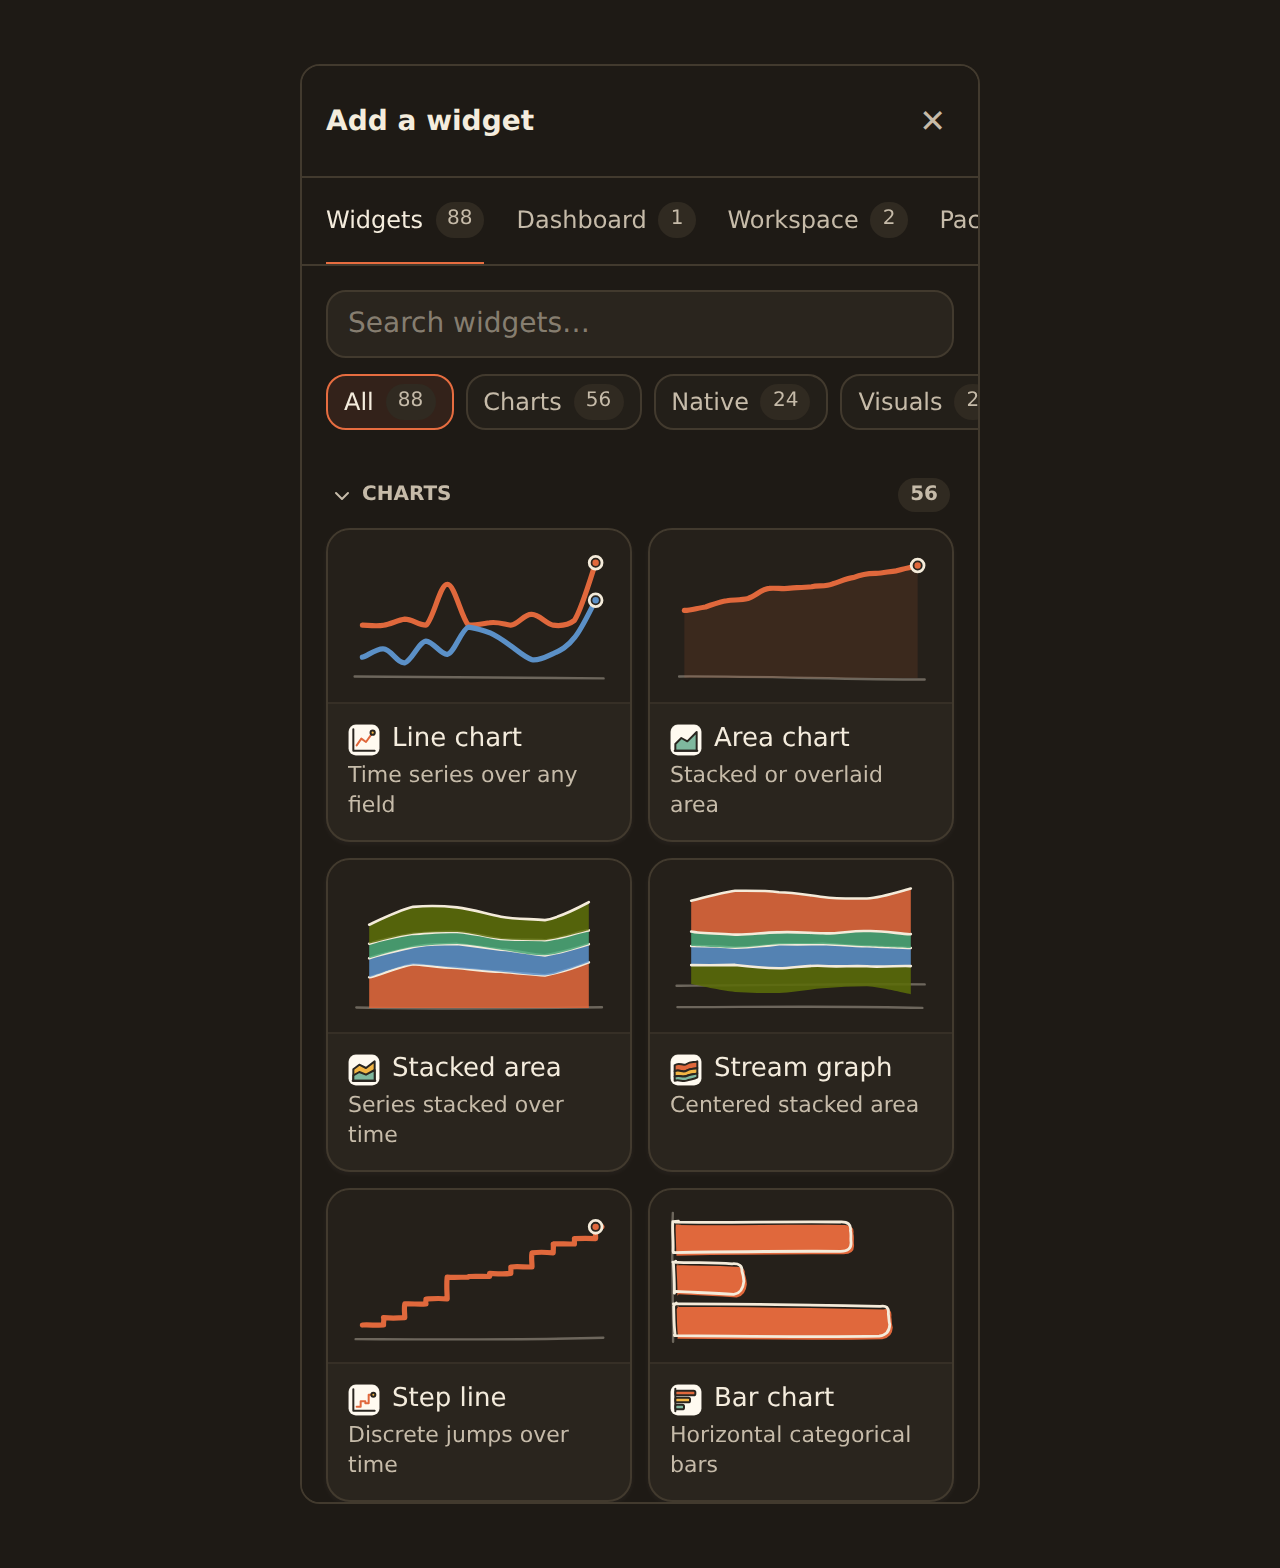
every widget, one library
Banks, brokerages and exchanges, on your schedule.


Bind each one to your data, then filter, group or aggregate.
Open your workspace dashboard and reuse saved widgets in another view.


One dataset, many command centers.
Net worth, spending, subscriptions and investments in one view.
Review receipts, operating costs and account balances together.
Place the same saved widget on another dashboard in your workspace.
Keep your destination syncs while reviewing connected data in BankSync.
Burn, runway and cash across business accounts.
Holdings, allocation and performance, refreshed on a schedule.
Tell Penny what you want to understand. Review the dashboard draft she creates from your available data, then choose Keep when it is ready.
BankSync Dashboards (Explore) bring connected accounts, synced feeds and BankSync Tables into one workspace view. On desktop, arrange KPI cards, charts and tables on a canvas. On a phone, explore the saved dashboard using its native viewer.
Use Workspace visibility so your teammates can open the dashboard in BankSync, subject to their access to its widgets and data. Public link serving and external embeds are not available in the current dashboard release.
Your destination syncs can continue alongside your dashboards. Build the dashboard in BankSync using compatible connected accounts, synced feeds or BankSync Tables, while keeping the destinations you already use.
Dashboards include KPI and stat cards, bar and column charts, trend and area charts, allocation and donut charts, ranked lists and leaderboards, and filterable tables with saved views. Each widget can be filtered, grouped and aggregated independently.
Widgets show data from their configured sources. Bank feeds can sync on a schedule or on demand, so freshness depends on the source and its latest successful sync.
Choose a compatible connected bank account scope, synced feed or BankSync Table. The source picker checks the fields each widget needs, and its Data tab lets you configure the supported fields, grouping and aggregation.
Yes. Open a saved widget, review its Preview, then choose Add to dashboard. Its Dependencies tab shows where it is used. Changes to the saved widget apply wherever it is reused; dashboard-local edits have their own copy behavior.
Yes. Ask Penny to build a dashboard from your available data, review the draft, then Keep it when you are ready. You can also add and arrange widgets manually with the desktop editor.
Connect your accounts, choose useful widgets and build your workspace view. Explore the saved dashboard on desktop or phone.


