Dashboard Filters & Cross-Filtering
Add dashboard-wide controls like a date range so every widget narrows at once, choose where the filter applies, lock data per viewer, and wire a chart click to cross-filter the rest.
7 min read
On this page
A dashboard filter is a control that narrows every widget at once: pick a date range, a category, or an account, and the whole dashboard responds. By default a filter is applied where the data is read, so the numbers stay correct, not just hidden on the screen (you can change where a filter applies, and you can lock data per viewer; both are covered below).
Adding a filter#
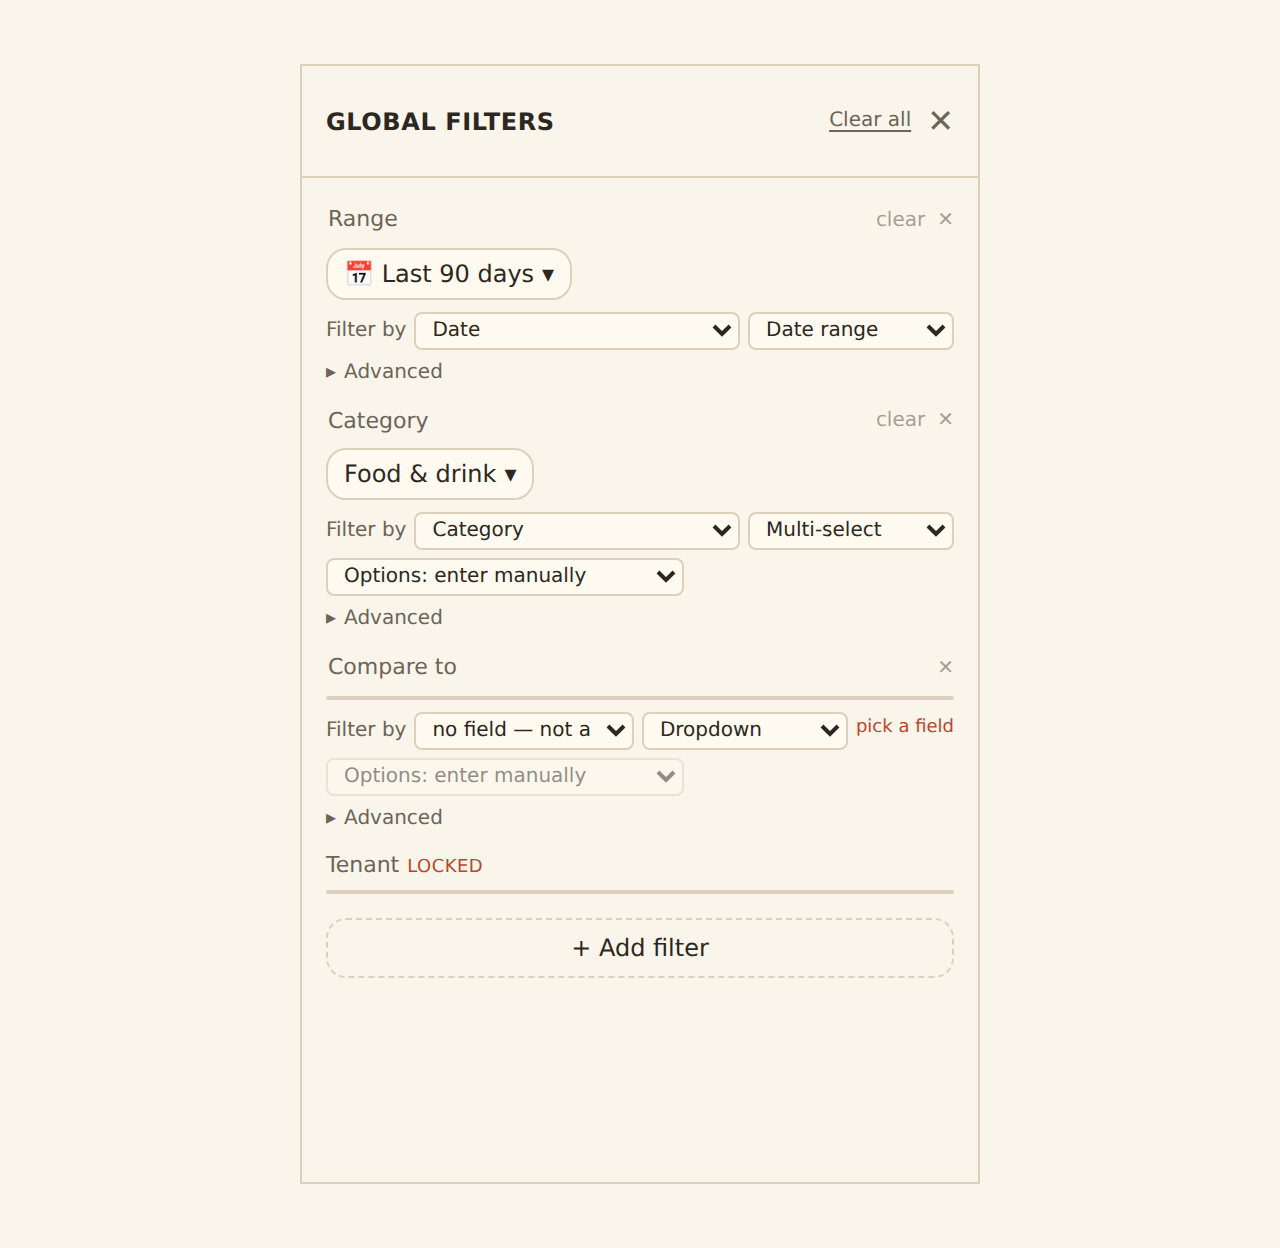
Open the Filters panel and add a filter. You choose the column it targets from your feed's fields (the picker offers real columns, so there is nothing to type or spell wrong) and the control type that fits it.
Author a filter
Open Filters
Open the Filters panel from the dashboard toolbar.Pick a target column
Choose the field to filter on from the list of your feed's columns. This step is not optional: a filter with no target column does nothing (more on that below).
Choose a control type
Pick how viewers set it (a date range, a dropdown, a search box, a slider).
Choose an operator
Decide how the value is matched. Each control type starts on a sensible default (a text search defaults to "contains", a date or number range to "between", a multi-select to "is any of"), and you can change it in the row's operator select (for a text column you can switch between contains, starts with, or exactly equals).
Choose where it applies
Pick the apply plane (see "Where a filter is applied" below). The default is fine for almost everyone.
Set a default
Optionally set a default value so the dashboard opens pre-filtered, and pin the control to the header bar if you want it always visible.
A filter with no target column does nothing
Worked example: a pinned Last-90-days date filter
Control types#
Date range
Pick a from/to range, with quick presets. The most common filter.
Single-select
Pick exactly one value. Renders as a row of segmented buttons, so the choices are all visible at once.
Multi-select
Pick several values at once. Renders as a checkbox dropdown, better for long option lists.
Search
Type to match a text column. Defaults to "contains" matching; you can switch it to "starts with" or "exactly equals".
Number range
A slider for an amount or numeric range.
Toggle
An on/off switch for a yes/no column.
Static or live options
Pick from a fixed list you define, or let the options fill in from the data.
Set the slider bounds on a Number range




A Number range filter renders as a slider with a draggable low and high handle, so a viewer drags the band to set, for example, a minimum and maximum transaction amount. A Toggle filter renders as a single on/off switch for a yes/no column.
Pinned filters vs filter widgets#
A filter can live in two places. A pinned filter shows in the dashboard's header bar, always visible above the widgets. Alternatively, you can add a filter control widget that sits on the grid like any other widget, handy for laying controls out alongside the charts they affect. Both drive the same dashboard filter: a control widget is just a second face for a filter you already authored, bound to it by its id, so changing either one moves the same value.
When you add a filter control widget to the grid, its inspector binds the widget to an existing dashboard filter by that filter's id, which is how the two faces stay in sync: change the value on either the pinned header control or the on-grid widget and the shared filter moves.
Where a filter is applied#
Every filter is applied in one of two places, and the Filters panel lets you choose per filter:
At the source (server)
The data is read with the filter already applied, so aggregates recompute and viewers cannot bypass it. This is the default, and it is required for the row-level security filters described below.
In the browser (client)
The filter is applied after the data is fetched, which feels instant and is captured in the page URL. Best for quick, low-sensitivity narrowing where re-reading from the source would be overkill.
Unless you change it, a filter is set to apply at the source. That is the safe choice, and it is why the numbers stay correct (see the callout below). You only need the browser plane when you want the snappiest possible response on a non-sensitive filter.
Source-applied filters keep aggregates correct
Lock data per viewer (row-level security)#
A filter can be a row-level security filter: instead of letting the viewer choose a value, it binds to who the viewer is and locks the data to them. For example, a filter on portal_client_id can pin a shared client portal so each client only ever sees their own rows.
Security filters behave differently from ordinary filters on purpose:
- They are always applied at the source, so they cannot be bypassed.
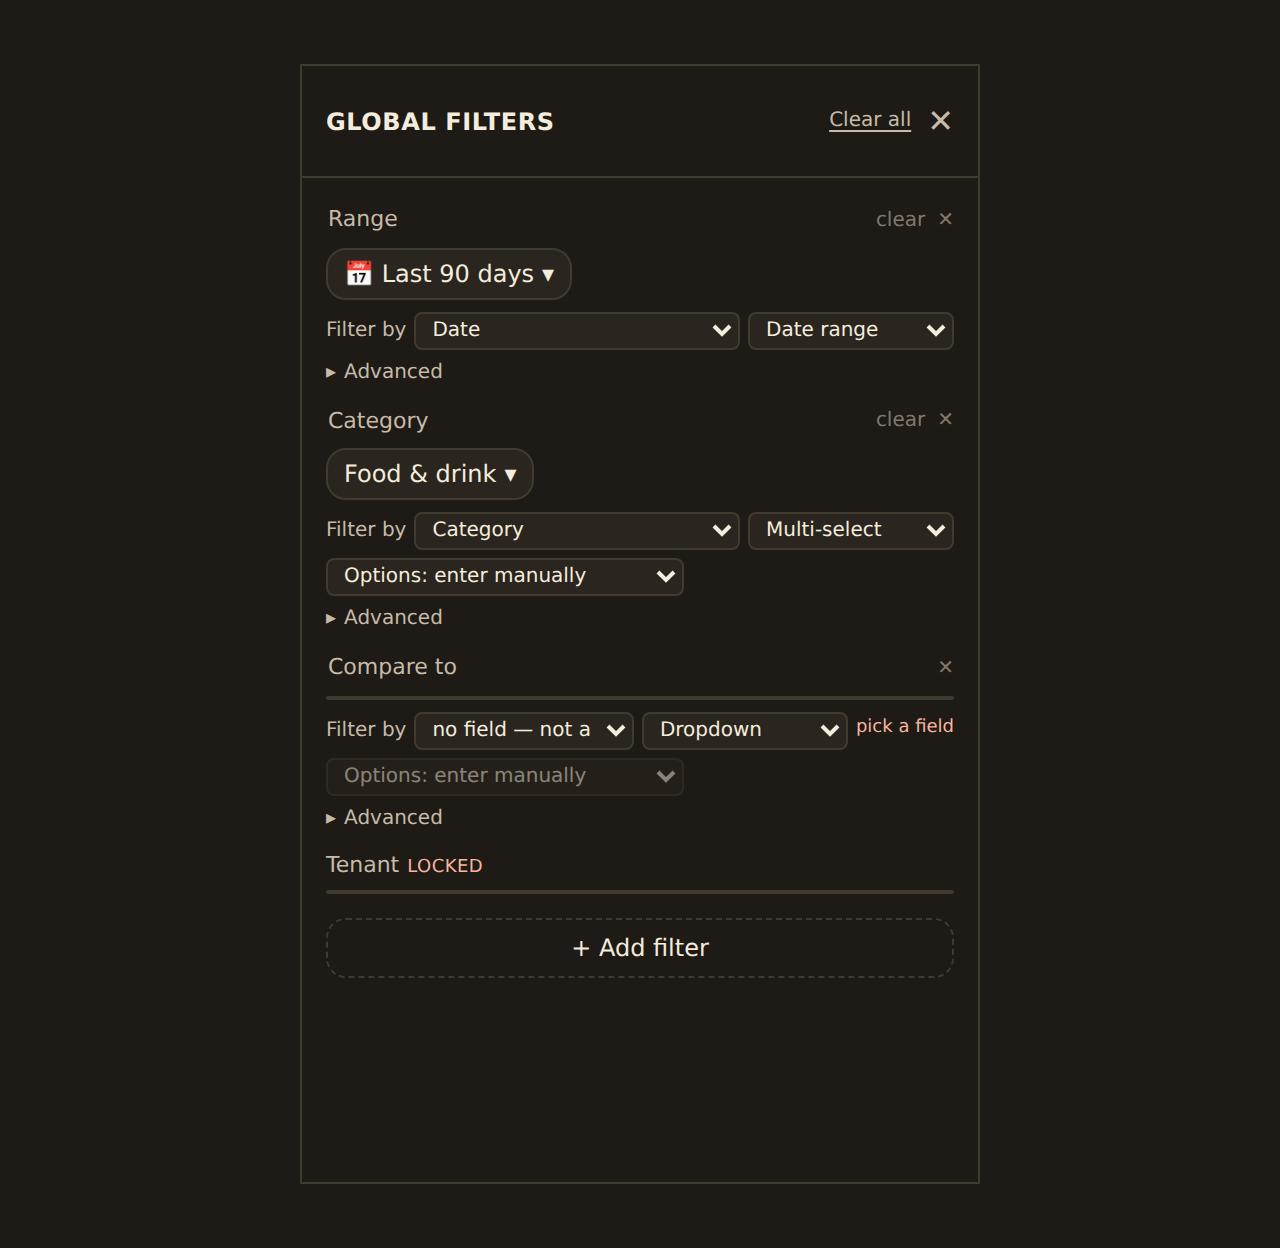
- A viewer cannot remove, change, or widen them, and they show as locked in the Filters panel (that is the locked row in the screenshot above).
- They bind to an identity claim (such as the signed-in member or the portal client) read from the verified session or embed token, not to a value the viewer types.
- They fail closed: if one is misconfigured, the dashboard returns no rows rather than leaking everything. A published snapshot will not even mint with a live security filter unless the data was already pre-filtered when it was published.
Use a security filter whenever the same dashboard is shared with multiple people who must each see only their own slice. For everyday narrowing, the ordinary control types above are what you want.
Cross-filtering: click a bar to focus#
Cross-filtering lets a click on a chart narrow the rest of the dashboard: click a bar and every other widget refocuses on that value. It is powerful, but unlike the controls above it is not automatic. An author has to turn it on for a specific chart, and there are a few limits worth knowing before you rely on it.
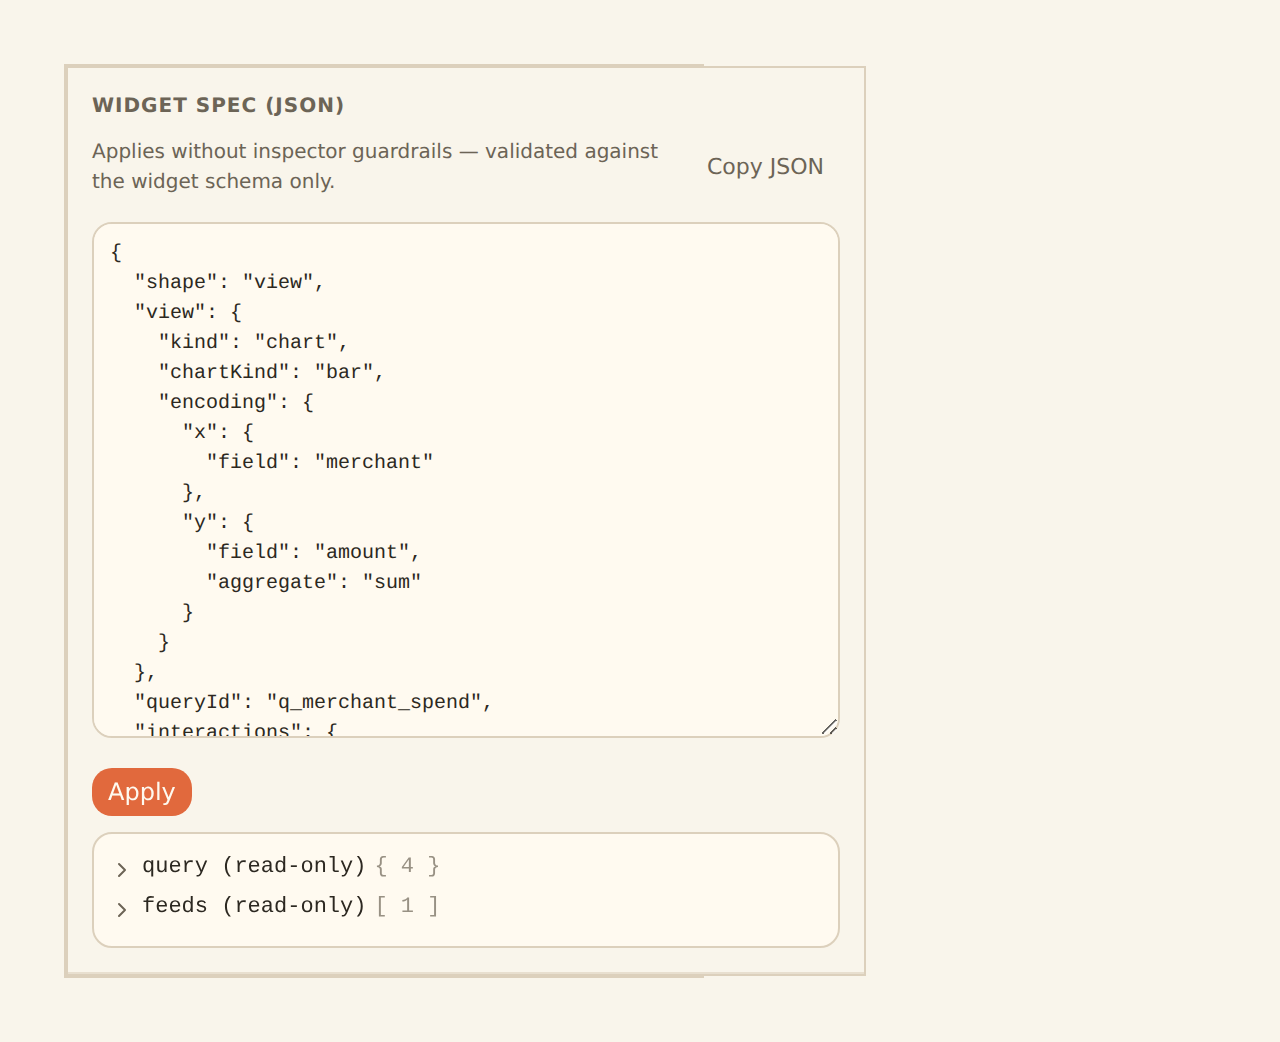
- It has to be wired up per chart. A chart does nothing on click until cross-filtering is enabled on it and pointed at which dashboard filter to drive and which field's value to send. There is no point-and-click toggle for this in the app yet; it is set on the widget's configuration (today via the widget spec or an AI agent through MCP), so most charts will simply not respond to clicks until someone sets it up.
- Bar and column charts only, for now. Clicking emits a value only from bar and column charts. Pie and donut slices, lines, and other kinds do not emit a cross-filter yet, even when cross-filtering is enabled, so "click a slice" will not work.
- Clicking does not toggle off. A click sets the filter to the clicked value; clicking the same bar again just re-sets the same value rather than clearing it. To clear a cross-filter, clear the underlying filter from its control (for example reset the pinned filter in the header).
When it is set up, cross-filtering is a fast way to drill in: on a spending-by-category bar chart with cross-filtering enabled, clicking the "Travel" bar narrows every other widget on the dashboard to Travel, so a single click answers "what does the rest of the picture look like for just this category?".
Removing a filter
A filtered view is shareable
Related guides#
- Binding data: the columns a filter can target come from the widget's feed.
- Adding widgets: add a filter control as a widget.
- Publishing & sharing: filters travel with a published dashboard.
Start from a template
Use this page with your AI assistant
Every BankSync doc is available as plain Markdown for agents and LLMs.