Shaping Data
Use the Shape data pipeline to filter, summarize, sort, compute, and join feeds before a chart draws, plus reuse the result as a query other widgets share.
11 min read
On this page
- Where shaping happens in the data path
- The source: where the rows come from
- The steps
- Filter
- Summarize
- Sort and Limit
- Compute
- Joining feeds
- When a join multiplies your rows
- Building reports in layers (derived queries)
- Saving a shape as a reusable query
- The instant in-browser pass
- Avoiding double counting
- A worked example: top 5 categories this year
- When a widget comes up empty
- For power users and agents
- Related guides
Most widgets need nothing more than the everyday channel controls covered in Binding data: pick a feed, choose what goes on each axis, pick an aggregate. Shape data is the next layer up. It is a small step-by-step pipeline you open from the inspector's Data tab when one feed and the basic channels are not enough: when you want to drop rows before charting, total them at the data level, combine two feeds into one, or compute a brand-new column.
This page explains every step in that pipeline, what each one does, the order they run in, and how shaping interacts with the chart's own controls so your numbers stay correct.
A few plain-language terms used throughout:
- A row is one record from a feed: one transaction, one balance snapshot, one holding.
- A column (or field) is one piece of each row: its date, amount, category, account.
- To summarize (also called aggregate) means to collapse many rows into one number per group: all of January's transactions into a single January total.
- A query is a saved, reusable pull from your data: a source plus a shape pipeline, given a name, that more than one widget can share.
Where shaping happens in the data path#
It helps to know the order things run, because it explains why some controls live in Shape data and others on the chart.
- Read the source: one feed, several feeds combined, a live bank, a fixed table you typed in, or another saved query.
- Shape the rows on the server: the Shape data pipeline (filter, summarize, sort, compute, join, and more). This runs once and the result is cached, so widgets that share it are fast.
- Re-shape in your browser (optional): a tiny post-cache pass that re-filters or re-sorts the already-loaded rows instantly, with no server round-trip.
- Draw: the chart applies its own channels (Group by, Value, the aggregate on the Value chip) to whatever rows arrived.
The big lever is step 2 versus step 4. If you total amounts in Shape data and the chart's Value chip also sums them, you have summarized twice. BankSync catches this and warns you (see Avoiding double counting below).
The source: where the rows come from#
Before any shaping, a query reads from exactly one source. The source can be more than a single feed:
| Source kind | What it reads | When to reach for it |
|---|---|---|
| One feed | A single synced feed (your Transactions, Balances, Holdings, and so on). | The everyday case. |
| Live bank | Reads straight from the connected bank instead of a synced copy. | When you want the freshest possible numbers for a supported data type (transactions, balances, holdings, trades, orders, loans). |
| Combined feeds | Two or more feeds stacked or joined together. | Cross-feed reports (trades against holdings, balances against transactions). |
| A fixed table | A small reference table you type in (thresholds, targets, labels). | Reference values that do not come from a bank, like a savings goal or a budget line. |
| Another query | The rows of an already-saved query, with more steps on top. | Building a report in layers, where one query feeds the next. |
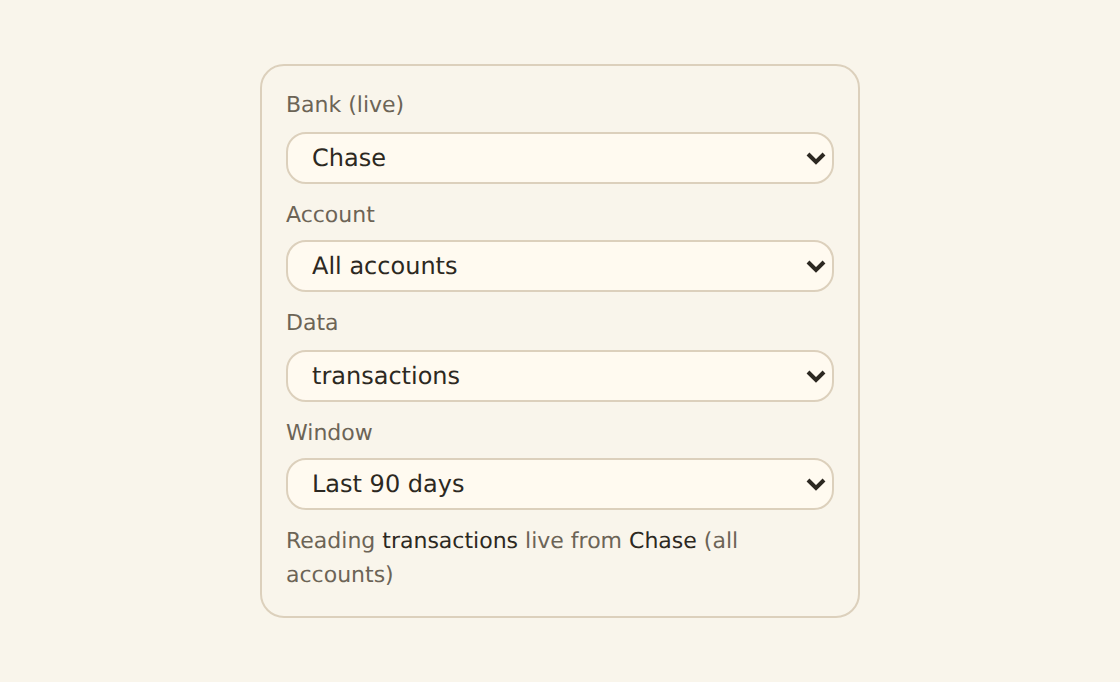
Live bank reads cover a fixed set of data types
The steps#
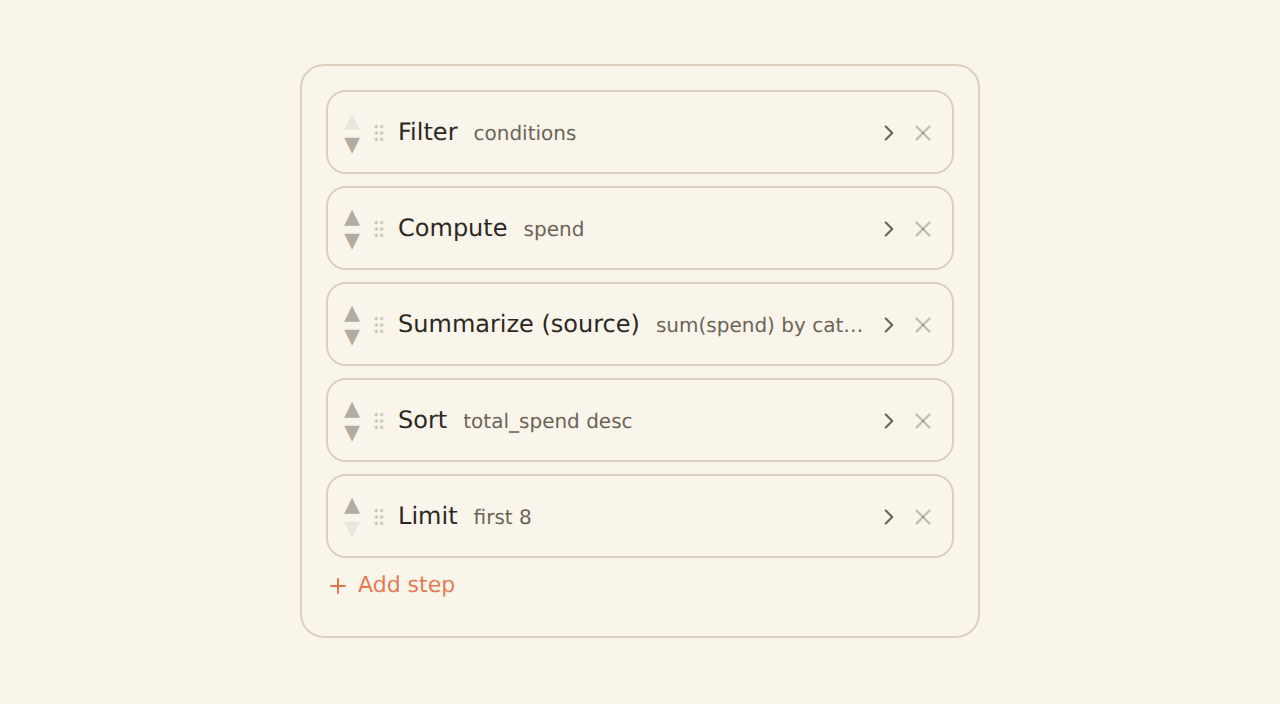
Shape data is an ordered list. Each step takes the rows produced so far and hands its output to the next. You can reorder steps, and order matters: filtering before summarizing changes which rows get totaled; computing a column after summarizing operates on the summary rows, not the originals.
Filter#
Drop rows you do not want before anything else looks at them: only this year, only one category, only amounts over a threshold. Filtering early is almost always right, because every later step then does less work on fewer rows.
Summarize#
This is the heart of the pipeline. Summarize groups rows by one or more columns and produces a number per group. You choose the grouping columns (Category, Month, Account) and one or more measures, each with how to combine it:
| Combine by | Result |
|---|---|
| Sum | The total (right for flows like spending or fees). |
| Average | The mean. |
| Count / Count distinct | How many rows, or how many distinct values. |
| Min / Max / Median | The smallest, largest, or middle value. |
| First / Last | The earliest or latest value in each group (Last is the right choice for balances). |
| Percentiles (p25 through p99), Std dev, Variance | Distribution measures for analysis. |
| Collect into a list | Gathers the group's values into one cell (powers in-row sparklines and tag chips). |
Each measure can carry its own filter, so you can total only the rows that match a condition within a single summarize step (for example, sum amount only where the category is Travel) alongside an unfiltered total.
Sort and Limit#
Sort orders the rows by one or more columns, ascending or descending. Limit keeps the first N (with an optional offset to skip a few). Together they answer "top 10 merchants by spend": summarize by merchant, sort by total descending, limit to 10.
Compute#
Compute (derive) adds a new column from an expression. This is the one place the everyday "no formulas" rule does not apply: you write a small formula, like amount * 1.1 or income - expenses, and it becomes a new column on every row. Chained computes can reference the columns earlier computes added.
There are also more advanced reshape steps for analysis work, available in the same pipeline:
| Step | What it does |
|---|---|
| Window | Running totals, moving averages, lag/lead, and ranking within a group. |
| Pivot / Unpivot | Spread one column out into many, or fold many columns into one. |
| Bin / Bucketize | Group a number into equal-width bins, or into labeled ranges (Small / Medium / Large). |
| Fill / Resample | Carry a sparse value forward across gaps, or place a series on a regular daily/weekly/monthly grid. |
| Normalize | Restate a number as a z-score, a 0-to-1 scale, a share of the group total, or an index to 100. |
| Unnest | Explode an array column (like receipt line items) into one row each. |
| Sample | Keep the head, tail, or a random sample of rows. |
You will not need most of these day to day, but they are there when a report calls for them.
Joining feeds#
A join combines two or more feeds into one source so a single widget can chart across them. Open Shape data, add a Join, and pick the feeds. There are two ways to combine:
- Stack (concat): put all the rows from each feed on top of each other into one longer table. Use it when the feeds have the same shape and you want them treated as one (an optional tag column marks which feed each row came from).
- Join on a key: match rows across feeds that share a value, like an account or a symbol. You choose how unmatched rows are handled:
| Join type | Keeps |
|---|---|
| Inner | Only rows that match on both sides. |
| Left | Every row from the first feed, plus matches from the second (unmatched second-side columns come up empty). |
| Full | Every row from both sides, matched where possible. |
There is no "right" join: to keep every row from the second feed instead, reorder the feeds and use Left.
You usually pick fields, not join keys
Account and bank columns are already on every row
When a join multiplies your rows#
Joining on a key that is not unique can quietly multiply rows. If each account has 50 transactions and you join balances to transactions on the account, every balance row matches 50 transaction rows, so the total row count balloons. If a join expands the row count by more than two times, the widget shows a multiplicity warning so you can catch an accidental fan-out before it skews a total. If you see it, check that you are joining on the column you meant, or summarize one side first so the key is unique.
Building reports in layers (derived queries)#
A query can read from another query. The upstream query produces rows; your query takes those rows and applies more steps on top. This lets you build a report in layers: one query does the heavy summarize once, and several downstream queries (or widgets) slice it differently without re-doing the work.
To keep this safe and fast, BankSync enforces two rules when you save:
- No loops. A query cannot end up depending on itself, even indirectly. If query A reads from B and B reads from A, the save is rejected with the exact chain that caused it.
- A depth limit. A chain of query-reads-query can be at most eight levels deep. If you hit it, the fix is to flatten the chain by summarizing further upstream.
These checks run the moment you save, not at view time, so a broken chain can never slow down or break a live dashboard.
Saving a shape as a reusable query#
A shaped pipeline can be saved as a named query: a reusable, workspace-level building block. Two widgets pointing at the same query share one fetch and one run of the pipeline, which keeps a dashboard fast and keeps a number defined in exactly one place. Give it a name and a short slug, and it shows up as a source other widgets can pick.
Queries can also read at two scopes:
- Workspace: just this workspace's data (the default).
- Family: rolls up across the child workspaces of a client portal, for users who manage several clients under one parent. (See Publishing and sharing for how shared dashboards relate to this.)
The instant in-browser pass#
Some shaping does not need the server at all. After the cached result arrives, your browser can run a small extra pass to filter, compute, sort, or limit the rows it already has, and the chart redraws instantly with no round-trip. This is what makes a dashboard filter feel immediate: narrowing to one category re-runs this in-browser pass rather than re-querying.
The in-browser pass deliberately cannot summarize, pivot, or window, because those need the full set of rows that lives on the server. So the rule of thumb is: totals and groupings happen on the server in Shape data; quick narrowing and reordering can happen in your browser. You do not choose between them by hand; BankSync places each step where it belongs.
Avoiding double counting#
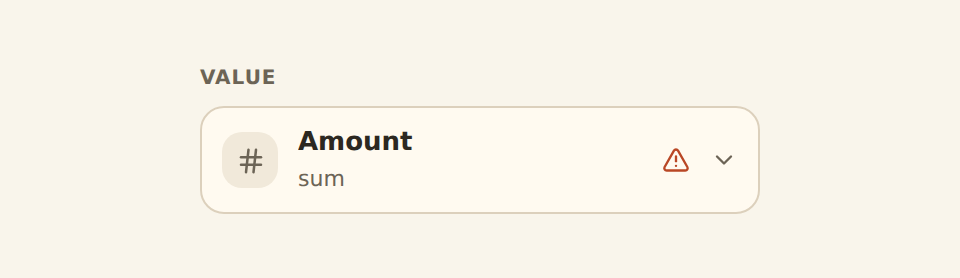
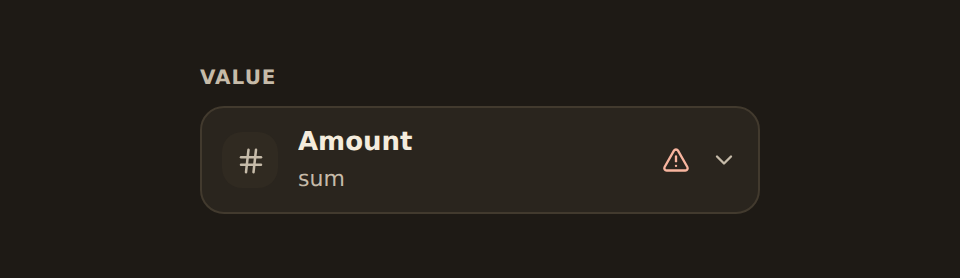
This is the one trap worth internalizing. If you Summarize in Shape data (a data-level total) and then the chart's Value chip also sums that already-totaled column, you sum twice and the number is wrong.
BankSync detects this. When a Value chip would re-sum a column that Shape data already summarized, the chip shows an amber warning that reads "Already aggregated in Shape data," with a one-tap Set to None action that tells the chart to show the already-summarized number as-is. Trust the warning: it exists to stop a wrong total.
A worked example: top 5 categories this year#
Putting the steps together, here is how to build "my five biggest spending categories this year" with Shape data:
Top 5 categories this year
Source
Pick your Transactions feed as the source.Filter
Add a Filter step: keep only rows where the date is in this year.Summarize
Add a Summarize step: group by Category, and total Amount with Sum.Sort
Add a Sort step: order by the total, descending.Limit
Add a Limit step: keep the first 5.Chart it
Because Shape data already summed, set the chart's Value chip aggregate to None (or accept the double-count warning's one-tap fix) so it shows your five totals as-is.
The result is a clean five-bar (or five-slice) chart, and you can save the pipeline as a query named "Top categories" to reuse on other widgets.
When a widget comes up empty#
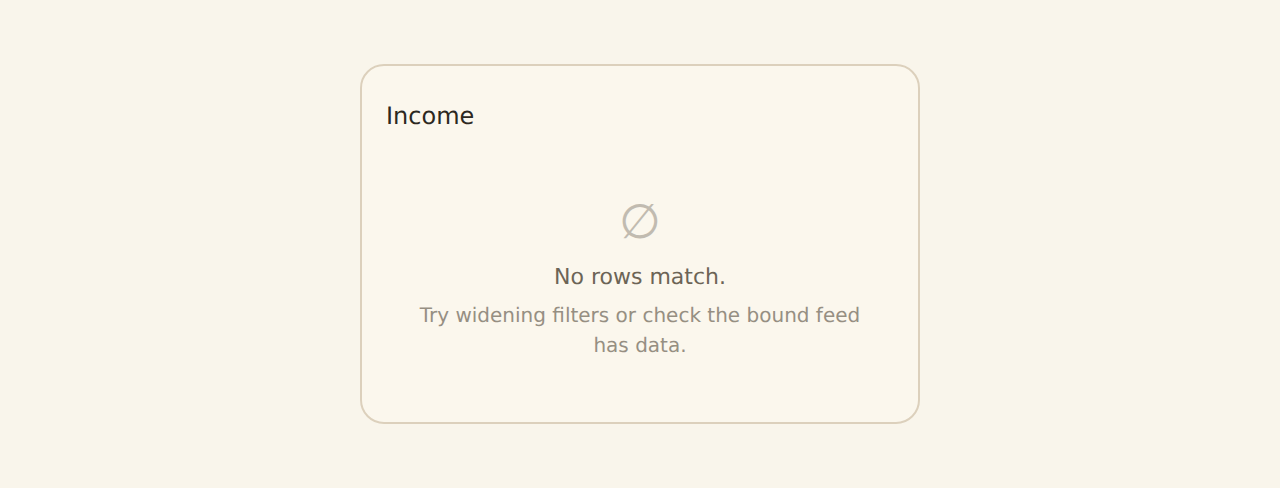
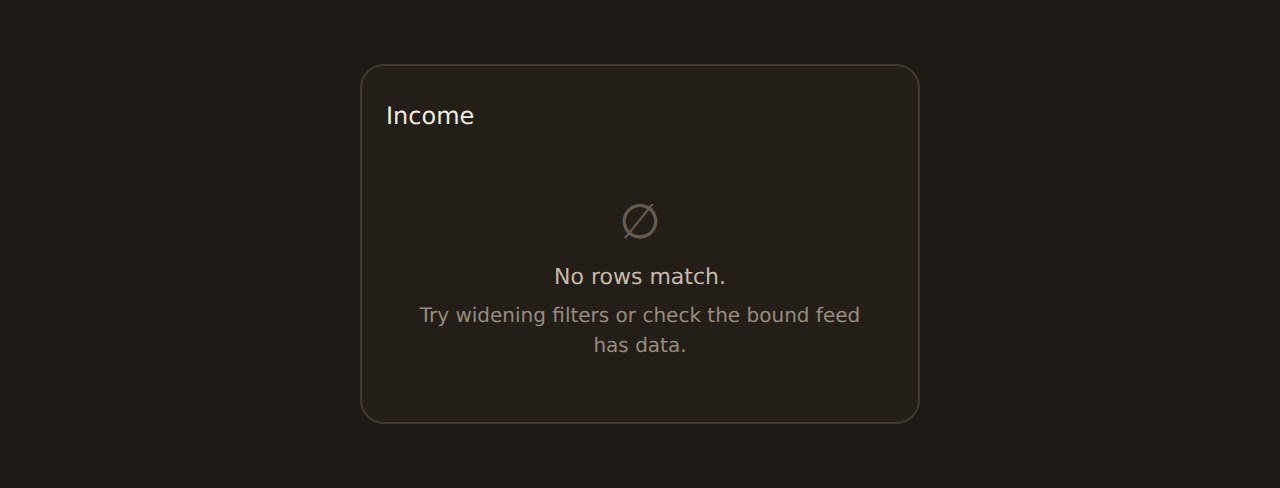
If a widget shows an empty body after shaping, it usually means your steps genuinely left no rows: a filter that excluded everything, or a join with no matches. That is a real answer, not an error, and BankSync shows a plain "no rows" state rather than a spinner. Loosen the filter or check the join key. For other empty or error states, see Troubleshooting.
For power users and agents#
Everything on this page is also available programmatically. The BankSync MCP and API let an agent build the same shapes without the UI: create_query for a single-feed pipeline, create_multi_feed_query for a stack or join, create_static_query for a fixed table, and create_query_derived_query to read from another query. The same loop-and-depth checks apply on save, and the error response includes the offending chain so an agent can self-correct. A widget's in-browser pass is editable too, via widget_pipeline_append, widget_pipeline_remove, and widget_pipeline_move.
Related guides#
- Binding data: the everyday channel controls that come before Shape data.
- KPI, table and gauge widgets: how shaped rows render in the non-chart widgets.
- Filters and cross-filtering: the dashboard filters that drive the instant in-browser pass.
- Templates: starter dashboards whose widgets already carry shaped queries.
Back to binding data
Use this page with your AI assistant
Every BankSync doc is available as plain Markdown for agents and LLMs.