Building Dashboards with an AI Agent
Ask Claude or another AI agent to build, edit, and publish dashboards for you through BankSync's dashboard authoring tools (a non-production beta).
9 min read
On this page
Instead of clicking around the dashboard editor yourself, you can ask an AI agent (like Claude) to build a dashboard for you in plain English: "Make me a spending-by-category dashboard for my Chase feed, last 90 days." The agent does the work through a set of dashboard authoring tools, and what it creates is a real, editable dashboard you can open and tweak by hand afterwards.
This page explains what the agent can do, the order it works in, and the honest limits of the feature today.
A few plain-language terms used here:
- An AI agent is an assistant (for example Claude) connected to BankSync that can call BankSync's tools on your behalf.
- A tool is a single named action the agent can take, like "list my feeds" or "create a widget". The agent picks which tools to call; you just describe what you want.
- A feed is one of your synced data sources (for example a Chase transactions feed). The agent builds on top of feeds you have already connected.
Beta, and not available in production yet
Two ways to build#
There are two ways to get widgets onto a dashboard, and it helps to know which one this page is about:
By hand in the app
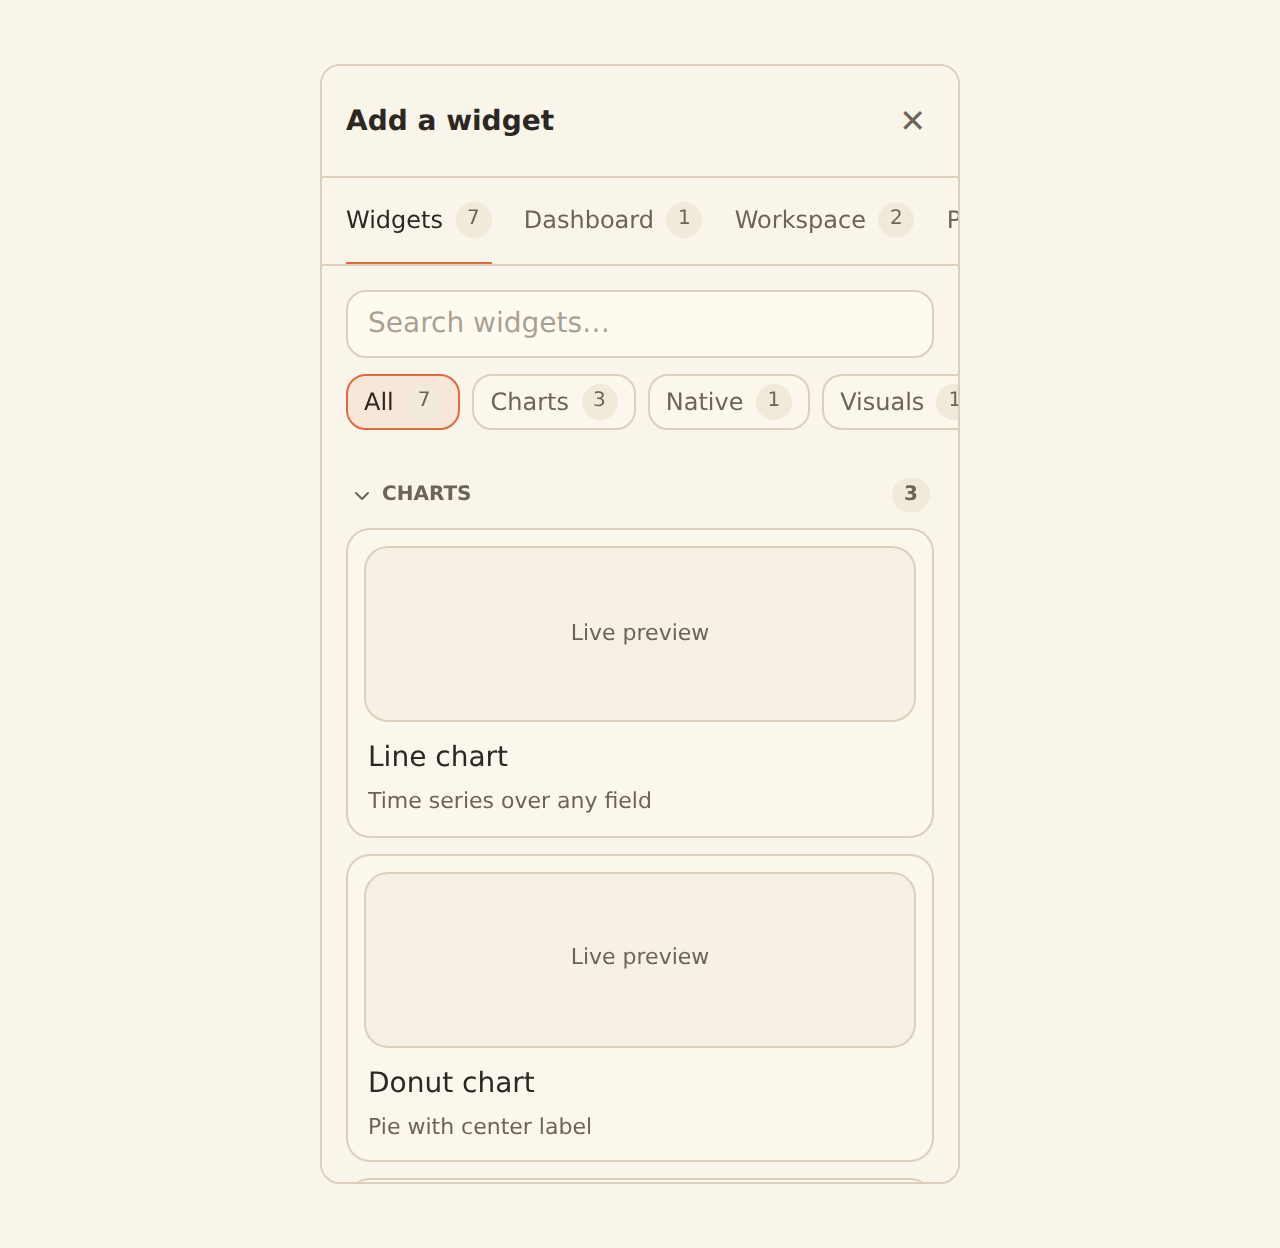
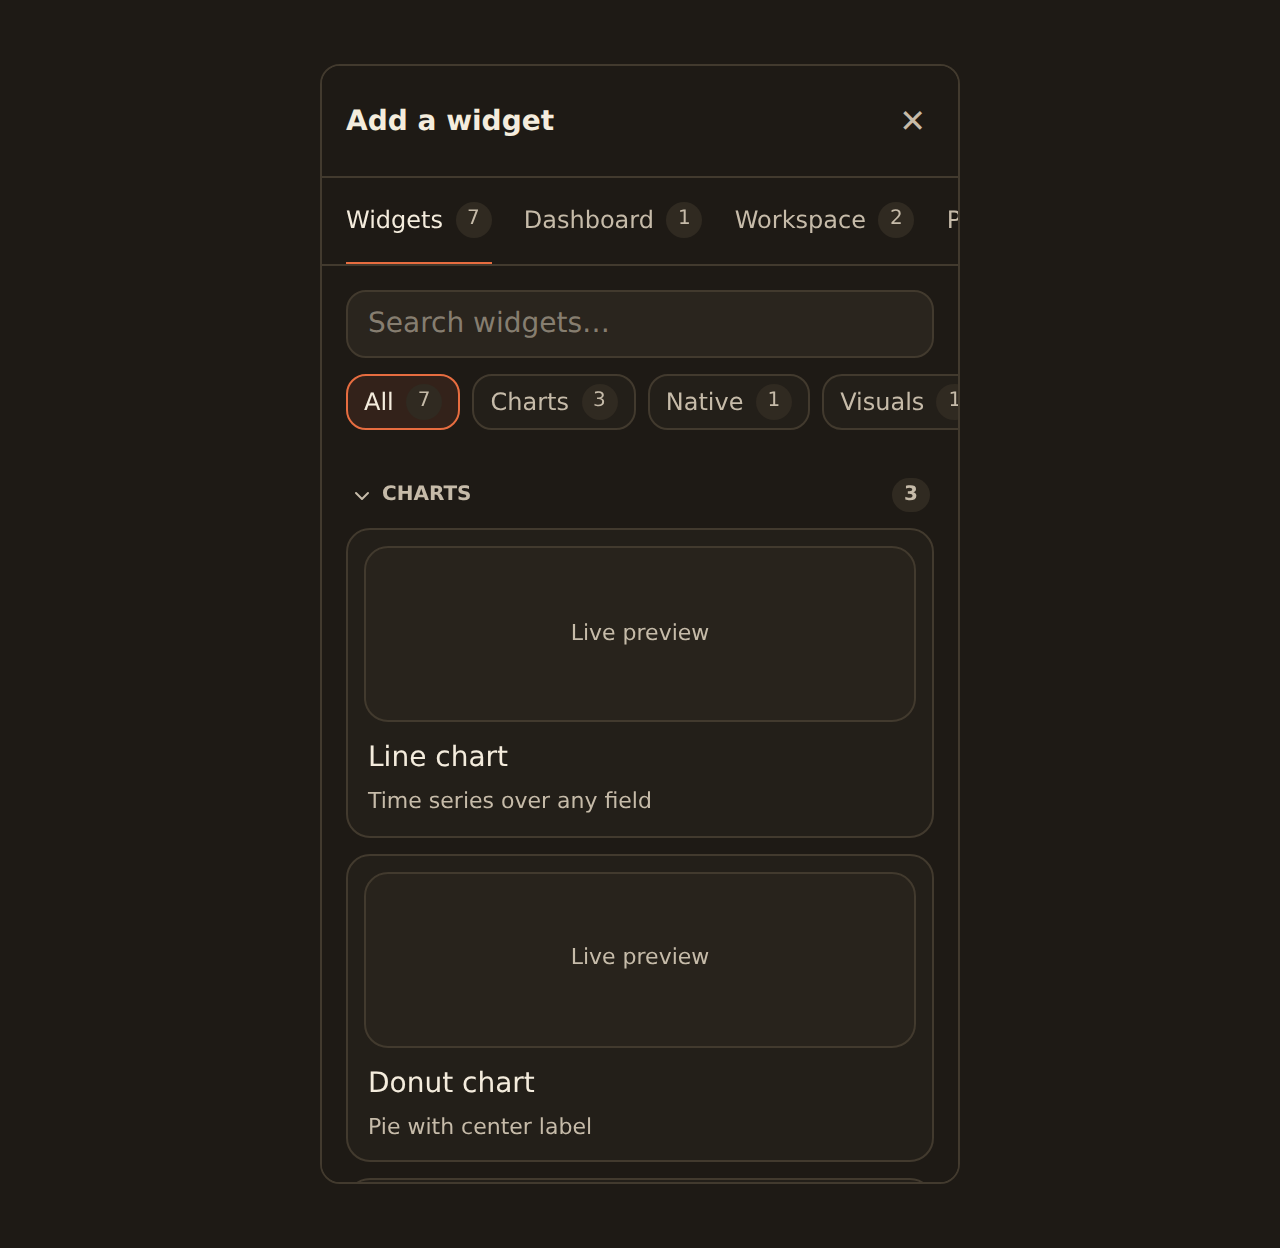
Inside the dashboard editor's widget library you browse the catalog, add a widget, and configure it in the inspector. This is built into the app and always available where Dashboards is enabled.
An external agent (MCP)
You connect an agent such as Claude to BankSync and ask it to build a whole dashboard. The agent uses the authoring tools described on this page. This is the non-production beta surface.
The rest of this page is about the second surface: asking an external agent to build dashboards for you.
What the agent can build#
Once connected, the agent has tools to do essentially everything you can do in the editor, plus a few discovery tools it uses to figure out what is possible. The main groups:
Discover what's possible
List every chart, KPI, table, and gauge kind the build can render, read the contract for any one of them, and inspect a feed's available fields (including fields reachable by joining feeds).
Get suggestions
Ask for a ranked set of starter widgets for a feed (a trend over time, breakdowns by category, a KPI, a table) that are already valid and ready to save.
Create the data behind a widget
Create a Query, which is the saved definition of what data a widget reads and how it is shaped (filtered, grouped, summed, sorted).
Create and place widgets
Create widgets, pin them onto a dashboard at a chosen size or position, and add dashboard-wide filters like a date range.
Organize and edit
Create folders, move and rename things, update an existing dashboard or widget, and delete what you no longer need.
Templates and publishing
Start a dashboard from a prebuilt template, and publish a dashboard or a single widget to a shareable link.
A short slice of what an agent does looks like this. It creates the dashboard, then pins a widget it built earlier onto it (each step is one tool call, with the tool's reply shown beneath):
// 1. The agent creates the dashboard and gets back its id + slug.→ create_dashboard {    "slug": "spending-overview",    "name": "Spending Overview"  }← { "dashboardId": "dash_8fK2", "slug": "spending-overview" }
// 2. It pins the bar-chart widget it already created at a large footprint.→ attach_widget {    "dashboardId": "dash_8fK2",    "widgetId": "wgt_4Qa9",    "size": "l"  }← { "dashboardId": "dash_8fK2", "placementId": "place_Lm3" }
A good agent narrates each step in plain English as it goes ("creating the dashboard, now pinning the spending chart"), and the dashboard appears in your list the moment these calls return.
The building blocks, briefly#
When the agent builds a dashboard it works with the same three pieces you do in the editor:
- A Query is the recipe for the data: which feed to read, and how to shape it (for example "Transactions, group by category, sum the amount, last 90 days").
- A Widget is the visual: a chart, a KPI big-number, a table, or a gauge. A view widget points at a query.
- A Dashboard is the page that holds widgets in a grid, with optional shared filters across all of them.
The agent typically creates a query first, then a widget that reads it, then pins the widget onto a dashboard. For more on what a query can do (joining feeds, multi-step shaping), see Shaping data.
How the agent works: a worked example#
Suppose you ask: "Build me a spending-by-category dashboard from my Chase transactions feed for the last 90 days, and add a Total spend KPI." A capable agent works roughly in this order. The labels in parentheses are the tools it calls, so you can recognise them if your agent shows its steps.
What the agent does behind the scenes
Find your feed (list feeds)
It looks up your connected feeds to find the Chase transactions feed, so it has the right feed to build on.
Check the fields (describe fields)
It inspects which columns that feed exposes, such as Date, Amount, and Category, including any fields it can reach by joining related feeds.
Pick the visuals (list / describe widget kinds, suggest widgets)
It lists the renderable widget kinds, optionally reads the exact contract for "bar chart" and "KPI", and can ask for ranked starter widgets for a transactions feed.
Define the data (create query)
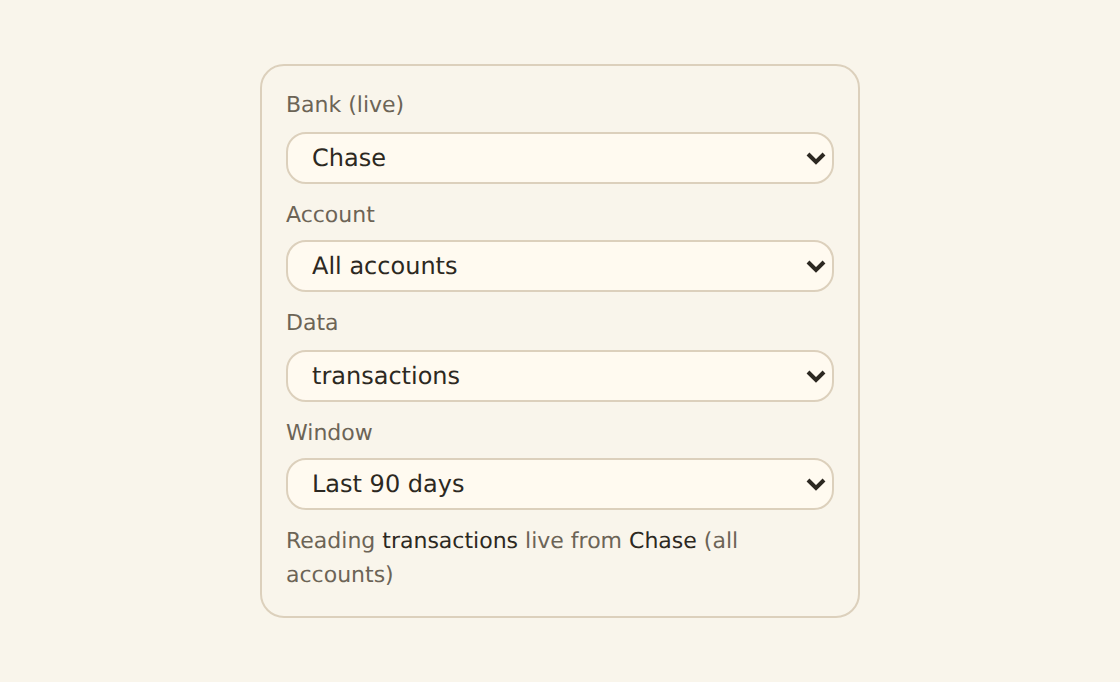
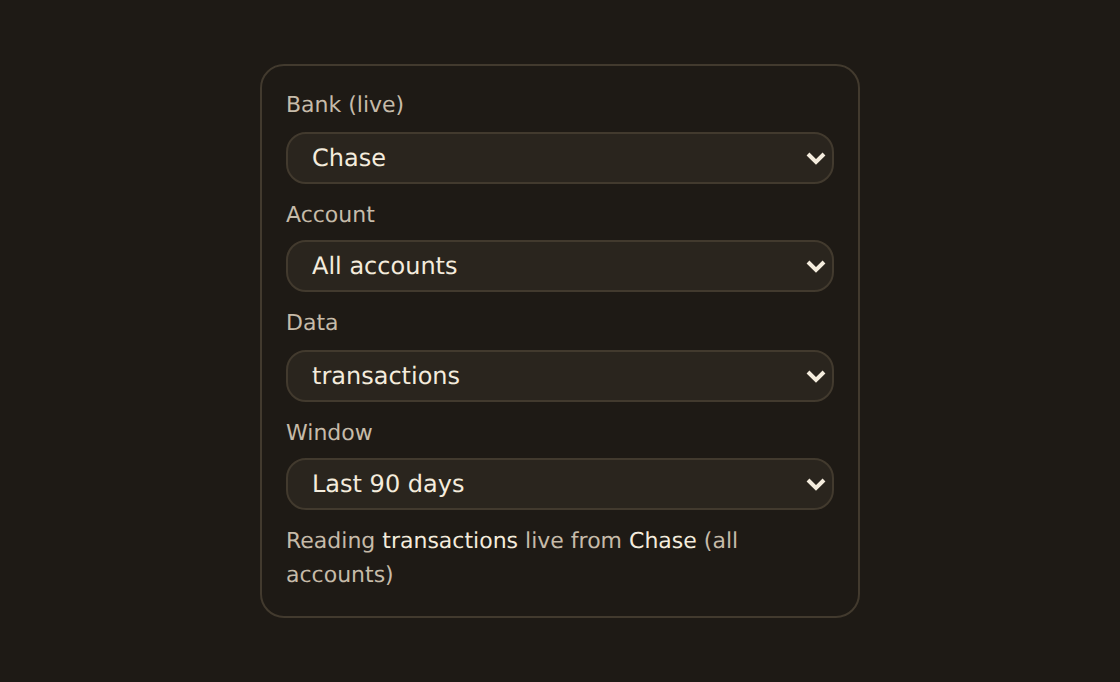
It creates a query that reads the Chase feed, groups by Category, and sums Amount. It can attach a date-range parameter so the 90-day window is adjustable later.
Check before committing (validate widget spec)
It validates the widget definition against the chosen kind. If anything is off, it gets a precise list of what to fix and corrects it before saving, so you do not end up with a broken widget.
Create the widgets (create widget)
It creates the bar-chart widget bound to the query, and a KPI widget that shows total spend.
Make the dashboard (create dashboard)
It creates a dashboard, for example "Spending Overview".
Place the widgets (attach widget)
It pins each widget onto the dashboard at a sensible size and position.
Add a shared control (set dashboard filter)
It adds a dashboard-wide date-range filter so every widget responds to one date picker.
The result is a normal dashboard. Open it in the editor and you can resize widgets, change the chart kind, swap the feed, or add more, exactly as if you had built it yourself.
Discover, then validate, then create
Starting from a template instead#
The agent does not have to build from scratch. It can list the available templates, check whether your workspace has the feeds a template needs, and then instantiate the template, connecting each of the template's data slots to one of your feeds. This is the fastest path when a prebuilt dashboard already matches what you want.
If a required feed is missing, the precondition check reports exactly which feed type is needed, so the agent can tell you what to connect first rather than failing silently. See Dashboard templates for how templates and data slots work.
Instantiating a template connects its data slots to your feeds and returns the new dashboard plus the widgets it created. Here the agent fills the template's txns slot with a Chase transactions feed:
→ instantiate_template { "idOrKey": "spend-by-category", "slots": { "txns": "feed_chase_txns" } }← { "ok": true, "result": { "dashboard": { "id": "dash_Vz1", "slug": "spend-by-category", "name": "Spend by Category" }, "widgets": [ { "id": "wgt_Tt7", "name": "Spend by category", "kind": "bar" } ] } }If a required feed is missing, the precondition check fails first and names the feed type to connect, so the agent can tell you what to add rather than producing an empty dashboard.
Editing and tidying up#
The agent is not limited to creating. It can also:
- Update an existing dashboard or widget: rename it, change its chart kind, swap the query it reads, or adjust its filters.
- Organize: create folders, move dashboards between them, and reorder.
- Delete: remove a dashboard, widget, query, or folder you no longer need.
Safe deletes
Publishing through the agent#
The agent can publish a finished dashboard, or a single widget on its own, to a shareable link. Publishing sets the dashboard's visibility and, where public sharing is enabled for your workspace, returns a share URL and an embed snippet.
Two honest caveats the agent should pass along:
- Public sharing is rolled out per workspace. If your workspace is not yet provisioned for public serving, publishing returns no link rather than a dead one. The dashboard is still saved; it just is not shareable yet.
- Regenerating a link revokes the old one. Asking the agent to regenerate a share link rotates it, so any previously copied link or embed stops working.
For the full picture of share links, embeds, and how published dashboards behave, see Publishing and sharing.
When the agent publishes, the tool returns the share and embed URLs (where public sharing is enabled for your workspace), which the agent then passes back to you:
→ publish_dashboard { "dashboardId": "dash_8fK2", "visibility": "public" }← { "shortcode": "sc_7Hq2Lp", "urls": { "share": "https://app.banksync.io/share/sc_7Hq2Lp", "embed": "https://app.banksync.io/embed/sc_7Hq2Lp", "canonical": "https://app.banksync.io/d/dash_8fK2" } }If your workspace is not yet provisioned for public serving, shortcode comes back null with no share URL: the dashboard is saved, it is just not shareable yet.
What to expect, and the limits#
Good things to know
A few real limits to set expectations:
- Beta and non-production only. As noted at the top, these tools are off in production today.
- The minimal-spec tradeoff. When the agent creates a widget, BankSync deliberately does not force every advanced chart-styling option at create time, so reasonable minimal widgets are accepted. The agent uses the separate validate step to check the visual contract; some fine styling is then adjusted in the editor.
- Live preview is in the app. The agent can confirm a widget definition is valid, but rendering it against your live data with a visual preview happens when you open the dashboard in BankSync. In some environments the agent cannot run a full data preview itself and will tell you to open the dashboard to see it.
- You stay in control. Nothing the agent builds is hidden. It all shows up in your dashboards list and content tree, ready for you to review and change.
Related guides#
- Dashboards overview: the four parts of a dashboard and how saving works.
- Binding data: how a widget reads from a feed or live bank source.
- Shaping data: joins, multi-feed queries, and multi-step shaping the agent can build.
- KPI, table & gauge widgets: the non-chart widget kinds the agent can create.
- Dashboard templates: starter dashboards the agent can instantiate against your feeds.
- Publishing and sharing: share links, embeds, and how published dashboards behave.
Use this page with your AI assistant
Every BankSync doc is available as plain Markdown for agents and LLMs.