Dashboards Troubleshooting & FAQ
Fix the common dashboard issues: empty widgets, the broken-binding nudge, disabled chart kinds, mis-formatted table columns, blank non-standard charts, and dashboards that will not load.
8 min read
On this page
Most dashboard problems come down to the data a widget is reading, or to how its fields are set up. This page covers what the common states mean and how to fix them.
One term to know: binding
A widget is empty#
An empty widget is not always an error. There are three different states:
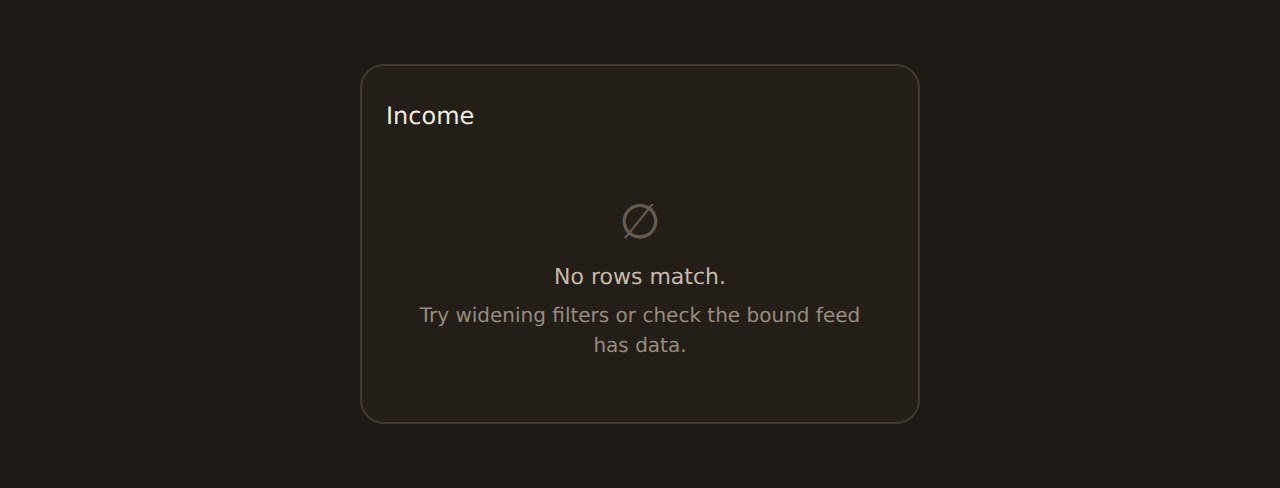
No rows match
The widget loaded fine, but nothing in your data matches. Widen a filter or pick a period with activity.
Still loading
The data is being fetched. It resolves on its own; large pulls take a moment.
An error
Something went wrong reading the data. The widget shows the reason and a next step.
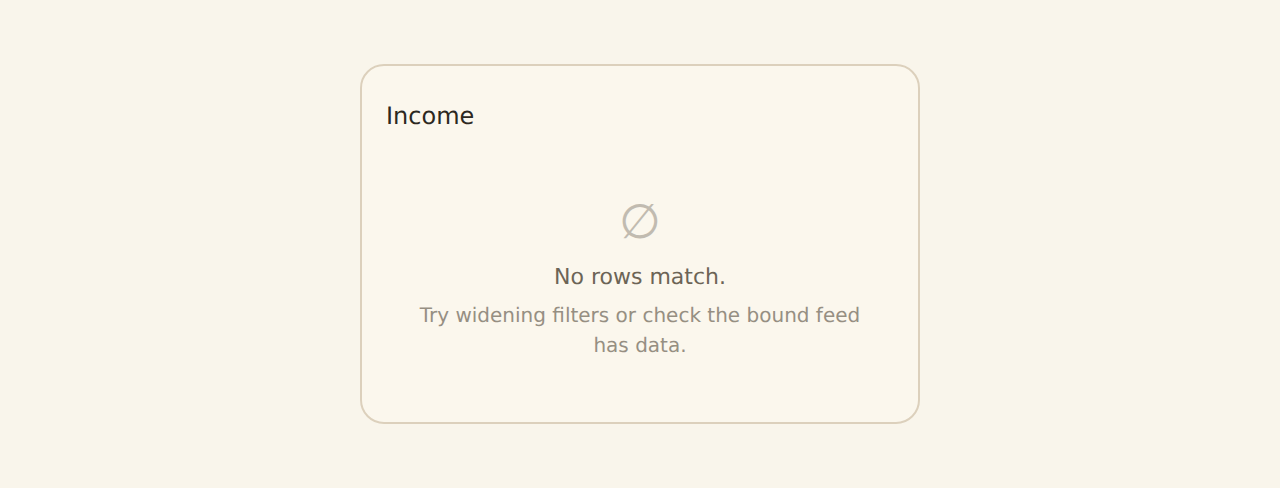
While the data is still being fetched, the widget shows a brief loading state (the amber "Still loading" card above), which clears on its own once the result arrives; larger pulls take a moment.
No rows match is not a bug
Worked example: an empty cash-flow chart
My widget shows a "5k+" badge#
A small amber 5k+ badge in a widget's header means the result was large and was trimmed to the first 5,000 rows for display (the badge tooltip shows the true total, for example "Truncated to first 5000 of 18,402 rows"). This only affects how many rows the widget draws; it does not delete or lose any data. If you are comparing a table's visible rows to your own count and they differ, this badge is usually why. To see everything, narrow the widget with a filter (a tighter date range or a single account) so the result fits under the limit.
A widget shows a fix-it nudge#
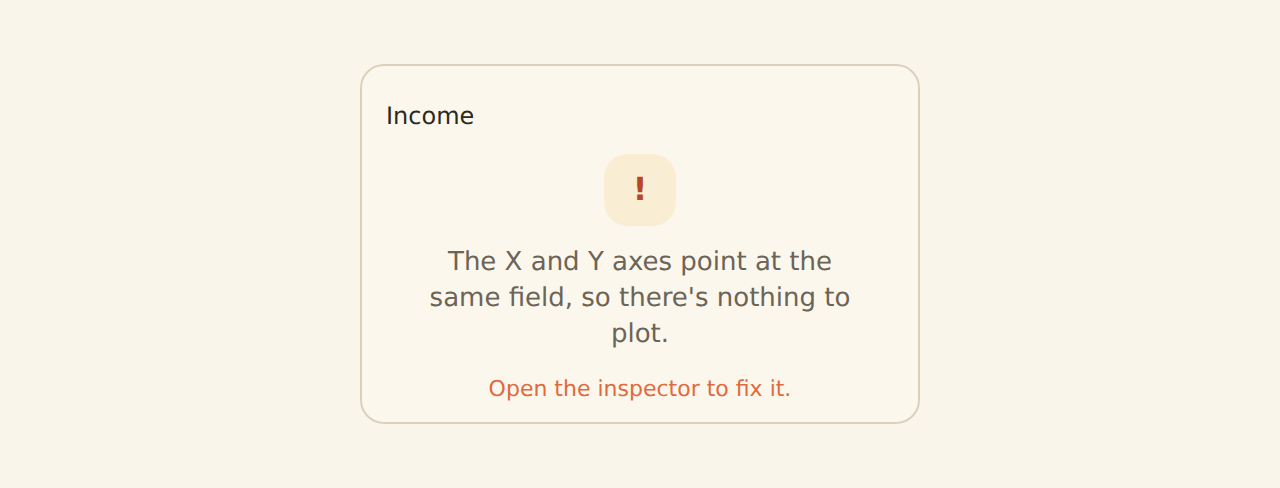
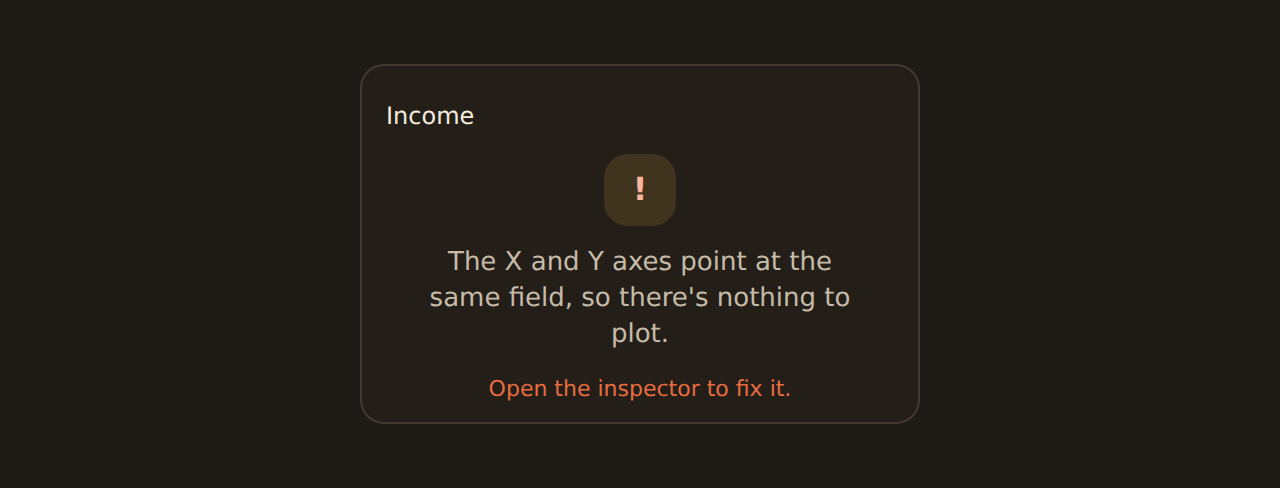
If a chart's fields no longer line up (for example the same field ended up on both the Group by and the Value), the widget shows a short fix-it nudge in place of a broken chart, with a one-line explanation and the hint "Open the inspector to fix it."
The nudge itself is not a button. To fix it:
Repair a broken binding
Click the widget
This opens the widget inspector on the right, where its fields live.
Use Auto-fix binding
In the inspector you will see the same warning with an Auto-fix binding button. Click it and BankSync re-assigns the fields by their natural role (a category field to Group by, a number to Value).
Or re-pick the fields yourself
If the auto-fix is not what you wanted, change Group by and Value by hand in the inspector. See Binding data.
A chart kind is greyed out#
A chart kind can be disabled in the Chart type picker for two different reasons. Read the note next to the greyed-out option to tell which one you are hitting.
1. Your data cannot fill what the kind needs. The picker shows a plain reason like "needs a category or number field." Add the missing kind of field in the inspector and the option turns on.
For example, a pie or donut needs one category to slice by plus one number to size the slices: pick something like Merchant (the category) and Amount (the number), and the pie un-greys. A line or column chart needs a date or category for the bottom axis plus a number to plot.
2. There is no renderer for that kind. Occasionally a kind appears as "(renderer missing)" and stays disabled, with an amber note: 'No renderer for "X". Pick a supported kind above.' This is not about your data: it means that chart type cannot be drawn in your current app version. Pick a supported kind from the list instead. This is rare and usually clears after an app update.
See Binding data for how to add and assign fields.
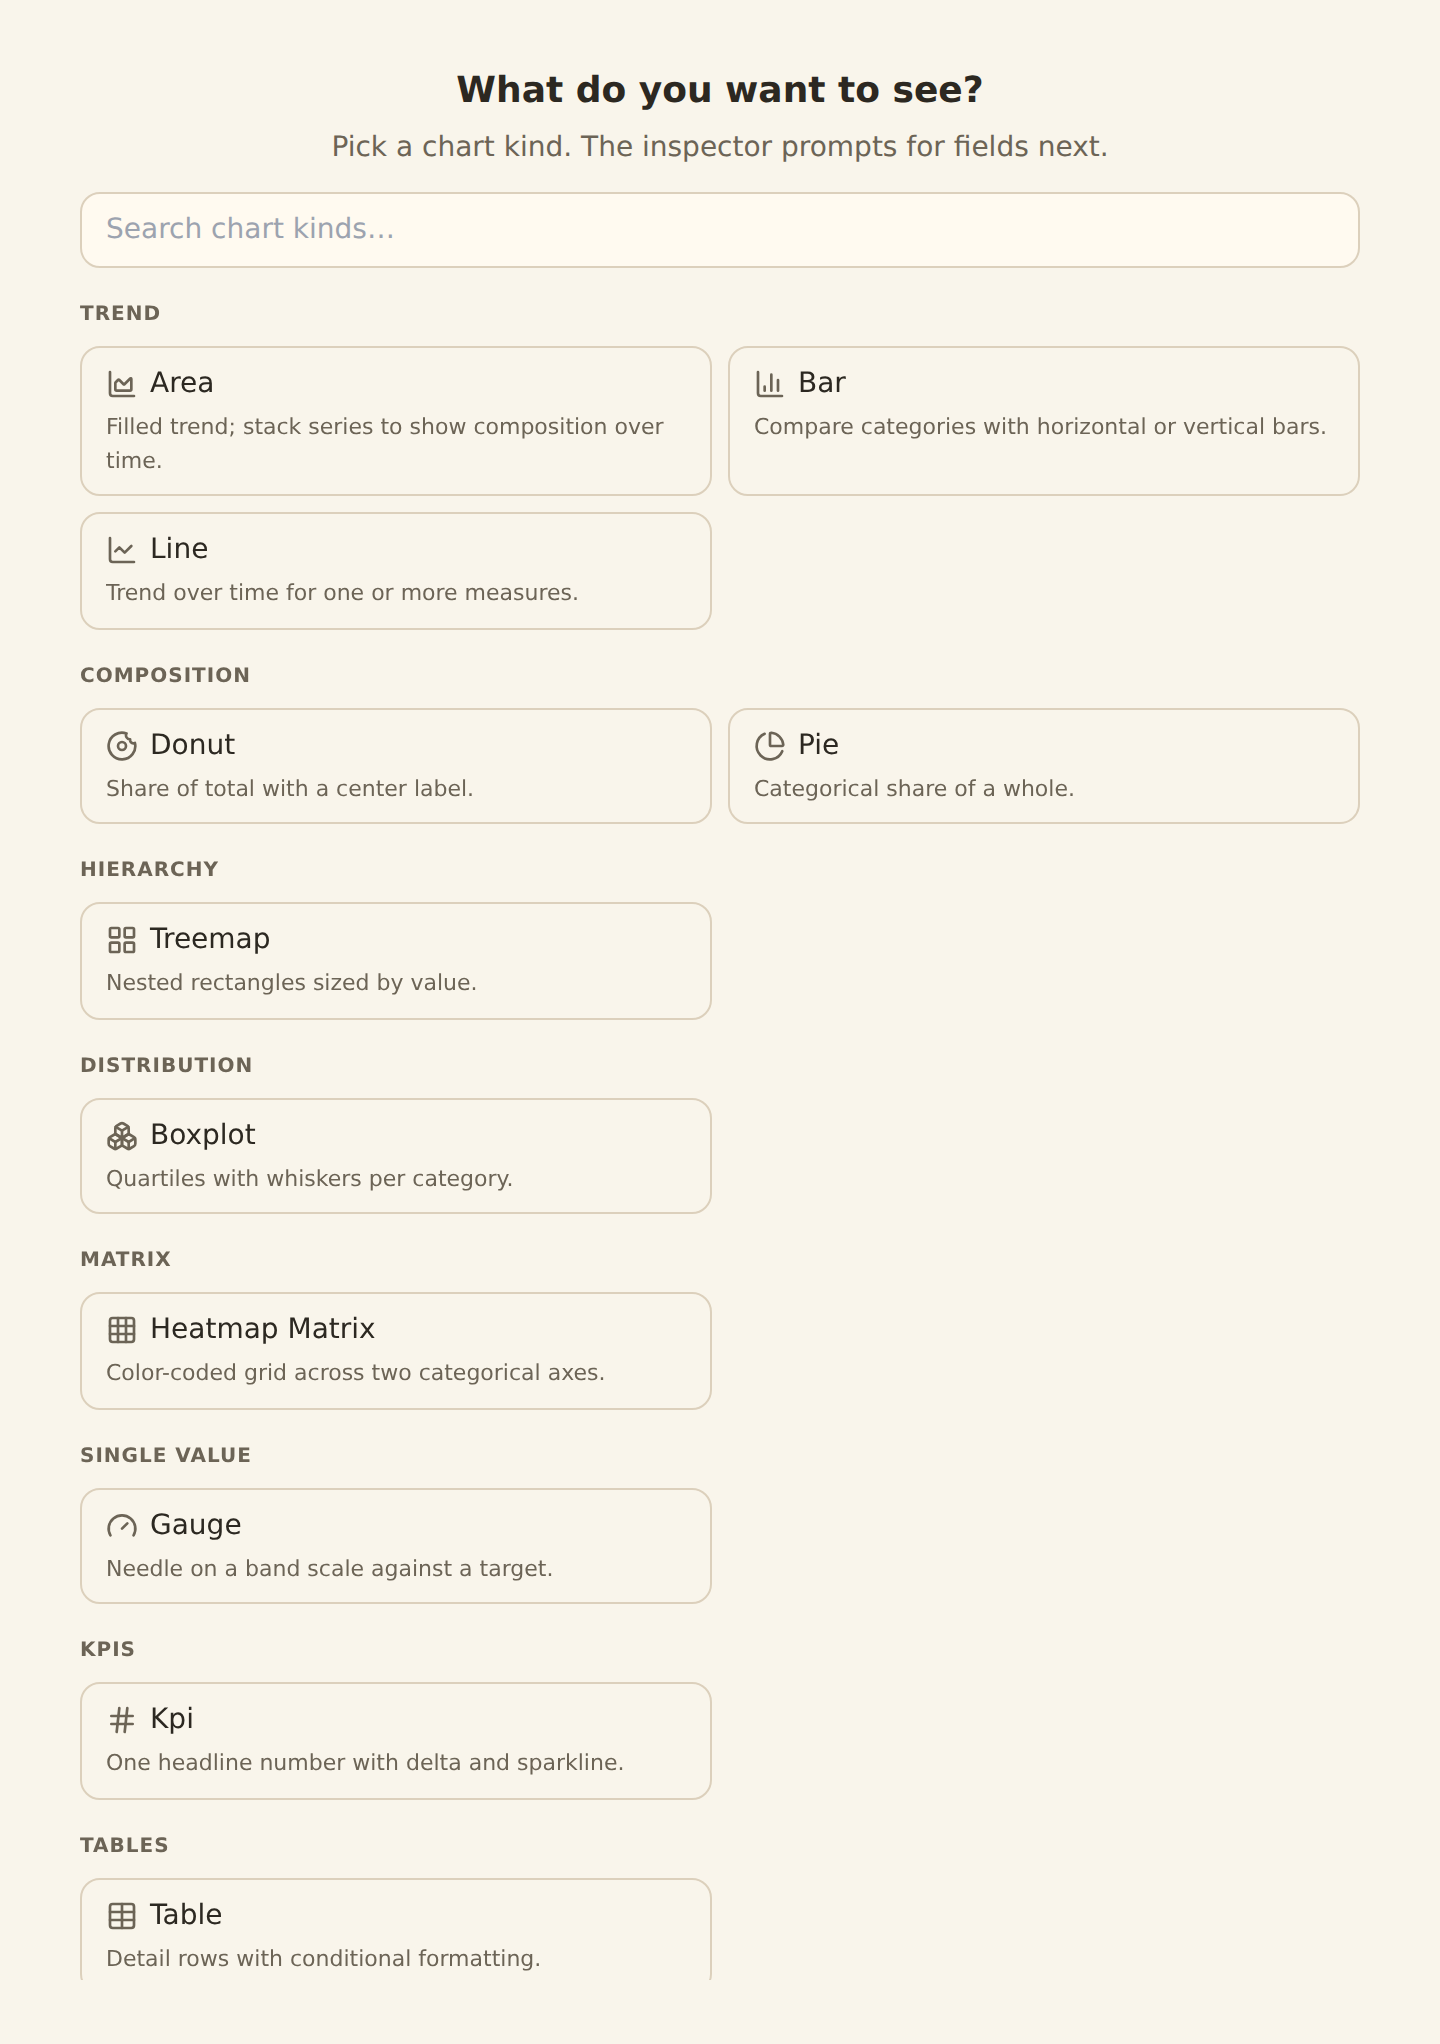
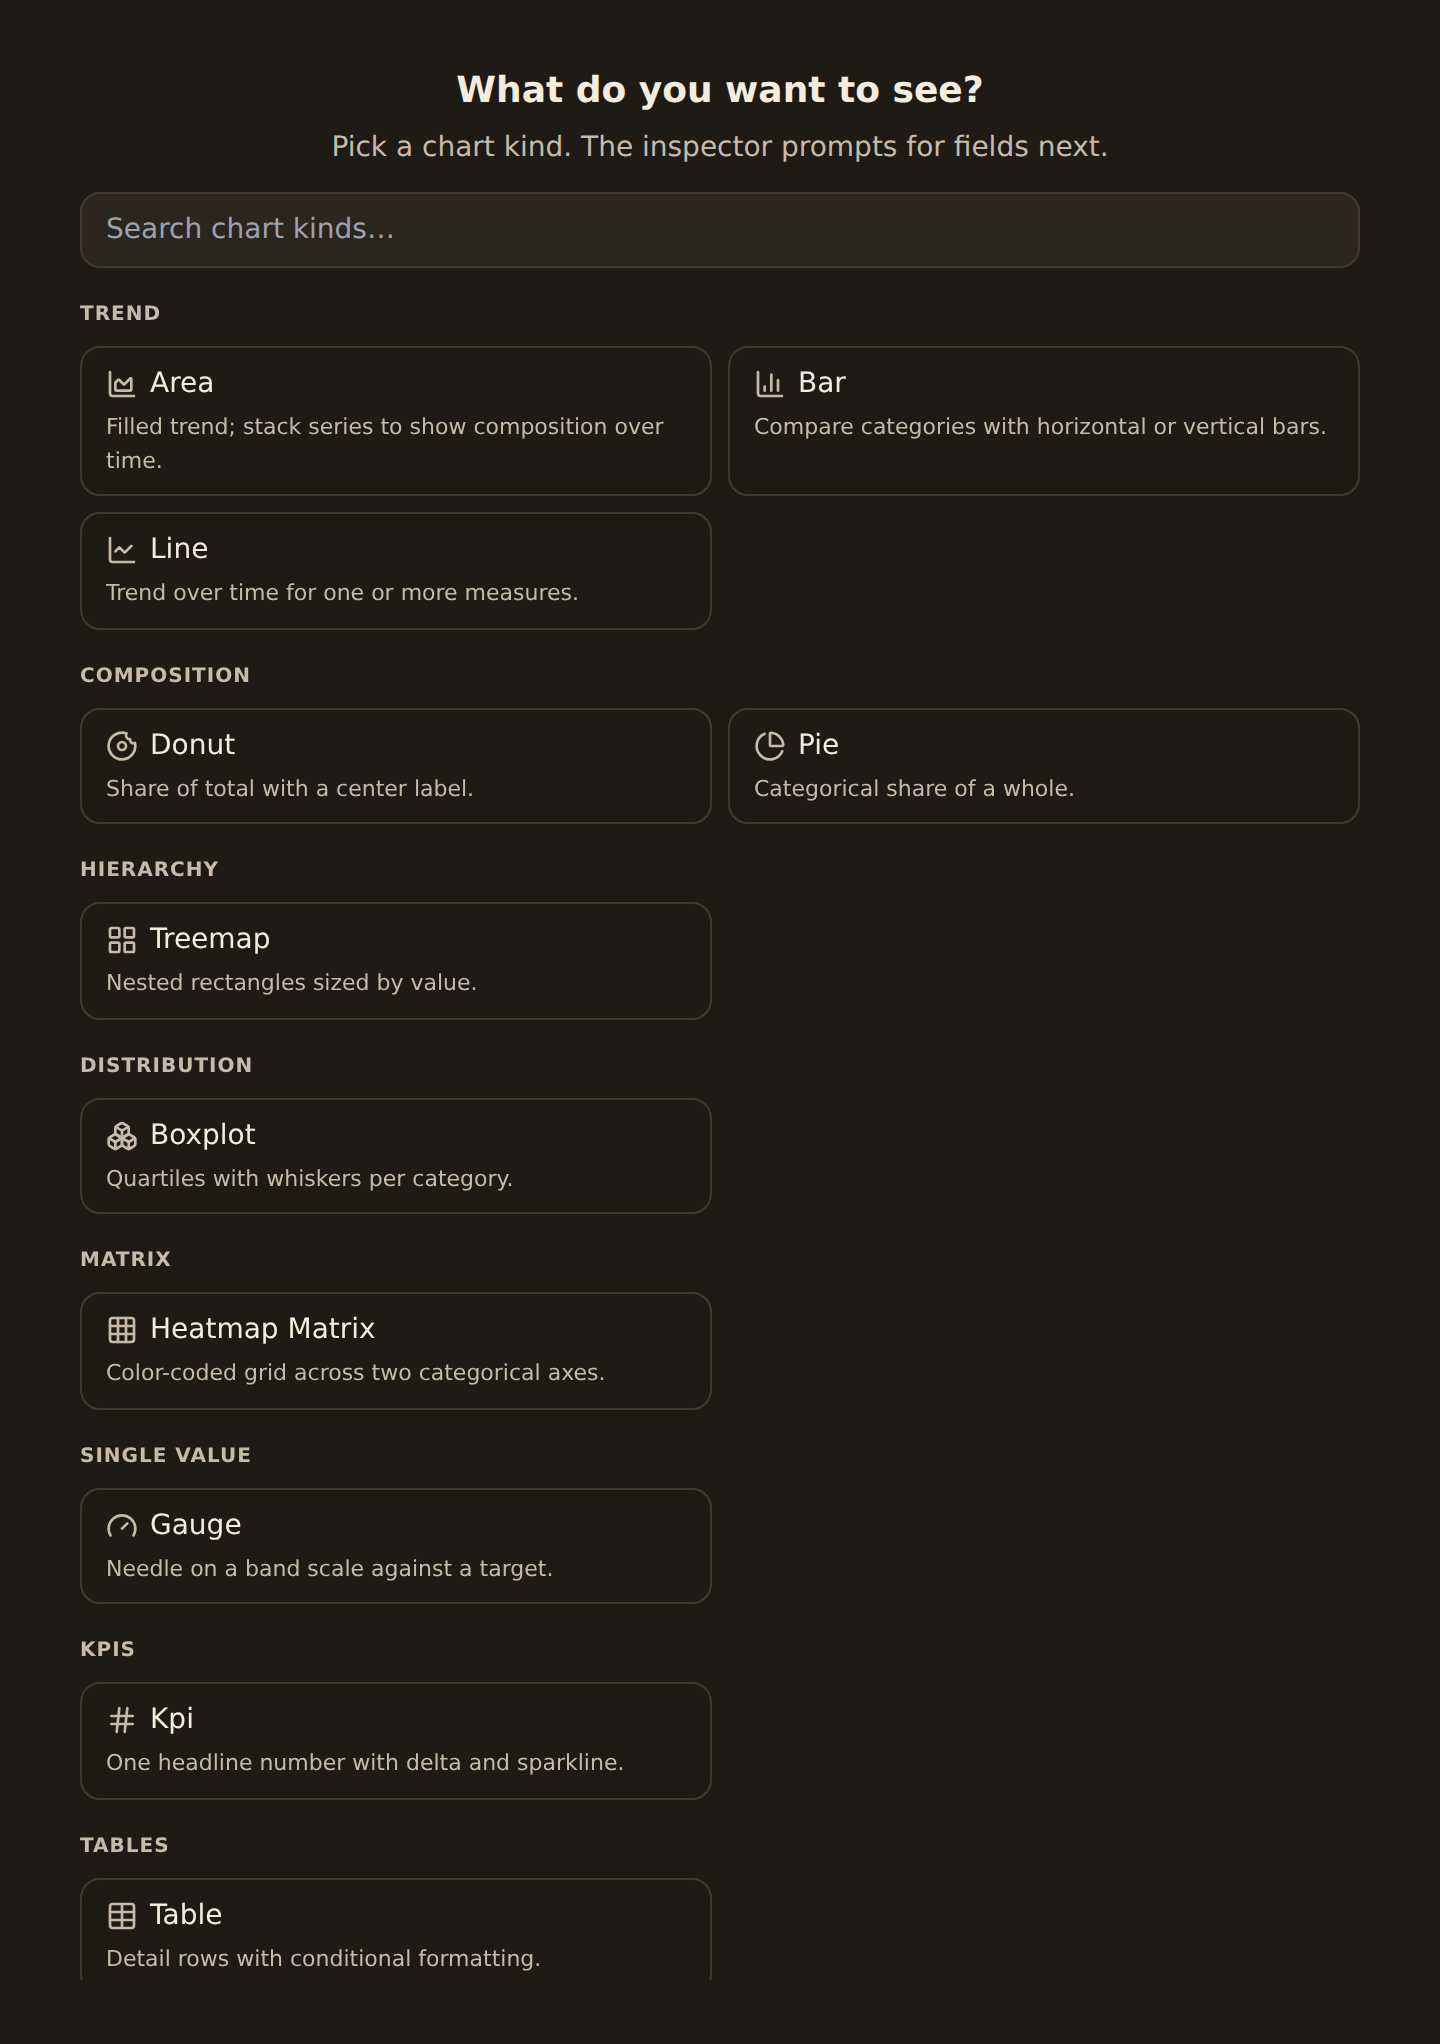
A chart looks unstyled or says "Preview"#
This covers two related things, depending on the widget type.
Newer chart kinds have limited styling. Some of the more advanced chart kinds render correctly but do not yet expose every appearance control. They carry a Preview badge in the widget library, and the inspector's Style tab shows a note that the legend, grid, axes, and title controls are not wired up for that kind yet. The chart kinds that support the full set of styling controls today are: line, area, bar, column, scatter, histogram, pie, and donut. If you need full styling control right now, switch to one of those, or use the Advanced tab to set spec fields directly.
KPI, table, and gauge are not in this list
A table column shows the wrong format#
Each column in a table widget has a cell type that controls how it is displayed: currency, percent, date, a status pill, a progress bar, a sparkline, a rating, chips, a link, and more. If a column is showing a raw number, a plain date, or a block of text where you expected something nicer, the column's cell type just needs to be set.
Fix a column's format
Open the table inspector
Click the table widget to open its inspector, then find the column manager (the list of column cards).
Pick the column's cell type
On the column you want to change, choose the format that fits, for example Currency for an amount, Status for a state, or Progress for a 0-to-100 value.
Set any extra option it needs
Some types need a small hint. A progress bar and a heatmap need a number to scale against (the column's maximum), and a heatmap or range cell needs numeric data to derive its colour scale. If those are missing, the cell falls back to plain text.
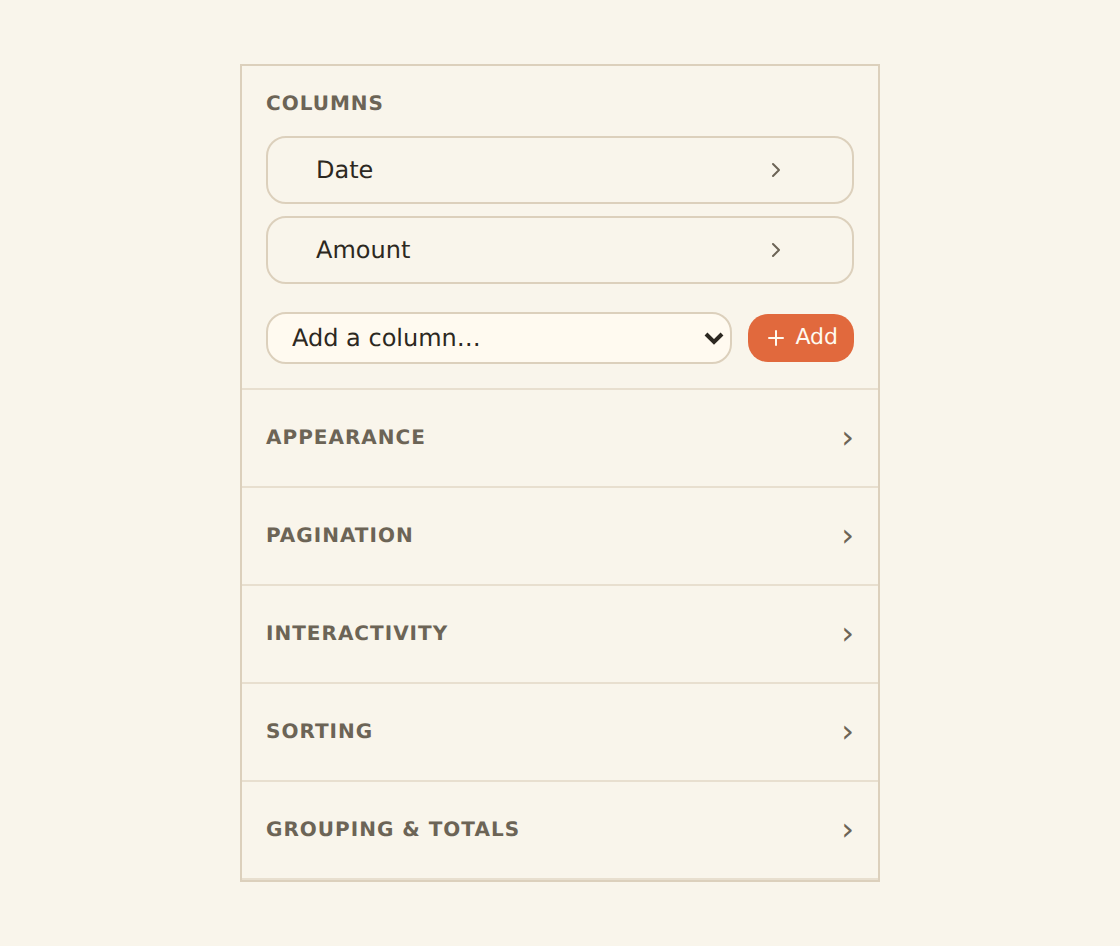
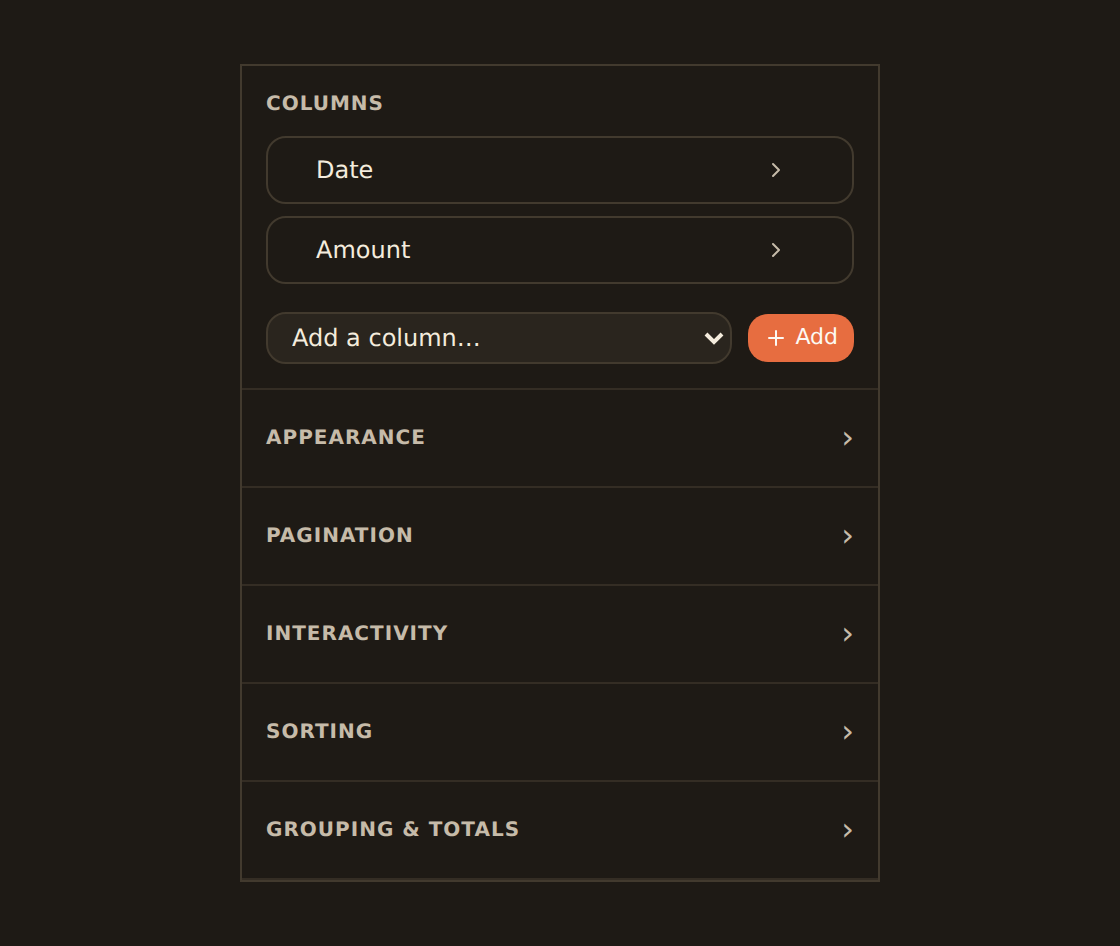
Two cell types always show as plain text
A non-standard chart stays blank after I bind fields#
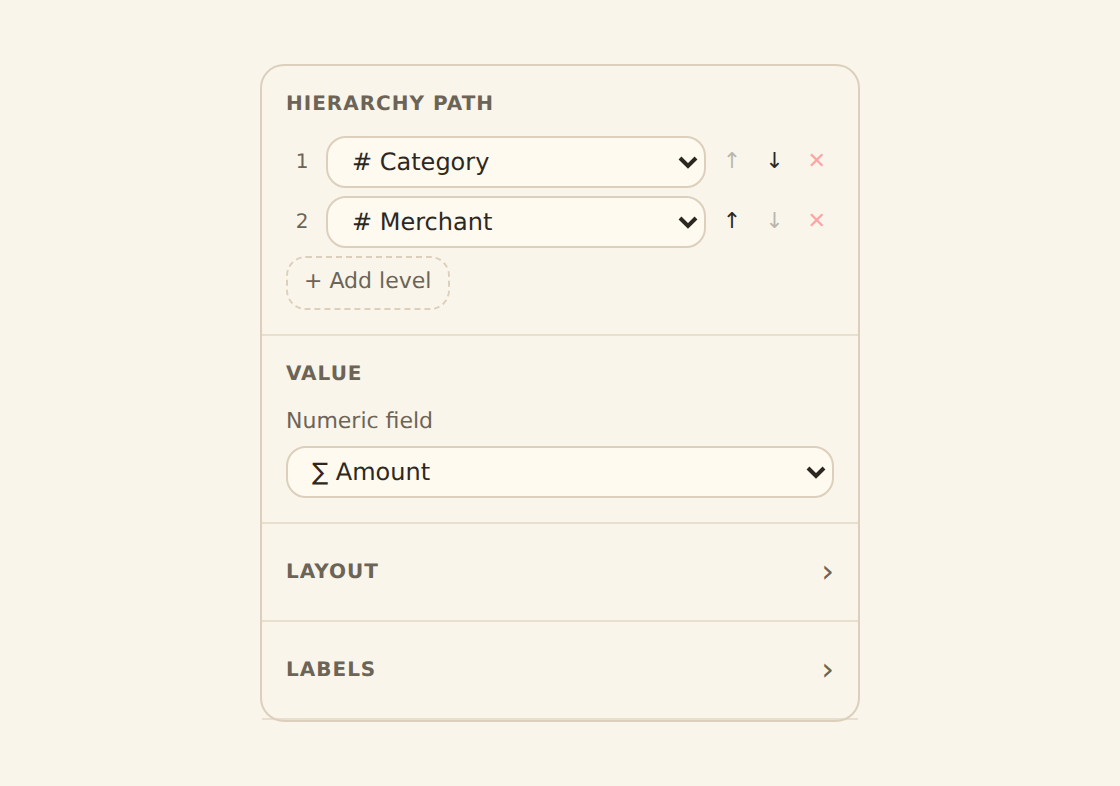
The more specialised chart kinds (for example treemap, radar, box plot, heatmap matrix, and sankey) are not the usual two-axis charts, so their fields are set up a little differently. If one of these stays empty even after you picked fields, open its inspector and look at the Fields section: re-pick each field there (for example the path for a treemap, or the axes for a radar) so every slot points at a real field. Saving from that Fields section writes the binding the chart needs, and the chart fills in.
A dashboard will not open#
If a dashboard link shows "unavailable" or not found, check that:
Dashboard will not load
You have access
Private dashboards are visible only to their creator; a workspace dashboard needs you to be a member.
The link is current
If the dashboard was deleted, or a public link was regenerated, the old link stops working.
It was saved
A draft that was never named or given a widget was never saved, so it has no permanent link.
Frequently asked#
Do widgets ever show sample data?
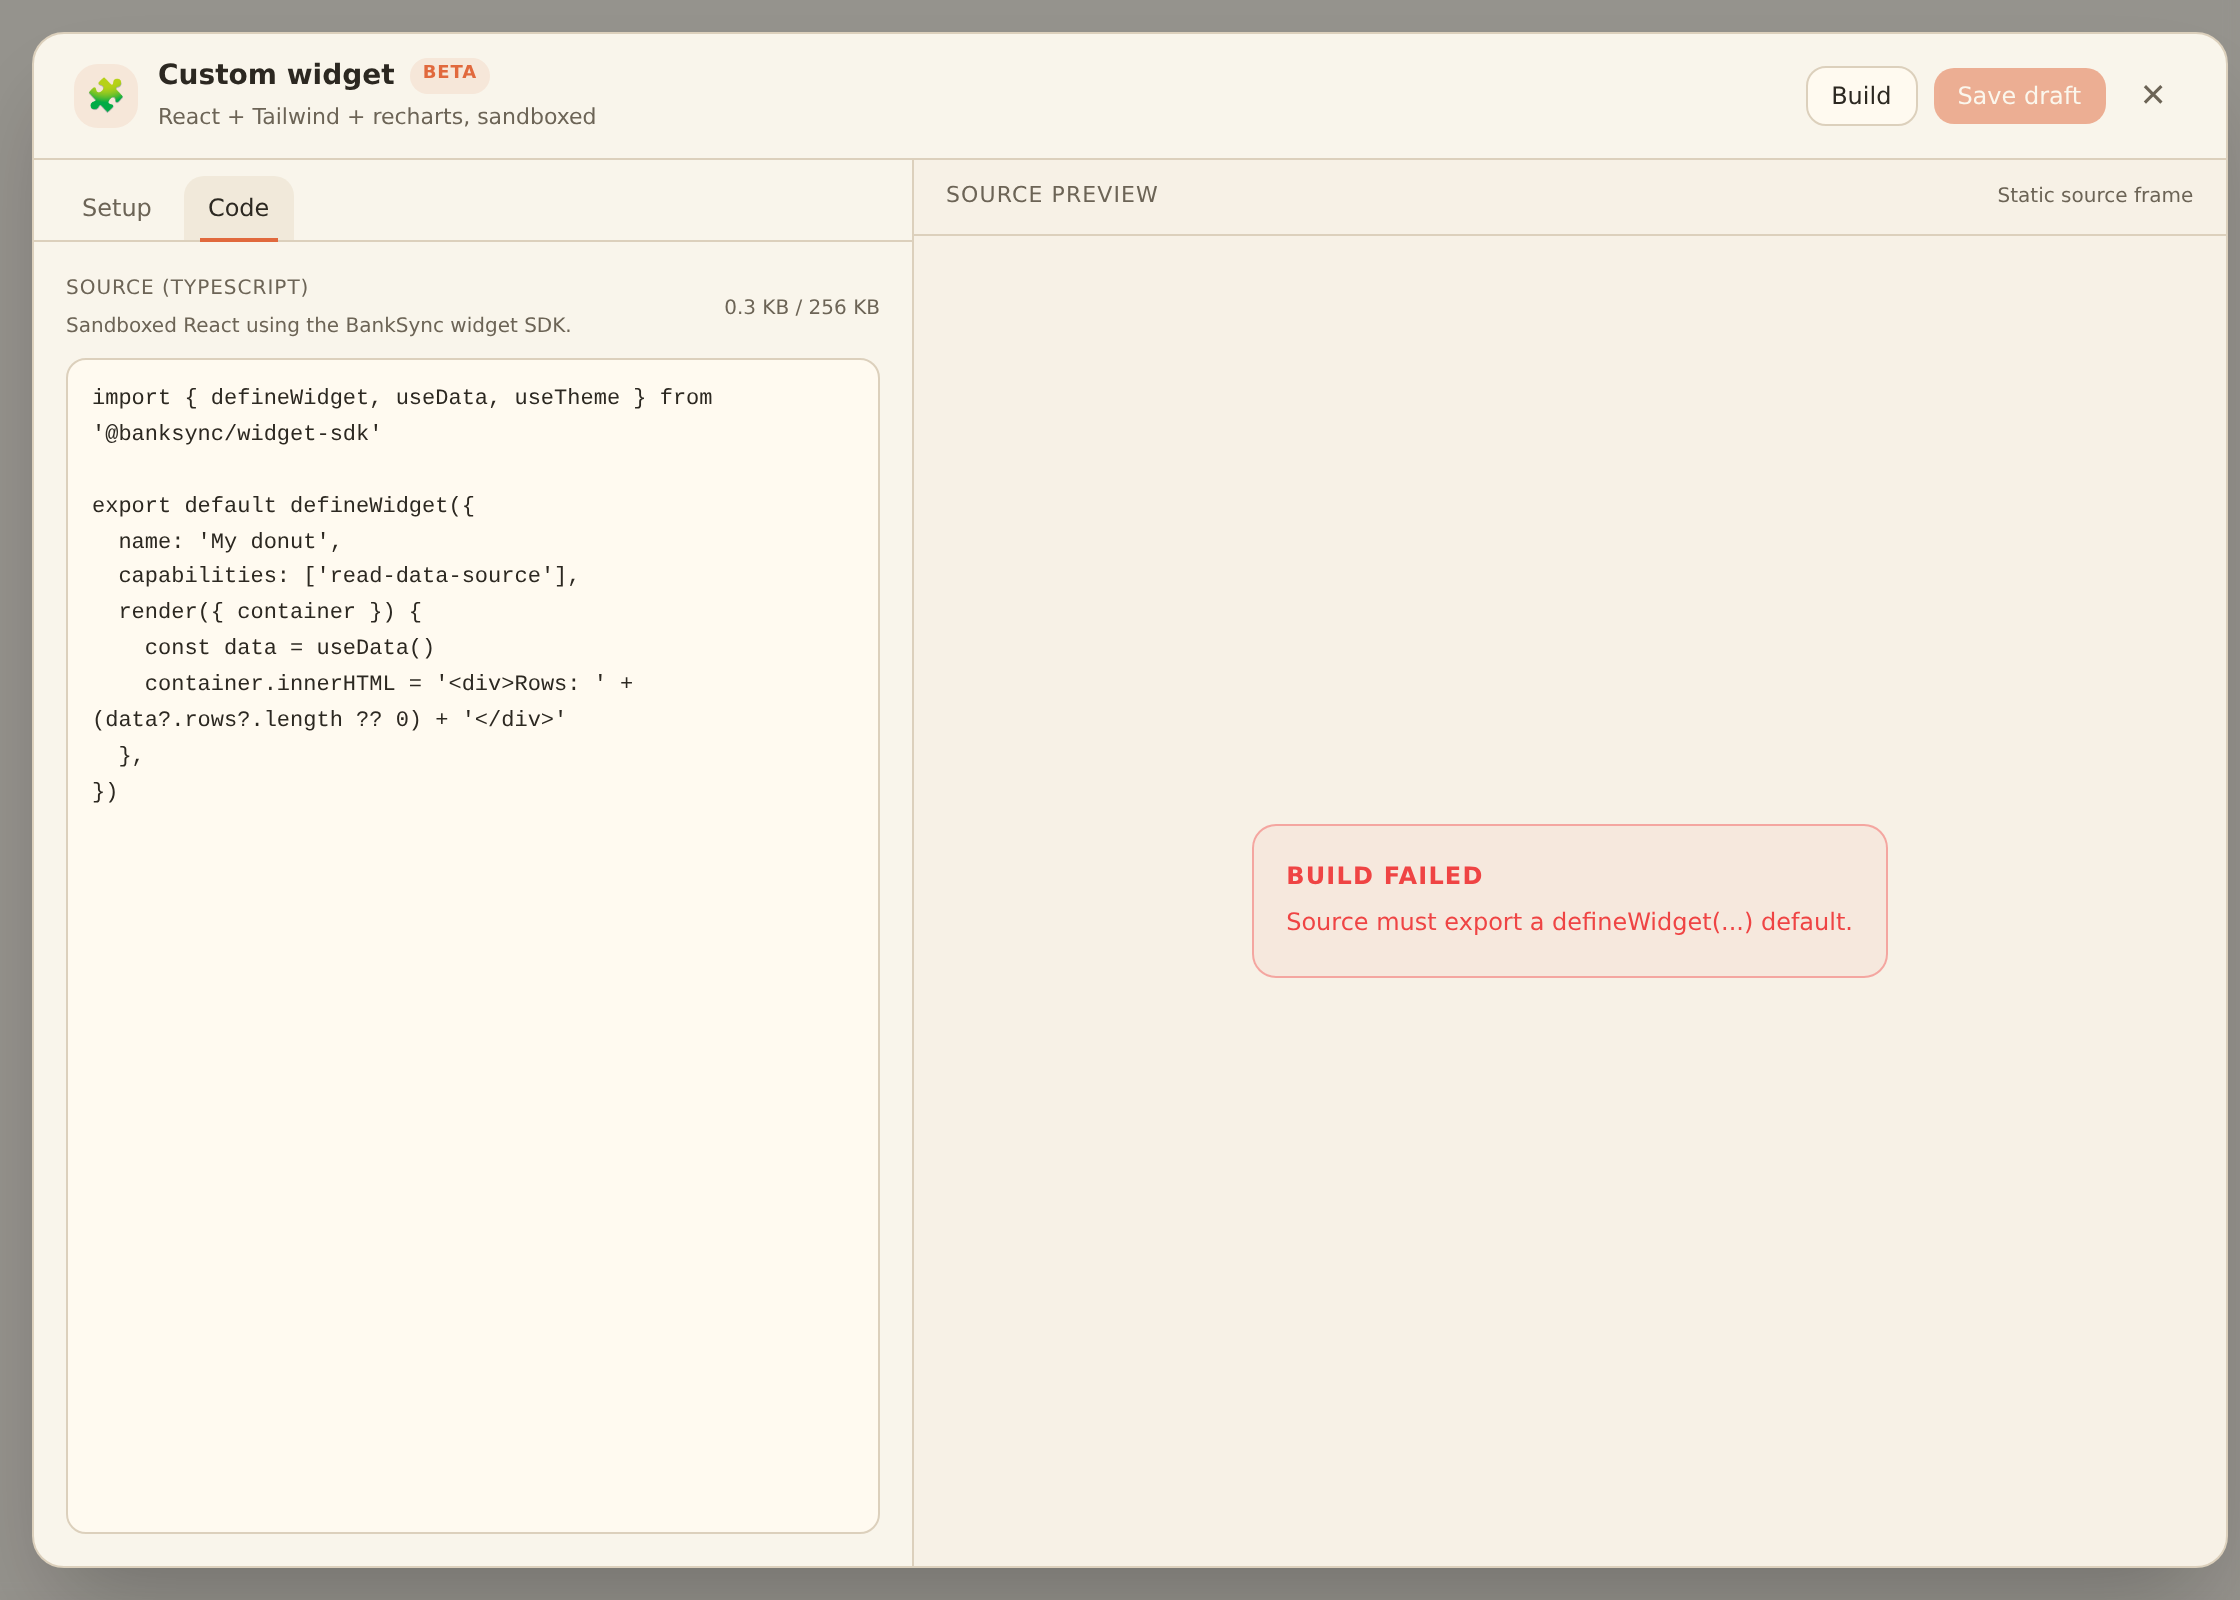
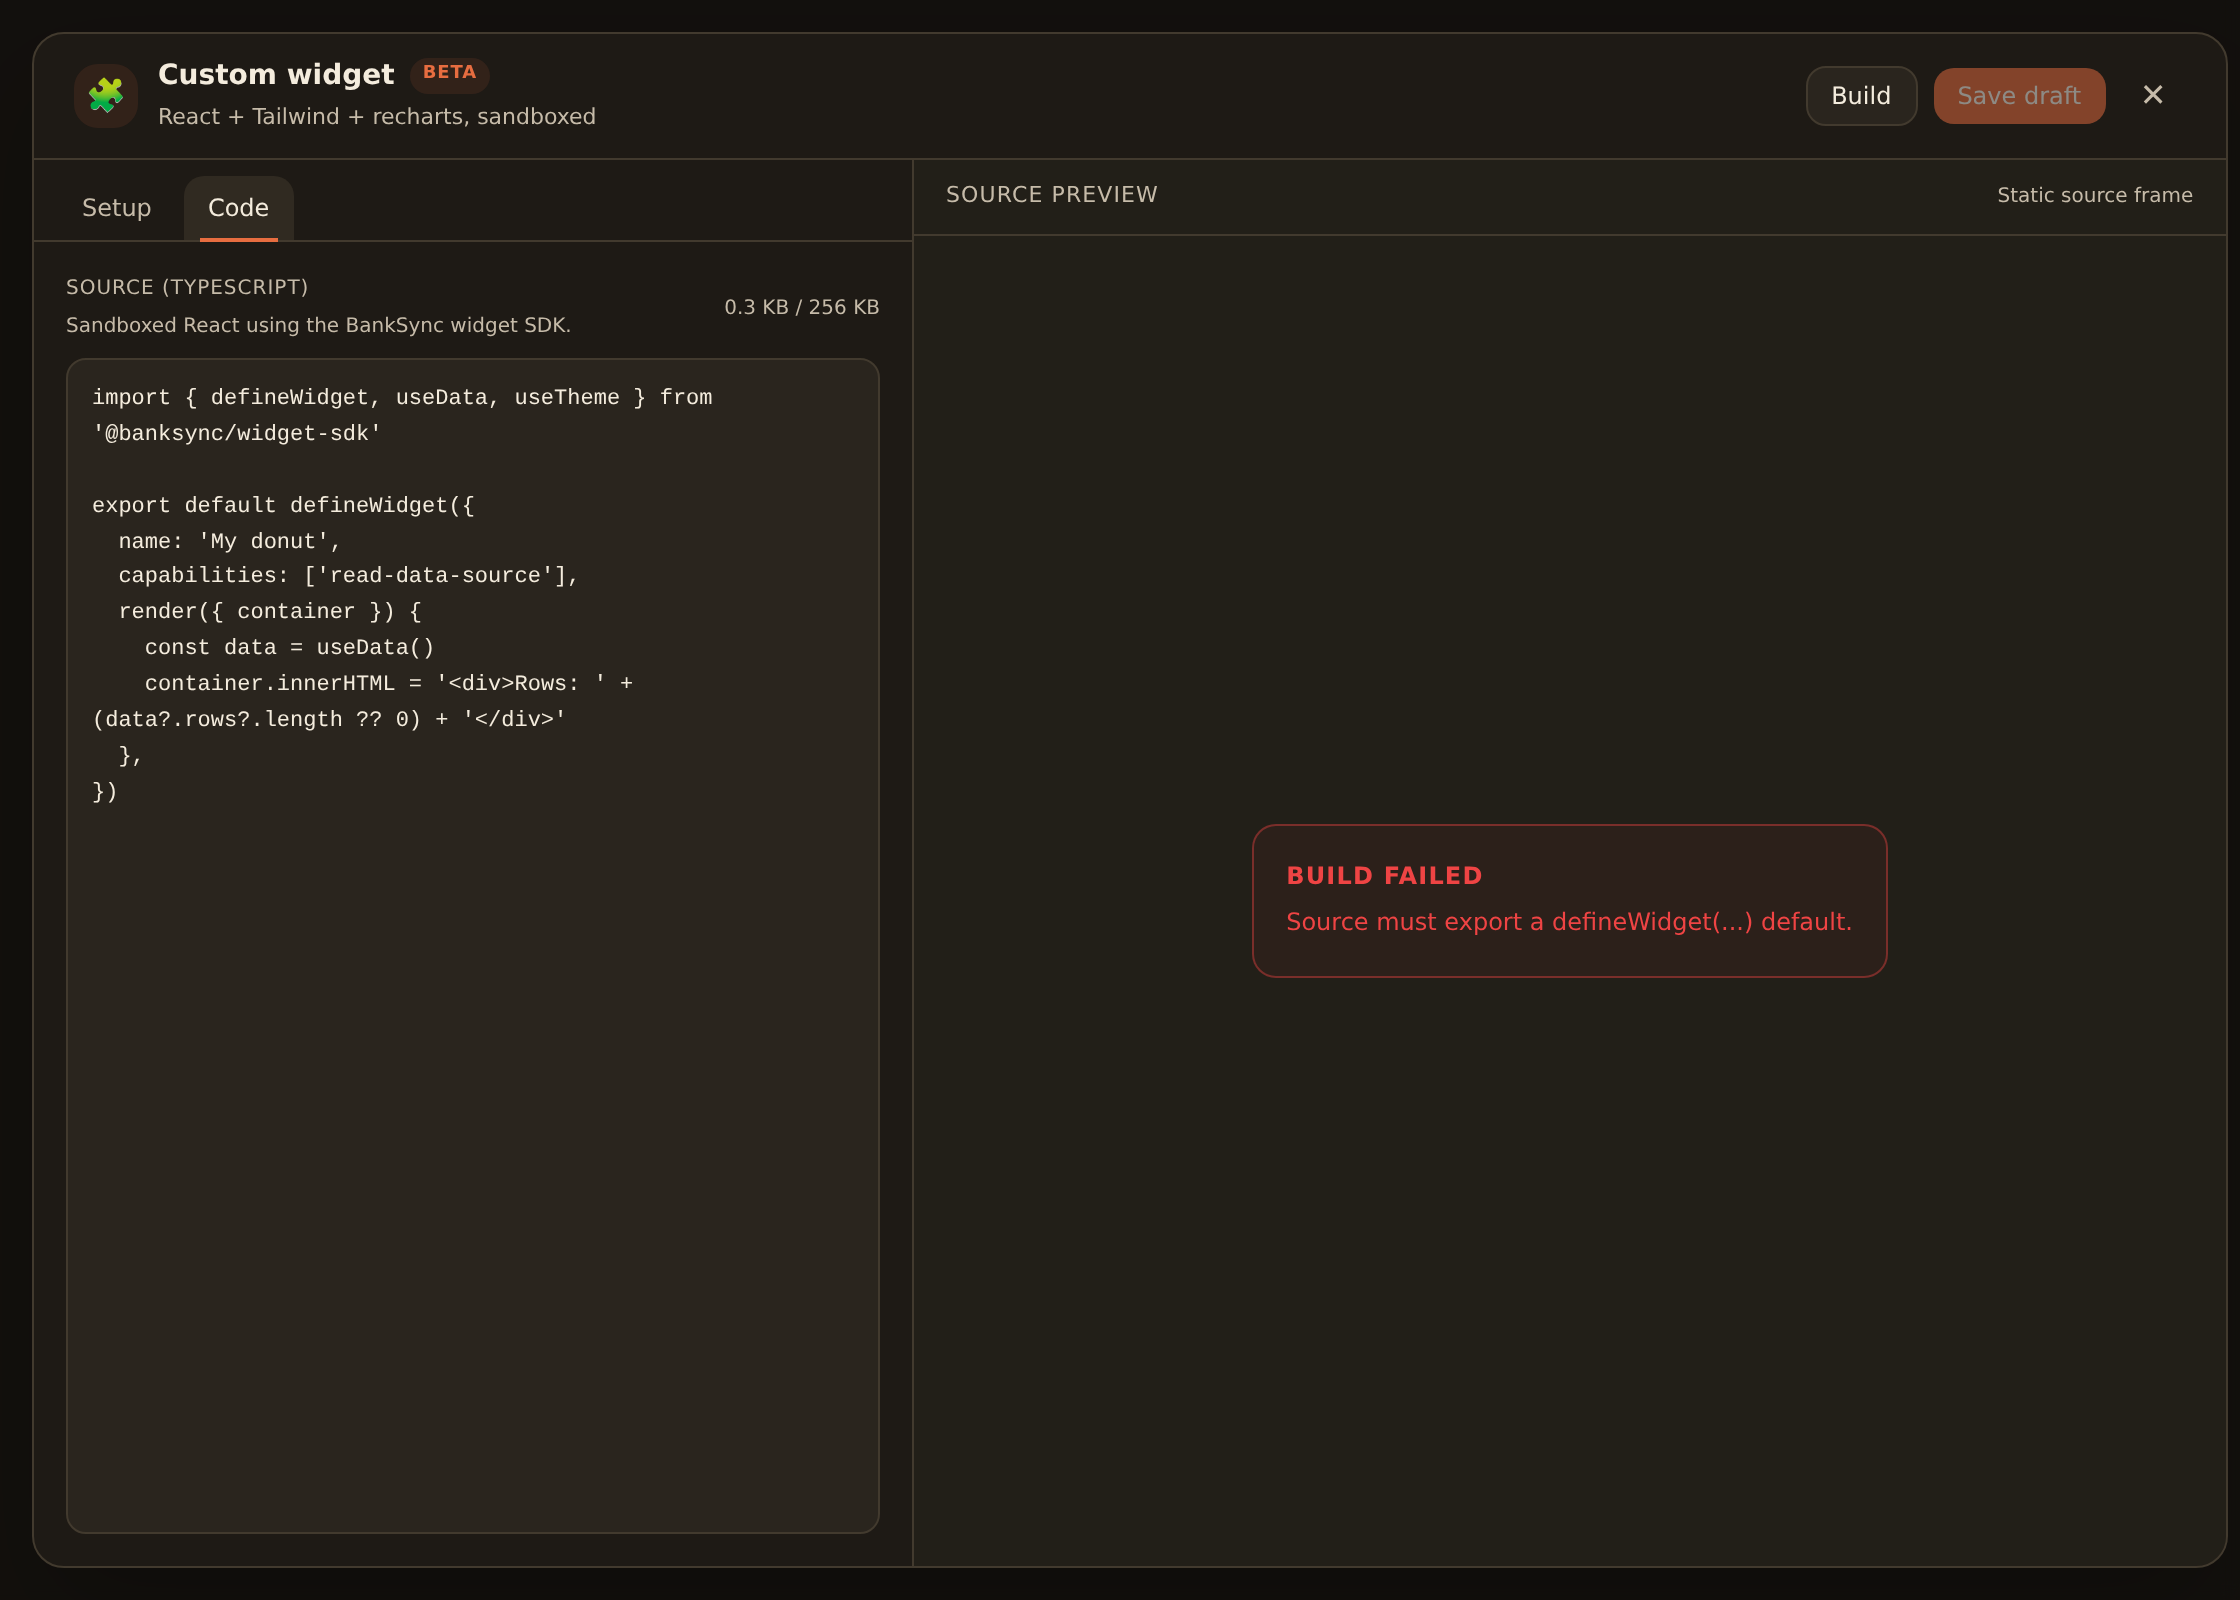
Why did my custom widget fail to build?
Why does a custom widget say permission required?
The saved package version, data binding, or requested capabilities do not match a live grant. Ask a workspace administrator to review it. Rebuilding, upgrading, or changing an input deliberately invalidates the old approval; changing an ordinary display setting does not.
Why does an input say Needs mapping?
A required canonical field is missing or incompatible in the selected source. Pick another bank or feed, or repair the mapping. BankSync will not silently substitute an unrelated field. If the package is missing or archived, reinstall a supported version instead.
What does protocol mismatch mean?
The installed bundle targets an SDK/protocol the sandbox cannot run. Legacy v1 widgets use the v2 compatibility runtime; new package widgets use SDK API 3/protocol v3. Install a compatible package version rather than editing the persisted protocol number.
What do the widget error messages mean?
The canvas can hide a connection problem
Still stuck?#
If a widget keeps erroring after you have checked its data and fields, the underlying feed may need attention (a reconnect or a re-sync). See Bank feeds troubleshooting, or reach out and we will help.
Contact support
Use this page with your AI assistant
Every BankSync doc is available as plain Markdown for agents and LLMs.