Creating Your First Dashboard
Start from a blank canvas, a template, or an AI agent, learn the editor layout and keyboard shortcuts, and understand how autosave and drafts work.
6 min read
On this page
A new dashboard starts as a blank canvas. You add widgets to it, arrange them on a grid, and BankSync saves your work as you go. This guide covers what you see when you land, the editor layout, the keyboard shortcuts that speed it up, and how drafts and autosave behave.
No data source is required to begin
Availability
Start a new dashboard#
Open Dashboards in the left navigation and choose New dashboard. You land on an empty canvas with the widget library already open on the right. A card in the middle of the canvas reads Nothing here yet, with the subtext "Ask a question or pick a chart to start." This card is your launch pad. Existing dashboards keep the library closed until you request it, preserving the full canvas for reading and editing.
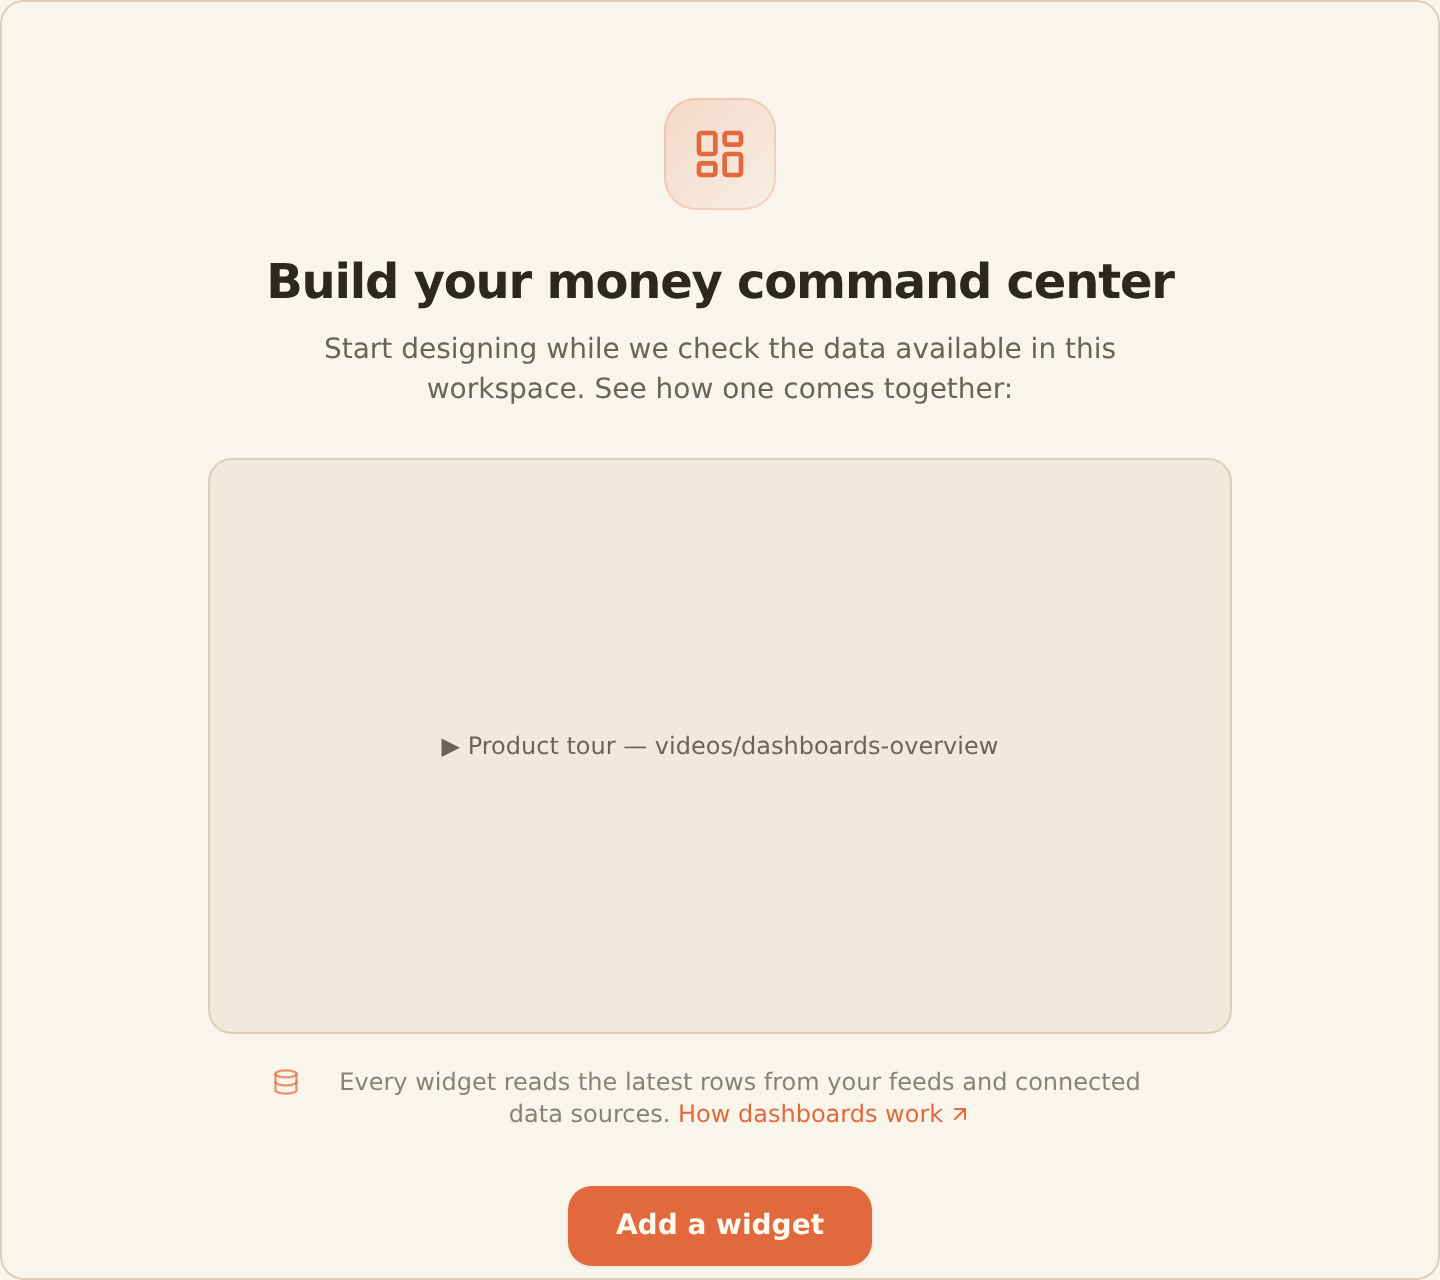
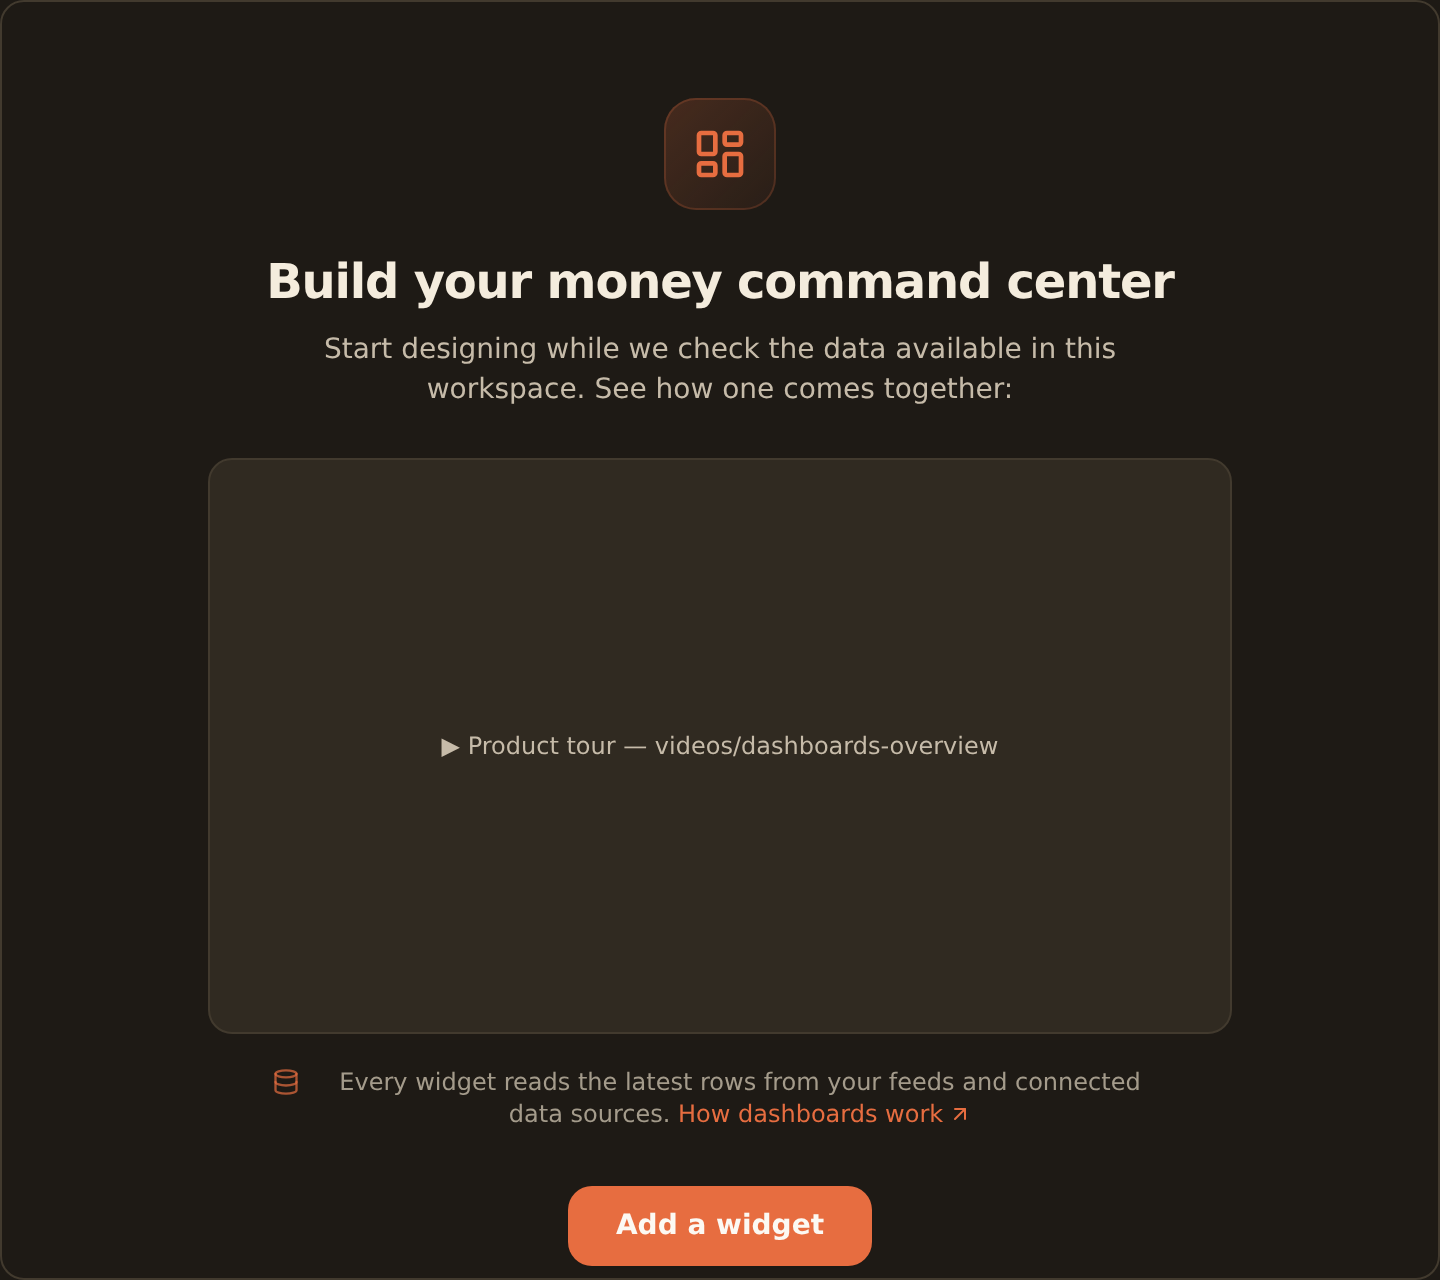
From that card you can start in any of these ways:
Add a widget
The primary button. It focuses the widget library on the right so you can describe a chart, pick from suggestions, or browse chart kinds. If no compatible source exists, the widget keeps its place and guides you to connect a bank, create a table, or set up a feed.
Pick a chart kind
Jumps straight to the chart picker so you can choose a shape (line, bar, KPI, and so on) before binding it to your data.
Browse dashboards
Takes you back out to your existing dashboards if you opened a new one by mistake.
If you have opened dashboards before, a Recent: row of chips appears under the buttons so you can jump back into one. On a brand-new dashboard, a Start from a template gallery also appears below the card. Picking a template builds a ready-made dashboard for you and opens it, which is the fastest start if you are not sure what to chart. See Dashboard templates for the full list.
More than one way in
The editor at a glance#
Once you start adding widgets, the editor settles into three regions. A widget is a single tile (a chart, a big-number KPI, or a table); the canvas is the grid they sit on; and the inspector is the right-hand panel where you configure whichever widget you have selected.
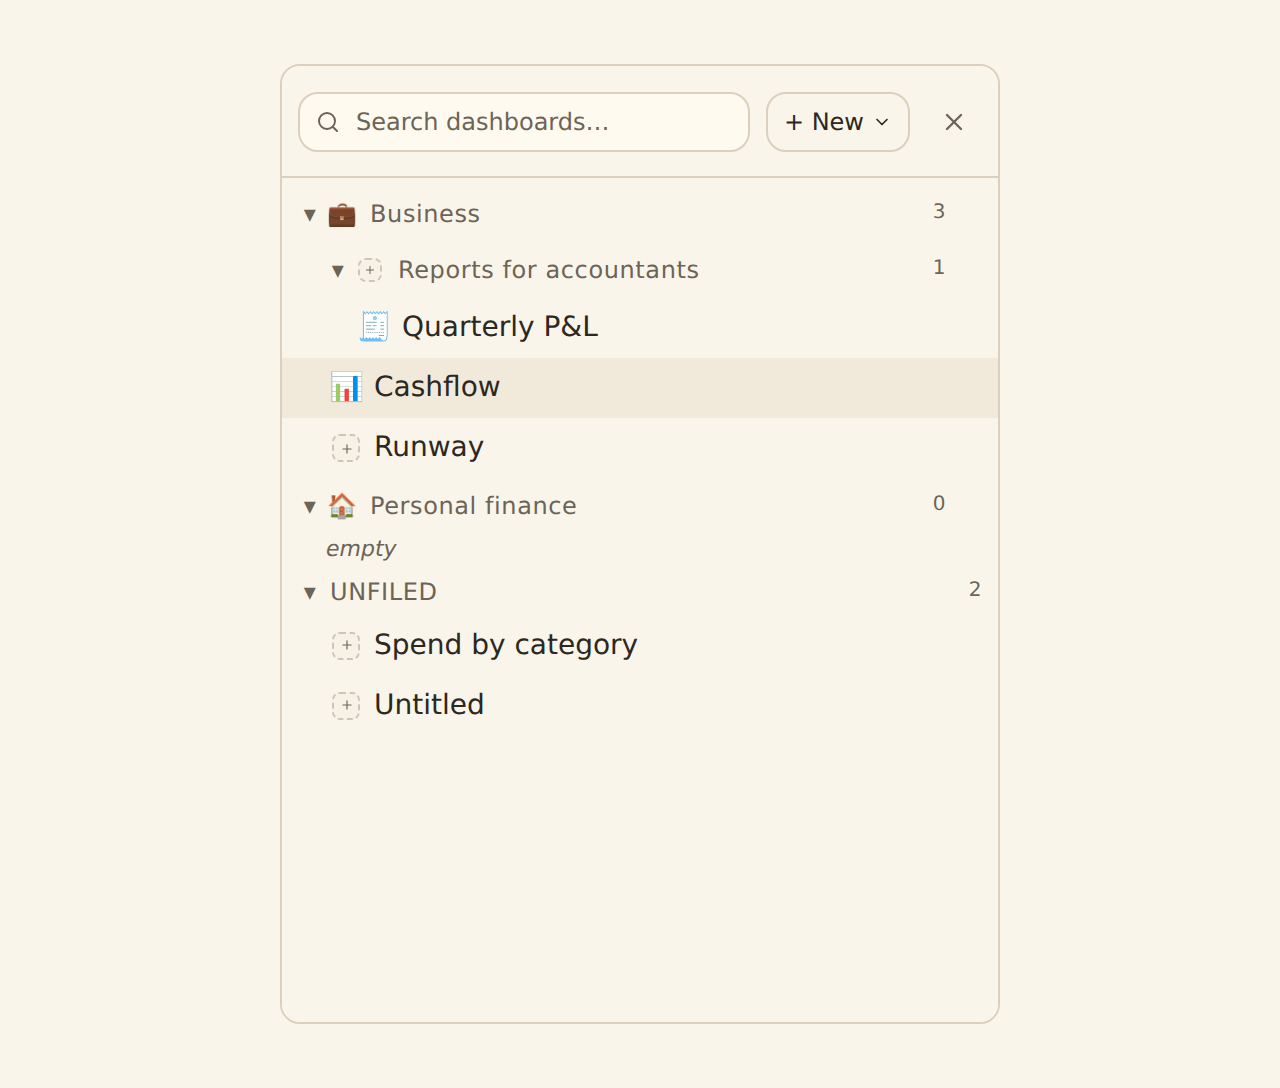
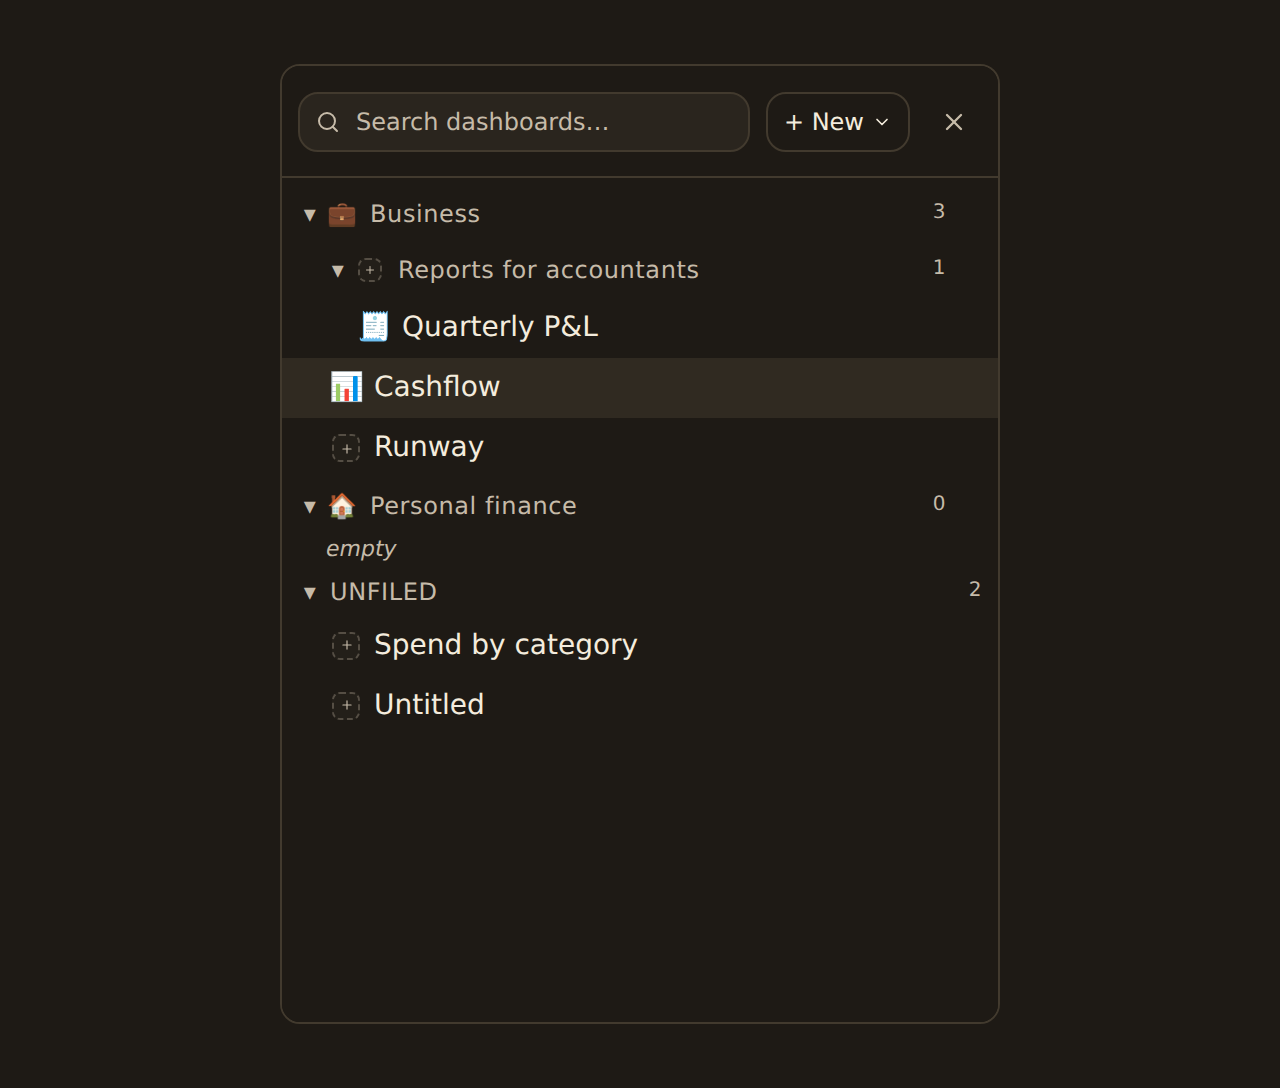
Content tree (left)
Your dashboards and folders. Show or hide it with the left bracket key ([) so the canvas can
use the full width.
Canvas (center)
The grid your widgets live on. Drag a widget to move it, drag an edge to resize.
Inspector & library (right)
Add widgets from the library, then configure the selected widget in the inspector.
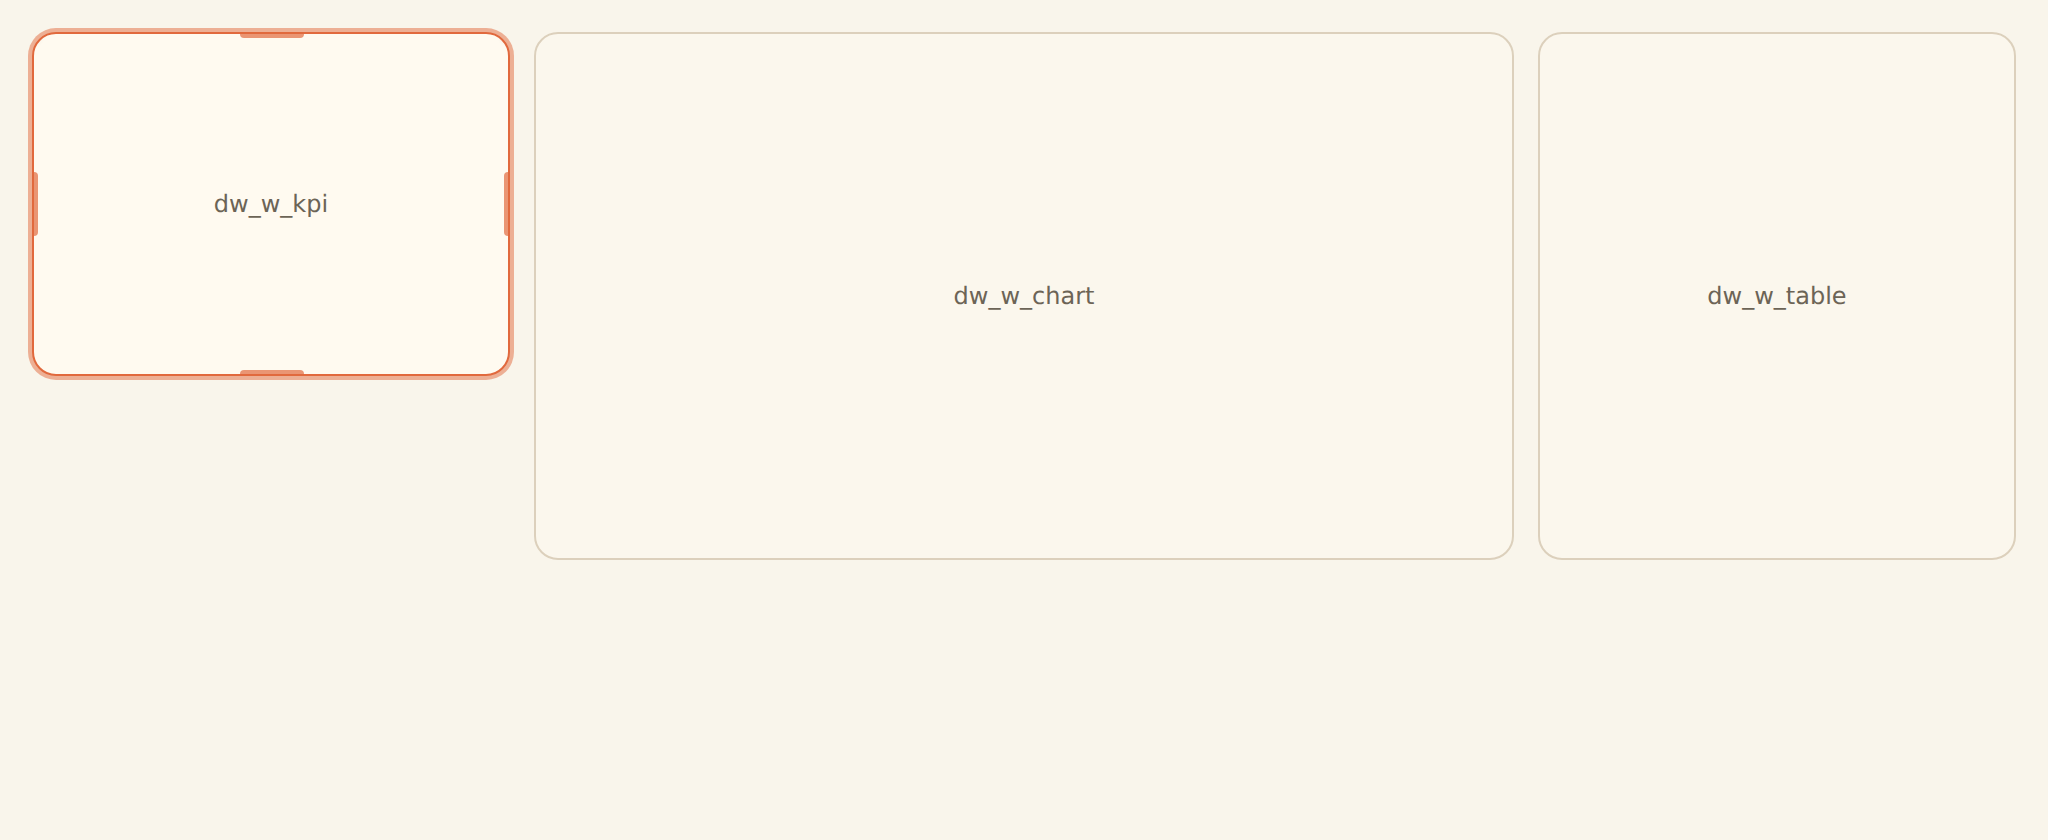
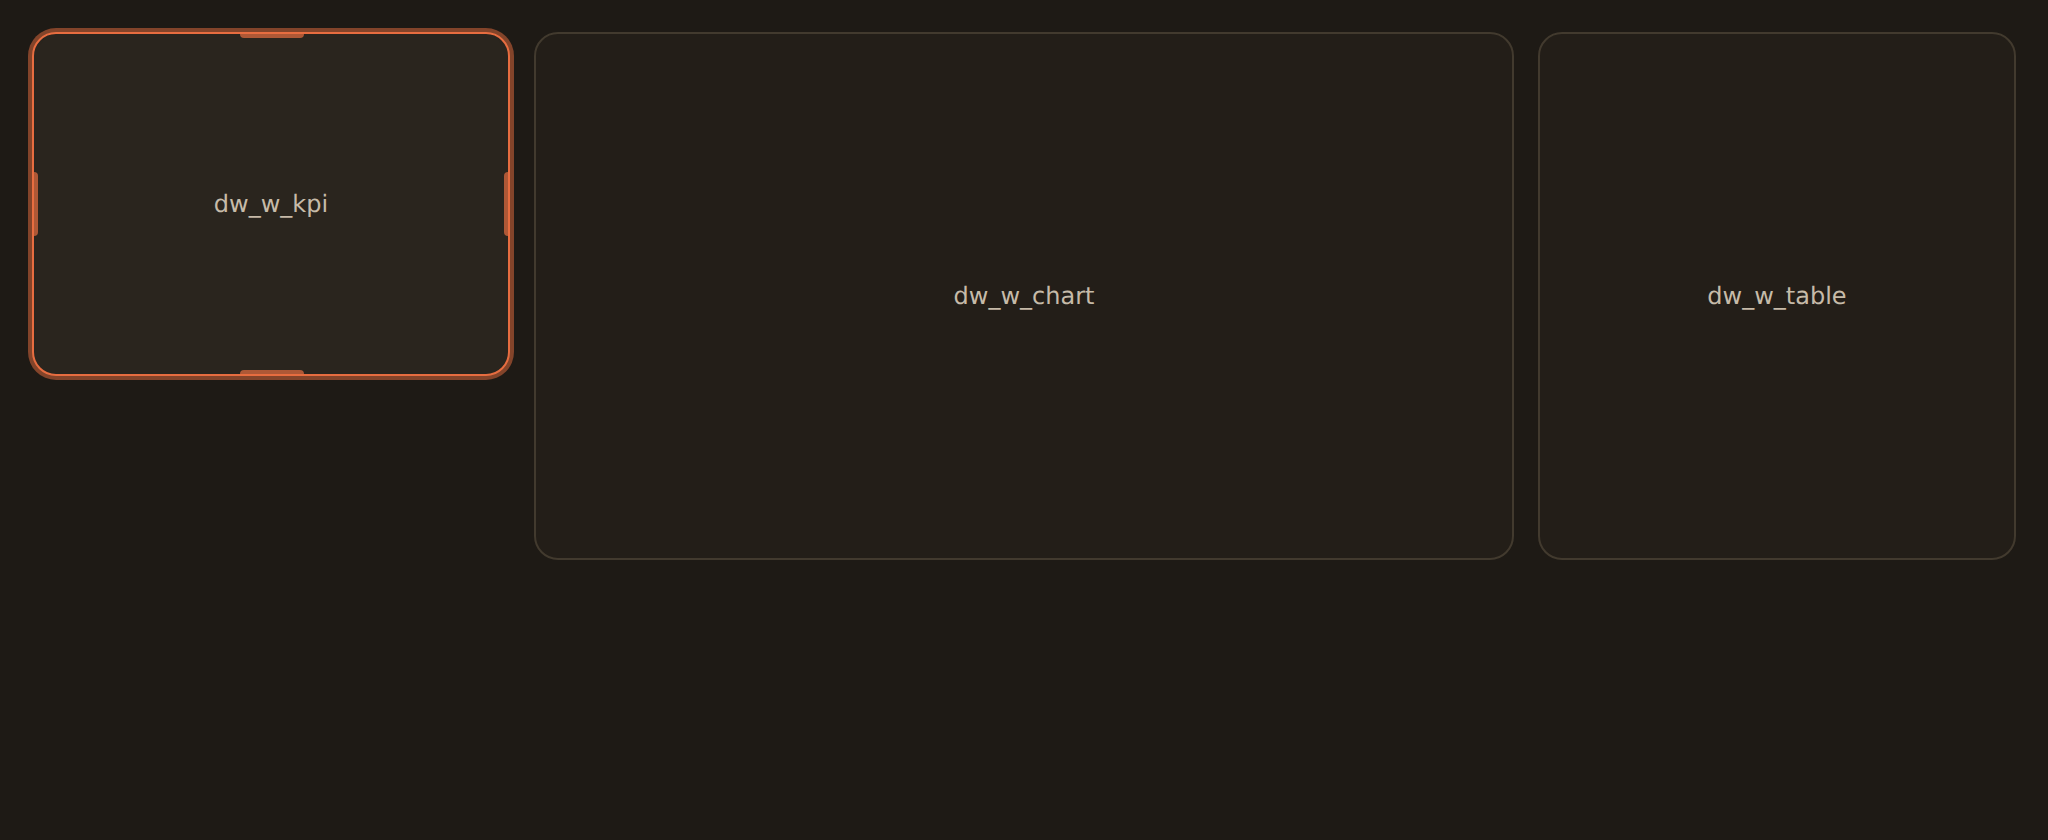
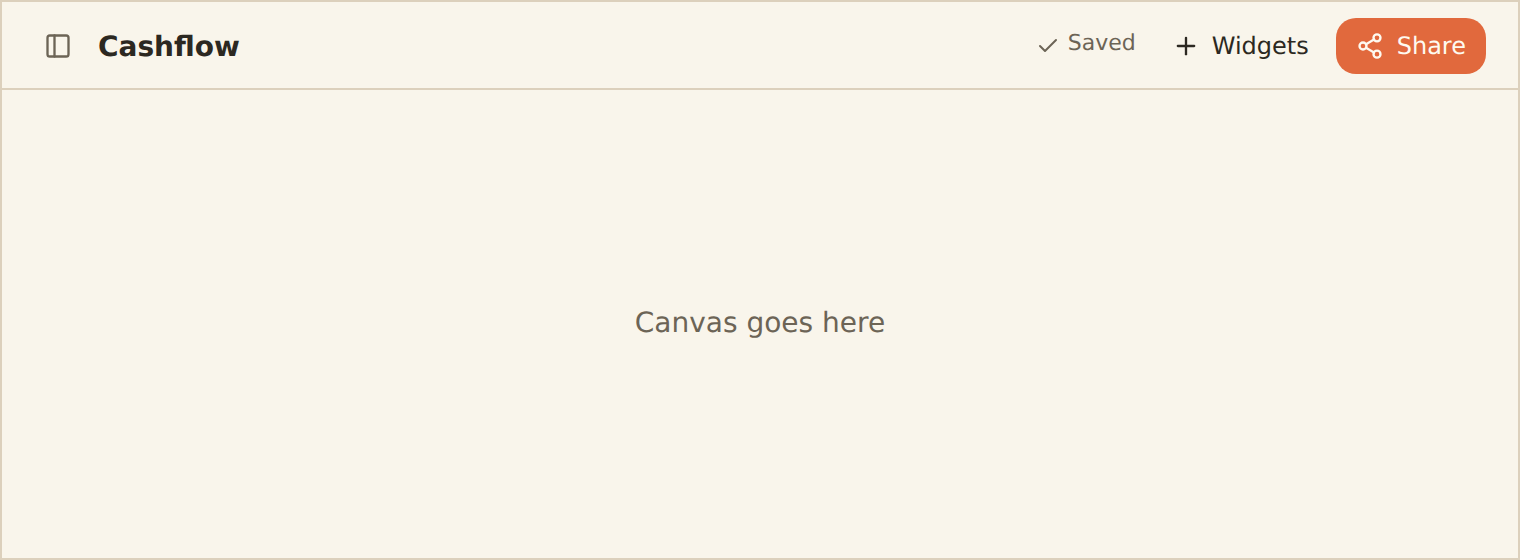
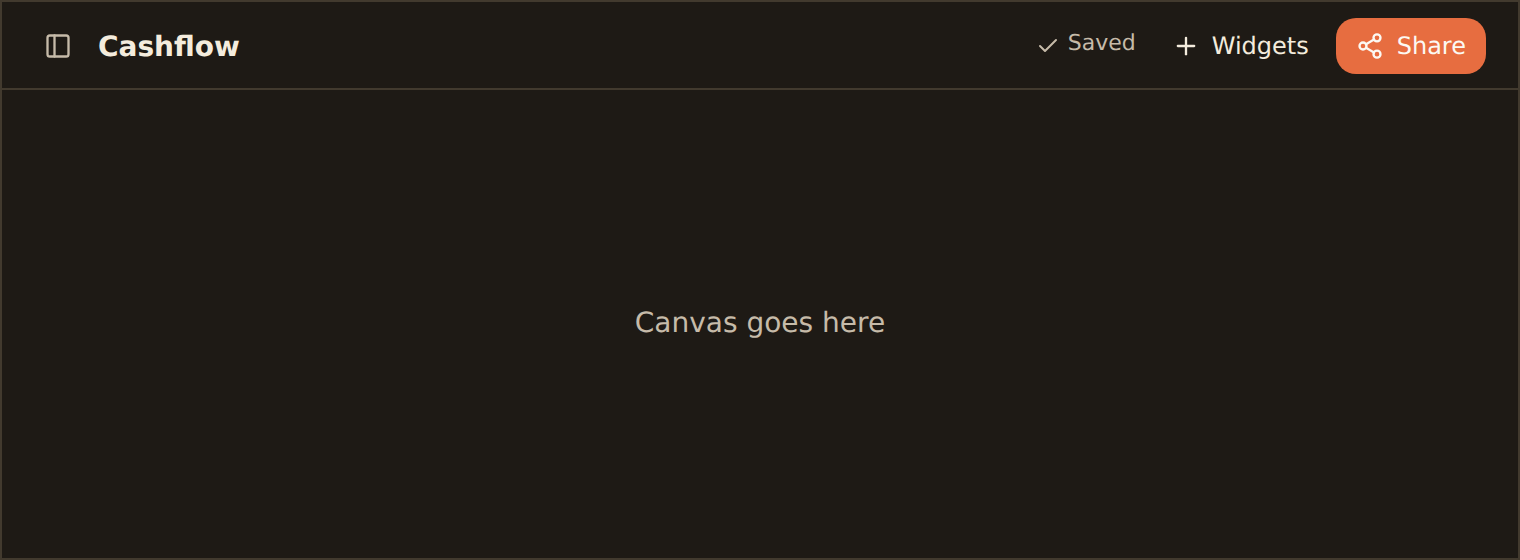
The strip across the top is the editor toolbar. It carries the action buttons you reach for while editing: Undo and Redo, the Filters toggle, Fullscreen, Widgets (the library), and Share.


Keyboard shortcuts#
A few keys make the editor faster. They work whenever your cursor is not in a text field.
[ — Dashboards
Show or hide the content tree on the left.
] — Library
Show or hide the widget library on the right.
f — Fullscreen
Hide the navigation and both side panels for a distraction-free, full-width canvas. The matching toolbar button is labeled Fullscreen (and Exit fullscreen while you are in it).
Undo and redo
Drafts and autosave#
A brand-new dashboard is a draft: an unsaved scratch space that does not appear in your dashboards list yet. BankSync turns it into a real, saved dashboard the moment you do something meaningful with it.
When a draft becomes a saved dashboard
You name it
Give the dashboard a title in the toolbar.You add your first widget
Drop a widget onto the canvas, connected or not. Both are meaningful design work and preserve their exact layout position.
You add your first filter
Create a dashboard filter.You pick a template
Choosing a template from the launch card builds and opens a saved dashboard right away, with no naming or widget step required.
As soon as one of those happens, the dashboard is saved, its address in your browser changes to its permanent link, and it shows up in your dashboards list. From then on, every change saves automatically a moment after you make it. The toolbar shows Saving while a change is in flight and Saved once it is stored. There is no Save button to press.
Exploring will not create a stray dashboard
Sharing needs a saved dashboard
A quick worked example#
Here is a start-to-finish run so you can see how the pieces fit together:
Build a 'Cashflow' dashboard
Open a new dashboard
From the Dashboards page, choose New dashboard. The "Nothing here yet" card appears.
Name it
Type "Cashflow" into the title field in the toolbar. The dashboard saves and gets its own link the moment you name it.
Add your first widget
Click Add a widget to open the library, then describe what you want, for example "spending by month", and add the suggested chart to the canvas.
Arrange it
Drag the widget where you want it and drag an edge to resize. The toolbar flashes Saving, then Saved.
Keep going
Add more widgets the same way. Everything you do keeps saving on its own, so you can close the tab whenever you like.
Create with an AI agent (beta)#
You do not have to build everything by hand. If you drive BankSync through an AI agent (for example Claude), the agent can create dashboards, folders, widgets, and queries for you using BankSync's dashboard tools, then publish them. This authoring path is in beta and currently available in staging environments only, so it may not be present in your production workspace yet. The in-app Ask tab in the widget library offers a similar plain-language on-ramp without an external agent (see Adding widgets).
Related guides#
- Adding widgets: the four ways to add a widget to the canvas.
- Pick a chart kind: the full catalog of chart shapes and when to use each.
- KPI, table & gauge widgets: the non-chart widgets for single numbers, formatted rows, and goal dials.
- Organizing dashboards: folders, renaming, and the content tree.
- Dashboard templates: start from a prebuilt dashboard instead of a blank one.
Add your first widget
Use this page with your AI assistant
Every BankSync doc is available as plain Markdown for agents and LLMs.