An investment portfolio tracker can use separate holdings, trades and balance feeds, related security and account Tables, and a dashboard for allocation, concentration, cash and activity.
What this system should answer
It should show current holdings, allocation by asset class and account, cash, concentration, recent trades and data freshness. Performance, income and tax lots require additional price, cash-flow and cost-basis policies and should not be inferred from a holdings snapshot alone.
BankSync works best when each layer has a clear responsibility. Feeds collect one data type from selected accounts. Enrichments transform, guard, watch or learn from rows before writing. Tables store typed or custom relational data. Dashboards query that evidence and present KPIs, charts, filters and detail.
Preserve original amount, currency, date, account and provider identifier. Add personal or management classifications in separate fields. That separation is what makes a custom tracker trustworthy rather than merely attractive.
Model the evidence first
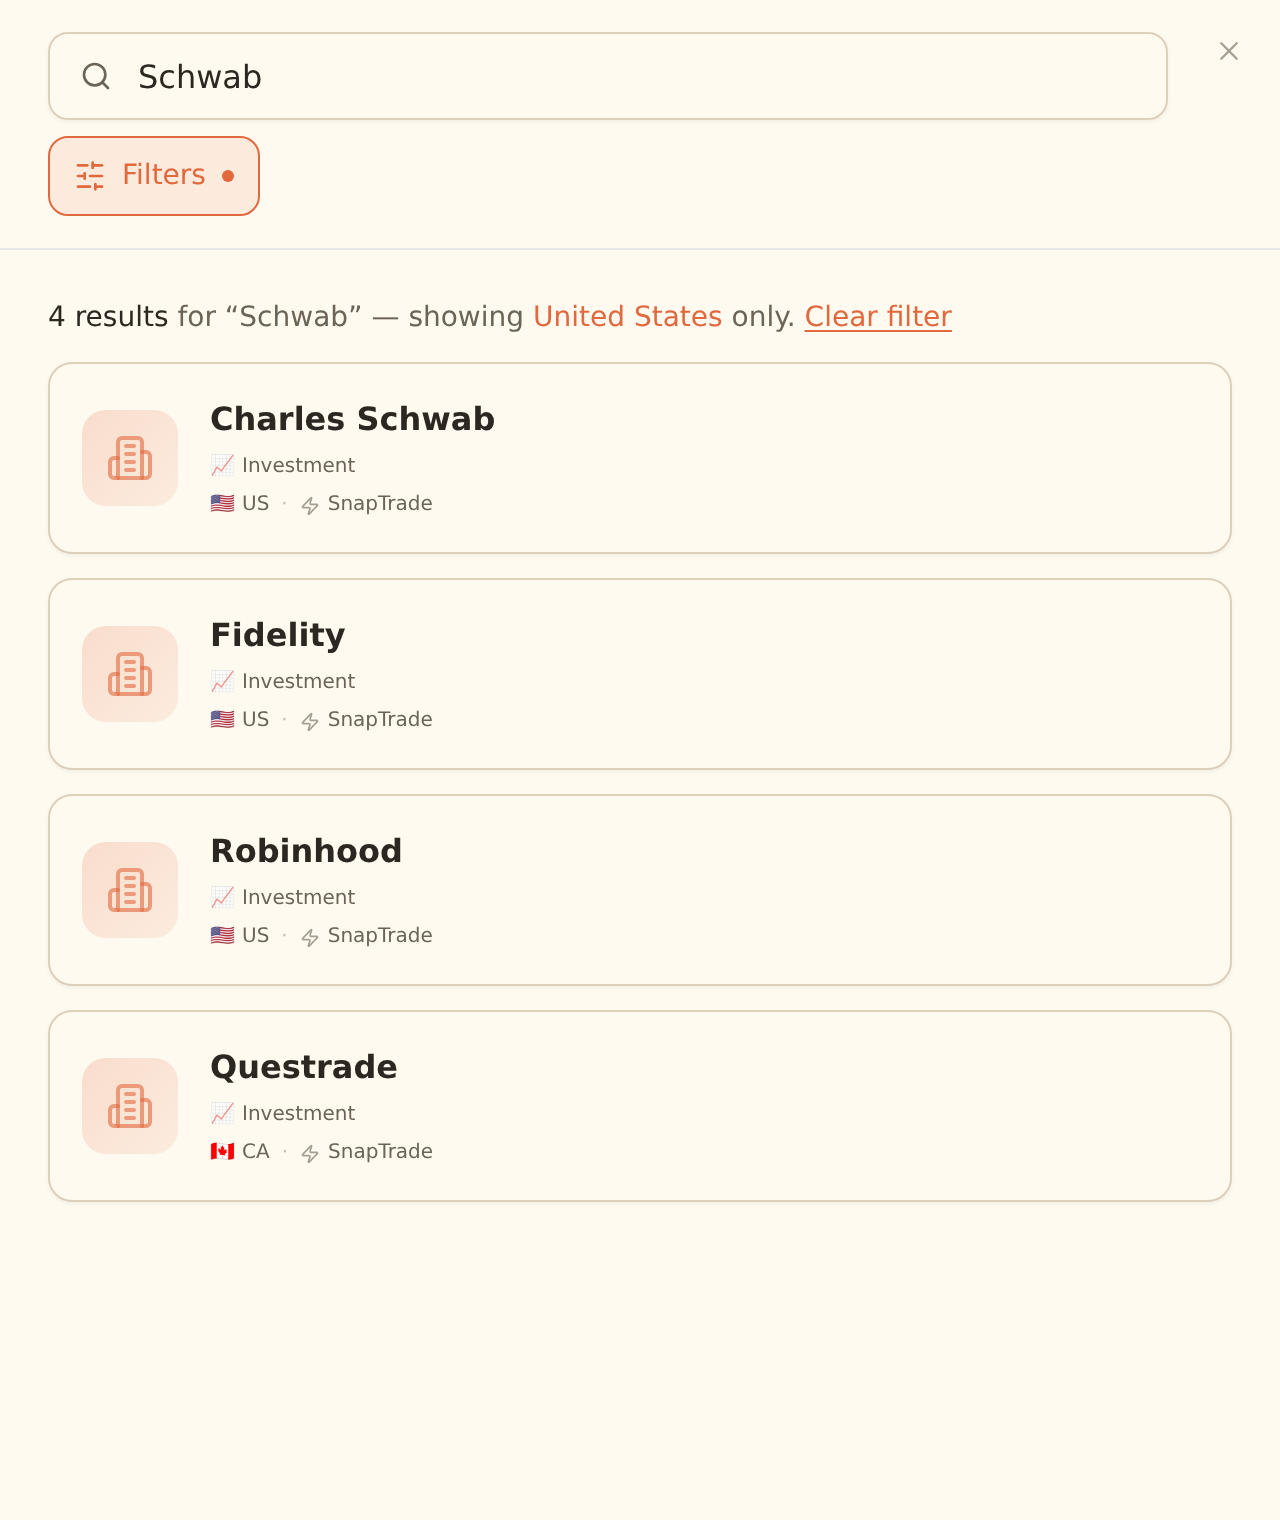
Create Securities, Accounts, Holdings and Trades Tables. Relate holdings and trades to the correct security and brokerage account. Preserve quantity, instrument identifier, quoted currency, cost basis when available and observation time. Use a custom classification for asset class, region and strategy. A holding snapshot records state; a trade records an event. Never merge those semantics.
Use relations instead of repeated labels
Create reference Tables for concepts that have their own properties: assets, liabilities, securities, categories, vendors or budget periods. Relate financial rows to those records, then use lookups, counts and rollups. Rollups can calculate sums, averages, medians, ranges, date extrema, percentages and option counts; formulas can read same-row and related values and produce stored, sortable, filterable results.
Choose views deliberately
Grid is the general editing surface. Board writes status when cards move. Calendar and Timeline write date fields when items move. Gallery suits attachment-led records, List provides a calm summary and Form adds rows. Views may be shared or personal and save filters, grouping, sorting, columns and row colours.
Aggregate safely
Calculate current exposure from quantity and an explicit price source. Preserve quoted currency. A portfolio return needs time-weighted or money-weighted methodology and complete external cash flows; a simple change in market value is not automatically investment performance. BankSync uses strict multi-currency aggregation by default. Any converted reporting amount should keep the native amount, currency, exchange rate and rate date visible.
Keep the investment records separate
| Feature | Holdings | Trades | Balances |
|---|---|---|---|
| Meaning | What is owned at a point in time | Buys, sells and other events | Cash or account state |
| Best dashboard use | |||
| Common mistake | Treating a snapshot as performance | Losing the link to the security | Adding every historical observation |
Build the portfolio model
Define scope
Choose accounts, asset classes and currencies.
Connect brokerages
Verify supported institutions.
Create holdings and trades feeds
Keep snapshot and event data separate.
Model securities and accounts
Use stable relations.
Add classification policy
Map asset class, region and strategy.
Choose valuation inputs
Record price source and time.
Build allocation and holdings views
Show concentration and drill-down.
Document performance method
Do not imply returns without complete inputs.
Copy this build: the two-broker portfolio observatory
Imagine an investor with an index portfolio at one brokerage and individual shares at another. The first build should answer allocation and concentration before attempting advanced performance analytics.
Create Securities and Accounts Tables. Relate each holding and trade to a stable security record and the correct brokerage account. Preserve quantity, quoted currency, observation time and any available cost basis. Add reviewed fields for asset class, region and strategy.
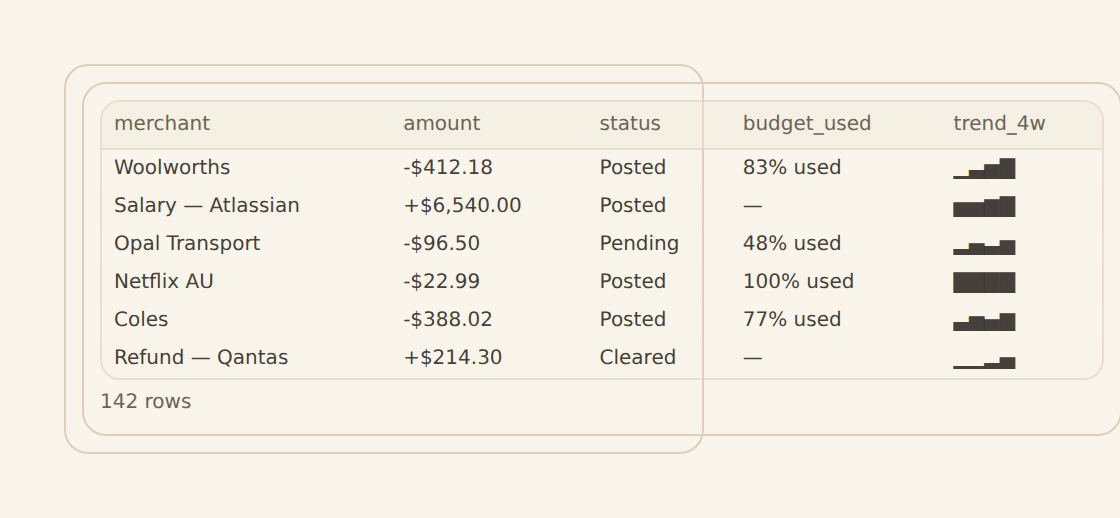
Build a holdings table, allocation chart, cash KPI, largest-position KPI and recent-trades table. If performance is added later, document the method and make sure prices and external cash flows are complete. A change in market value is not automatically a return.
What success looks like after one week
The investor can compare both brokerages in one view while holdings, events and cash remain distinct—and no chart implies a performance methodology that has not been implemented.
Dashboard and operating design
Use KPIs for portfolio value, cash and largest concentration; allocation rings or treemaps; a holdings table with quantity, value, weight and source time; and a recent-trades table. Filters by account, asset class and currency should recompute totals at the source.
Apply filters at the source when they change aggregates. Browser-only filtering is a presentation option, not an access-control boundary. Where a view is scoped to a household member, account or entity, use a locked source-applied filter that fails closed.
Enrichments and watches
Rules and lookups can map instruments to asset classes and strategies. Alert can watch a position or cash movement threshold. Feed Monitor watches stale brokerage feeds. Anomaly Detector is designed around transaction behaviour and should not be presented as market-risk analytics.
Guard steps run first, followed by Memory, lookups, rules, AI fill and finally watch enrichments. Suppressed records never write, teach Memory or fire alerts. Use Live Preview before enabling hard filters, splits or suppression. Alert freshness follows the feed schedule.
Limitations and controls
BankSync supplies financial records and dashboard primitives, not market advice, price guarantees or tax-lot accounting. Verify brokerage coverage, quoted currency and price timing. Corporate actions and derivative semantics may need specialised modelling.
Dashboards are beta by workspace. Public links and indexed tiers are for intentional public data, not personal finance. External-agent authoring is a staging workflow; open and review generated dashboards in the normal editor.
Operate the tracker
Check feed history before trusting a quiet chart. Review exceptions and low-confidence categories on a regular cadence. Document formulas, filters and model changes. A reliable tracker is one whose total can be reproduced from source rows and explicit assumptions.