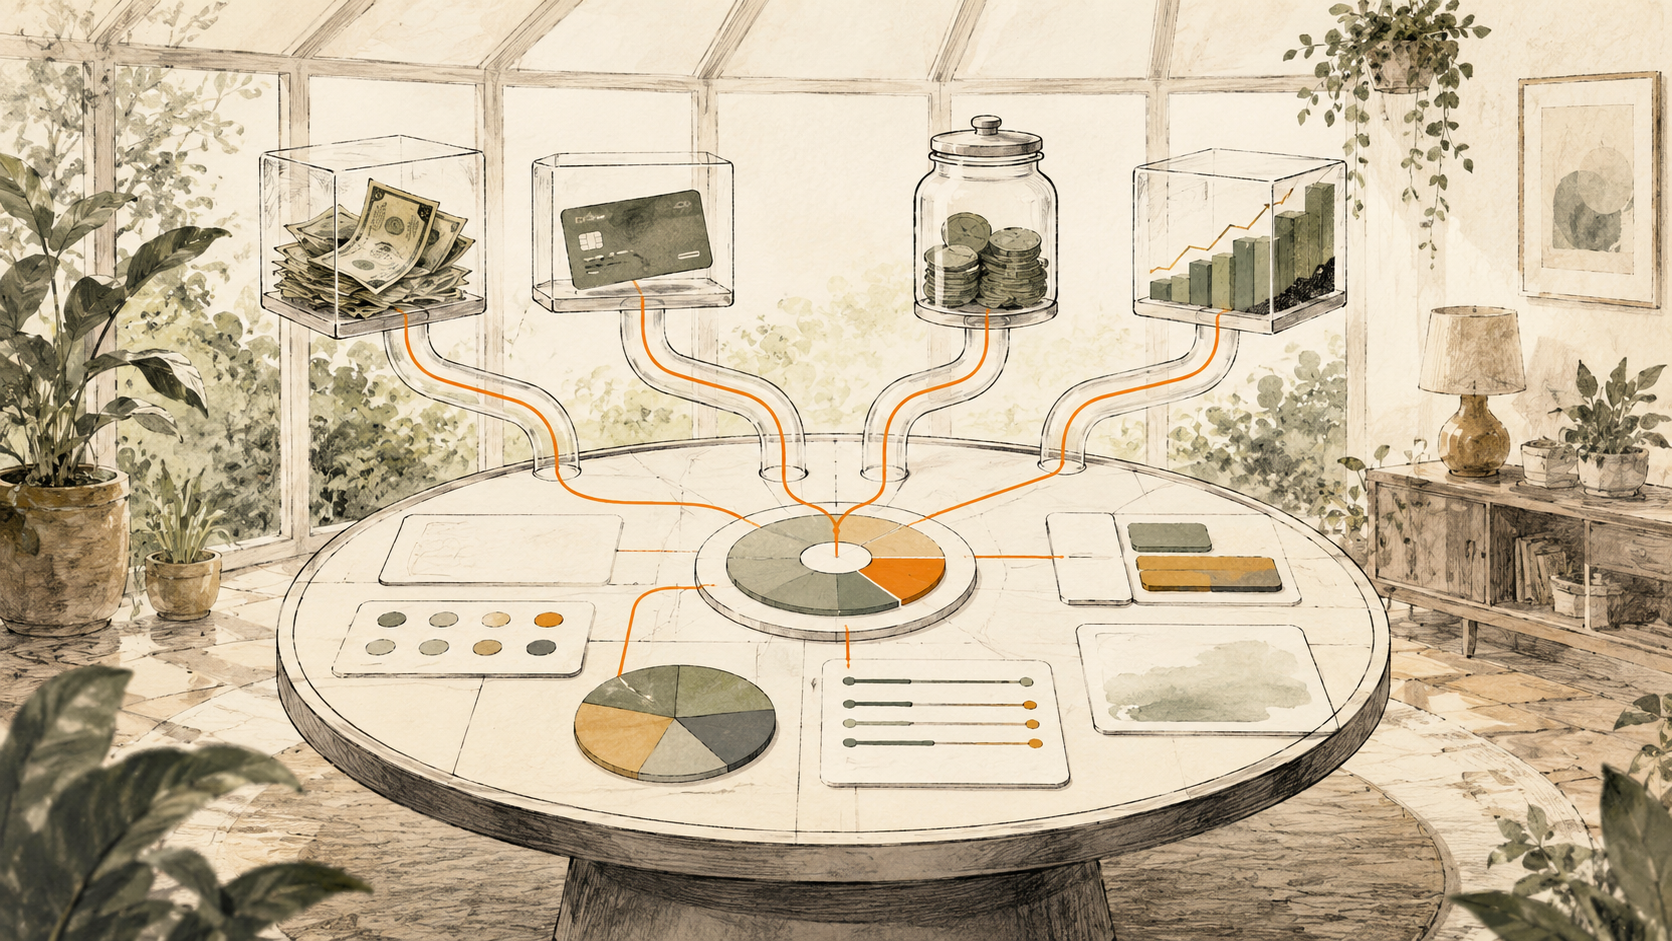
A personal finance dashboard can be assembled from separate transaction, balance and investment feeds, an enrichment pipeline for categories and recurring spend, a relational Table model and a small set of decision-focused widgets.
What this system should answer
A calm daily view should show cash, monthly inflow and outflow, savings rate, budget status, recurring commitments and recent transactions. Net worth and investments deserve separate modules because they use different sources and update rhythms.
A reliable build starts below the visual layer. BankSync Feeds collect one data type from selected accounts and send it to one or more destinations. Enrichments transform, guard, watch or learn from records in a defined order. BankSync Tables store typed or custom relational data when you choose a native datastore. Dashboards query that evidence and turn it into KPIs, charts, filters and drill-down tables.
The important design rule is to preserve source truth. Keep original amounts, currencies, account identifiers, dates and provider identifiers intact. Add management classifications and formulas in separate fields. That gives every headline number a route back to the underlying rows.
Design the model before the dashboard
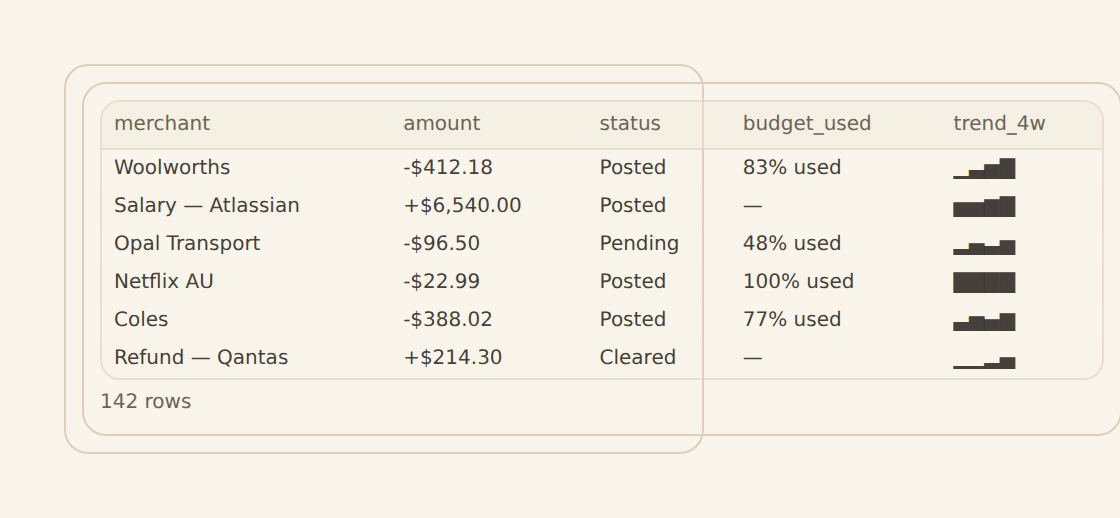
Use typed Transactions and Balances data, then add custom relations for categories, goals or household members. Merchant Cleanup, Memory, lookups, rules and AI Categorizer can fill a controlled taxonomy. Low-confidence suggestions go to Review Queue. A custom Budgets Table is useful when you want planned amounts, periods, category relations, variance formulas and rollover policy.
Keep capture, modelling and presentation separate
A feed is a transport definition: source accounts, one data type, destination, mapping and schedule. A BankSync Table is a stored data model with fields, relations, formulas, comments, history and seven layout views. A dashboard Table widget is a presentation surface with formatting, saved views and query results. Treating those as separate layers prevents a convenient chart setting from becoming an undocumented accounting rule.
Choose the right Table view
Grid is the general review surface. Board writes status when a card moves. Calendar and Timeline write date fields when an item moves. Gallery is useful for attachment-led records, List for a calm summary and Form for adding new rows. Views may be shared or personal and store filters, grouping, sorts, visible columns, widths, footer calculations and row colours.
Make aggregation safe
Tag transfers between owned accounts so they do not become spending. Pending handling depends on the provider: Australian CDR connections may change pending identifiers, so pending records are filtered by default to avoid duplicates, while other providers may support stable pending-to-posted tracking. BankSync dashboards use strict multi-currency aggregation by default. If reporting currency is necessary, preserve native amount and currency, then store the rate, rate date and converted amount separately.
Daily money view
Cash, current-month flow, recent transactions and feed freshness.
Monthly review
Category trends, budget status and the exceptions that need correction.
Long-term view
Net worth, goals and investment modules kept separate from daily spending.
Household controls
Shared and personal views with only the accounts and fields each person needs.
Create the first personal dashboard
Choose daily questions
Limit the home screen to decisions you act on.
Connect bank and card accounts
Verify coverage and avoid duplicate feeds.
Create transaction and balance feeds
Keep data types separate.
Choose a category system
Use a small controlled taxonomy.
Handle transfers
Tag paired movements between owned accounts.
Add budgets and recurring watches
Watch thresholds and price changes.
Build the dashboard
Add cash, flow, savings and detail.
Save monthly and annual views
Do not overload the daily screen.
Copy this build: a calm household control room
Imagine a household with a joint transaction account, two personal cards, a mortgage and one brokerage account. Trying to show everything on one screen creates noise. Build three small views instead: Today, This Month and Longer Term.
Today shows cash, recent transactions and anything awaiting review. This Month shows spending by category, budget progress, recurring charges and savings rate. Longer Term combines dated net-worth snapshots with a separate investment module. The same Transactions Table can support the first two views, while balances, loans and holdings keep their own semantics.
Start with fewer than twelve categories. Let Memory learn accepted corrections, use lookups for known merchants and send uncertain AI suggestions to Review Queue. The objective is a five-minute weekly check, not constant financial monitoring.
What success looks like after one week
Both household members can answer the same core questions without sharing an overloaded layout, and every chart still opens into the rows that produced it.
Build the decision layer
Use KPIs for cash, flow and savings; a line chart for change; bars for category composition; a gauge for one goal; and a rich transaction table. Add date, account and category filters. Cross-filtering can connect a category bar to the detail table, but it should be tested in the final editor.
Source-applied filters are the default because they recompute aggregates correctly. Browser-applied filtering is useful for presentation but is not a security boundary. Where a dashboard is scoped to a client or entity, use a locked source-applied filter that fails closed.
Enrichments and alerts
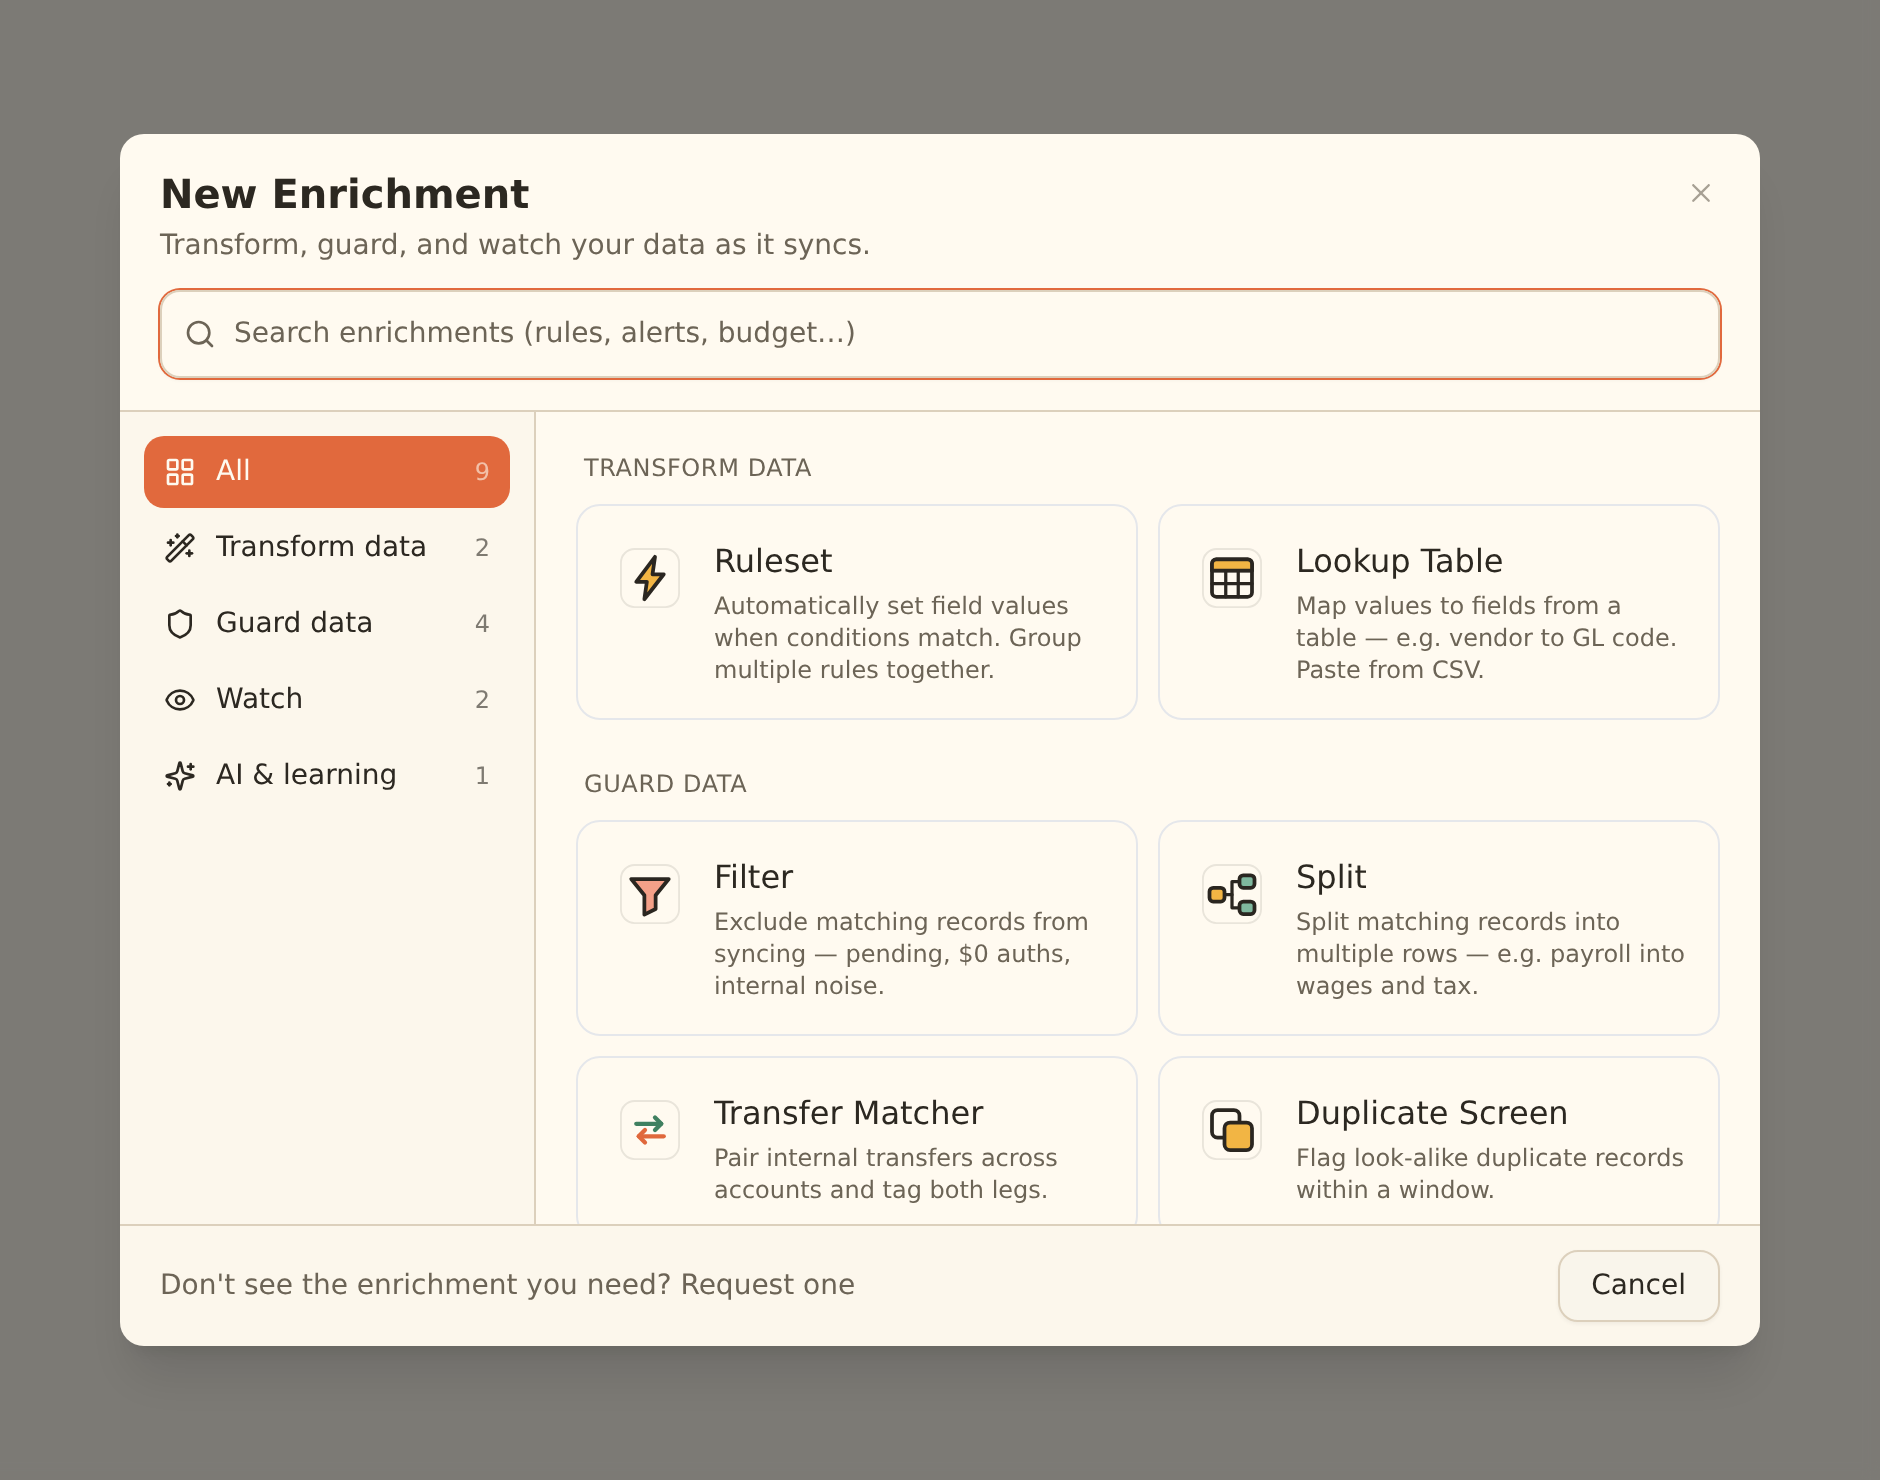
Memory learns accepted corrections, Lookup Tables map known merchants, Rulesets apply deterministic policy and AI Categorizer fills allowed values above a confidence threshold. Budget and Recurring Registry provide thresholds, price-change and new-subscription watches. A hard Filter removes records from the destination, Memory and alerts, so it should be the exception.
The enrichment order matters. Guard steps run before Memory, lookup tables and rules; AI fills remaining blanks; watch enrichments observe the final records. Suppressed records do not reach the destination, teach Memory or fire alerts. Always use Live Preview before enabling a hard Filter, Split or suppression action.
Alert freshness follows feed freshness. A daily feed cannot produce a truly real-time transaction warning. Feed Monitor covers a different failure mode: a source that has not succeeded recently or succeeds while producing no records. Cooldowns, batching and daily caps keep watches actionable.
Limitations and controls
This is a composable platform rather than an opinionated envelope-budgeting application. Actual Budget remains a strong choice for a local-first envelope method. BankSync is a better fit when the goal is a custom system spanning multiple data types, relational Tables, alerts and dashboards. The tools overlap, but the workflows are not identical.
Dashboards are in beta by workspace. Public links, embeds and indexed visibility should be used only for intentional public data. Sensitive finance views should normally remain private or workspace-scoped. External-agent dashboard authoring is a staging workflow; open and review anything it builds in the regular editor.
Operating rhythm
Check feed history before trusting a quiet chart. Review low-confidence categories and exceptions on a regular cadence. Document formulas, filters and classification changes. Use row comments and history when a decision needs an audit trail. A good dashboard is not the one with the most widgets; it is the one whose numbers can be explained and acted on.
Primary sources
- Creating a feed
- Enrichments overview
- AI Categorizer
- Dashboard overview
- Actual Budget features
- Actual Budget bank sync