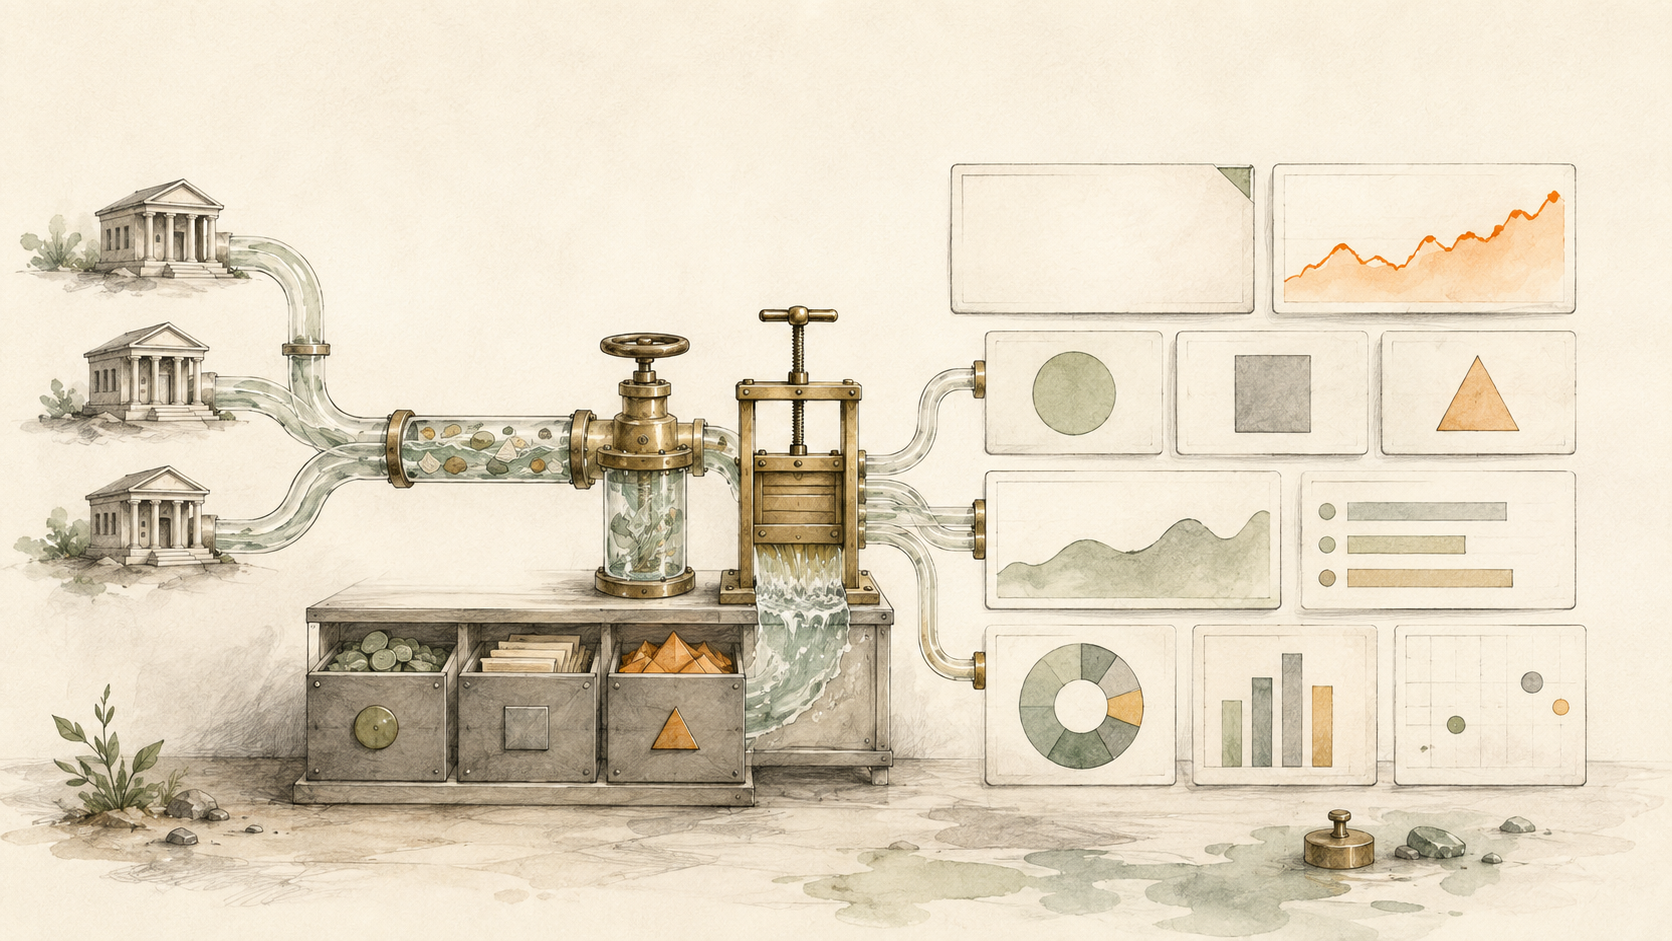
A business cash flow dashboard can be built by syncing transactions and balances, classifying operating activity, matching internal transfers, storing auditable rows in BankSync Tables and presenting KPIs with drill-down detail.
What this system should answer
It should answer how much cash is available, what came in, what went out, what changed from the previous period and which transactions require attention. Begin with current cash, inflow, outflow, net flow, a monthly trend, category composition and a transaction table.
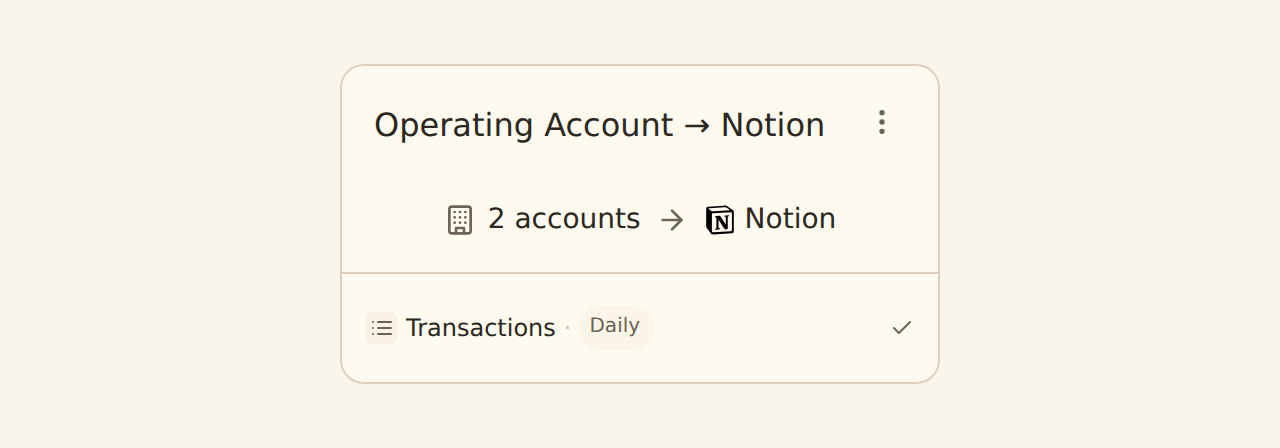
A reliable build starts below the visual layer. BankSync Feeds collect one data type from selected accounts and send it to one or more destinations. Enrichments transform, guard, watch or learn from records in a defined order. BankSync Tables store typed or custom relational data when you choose a native datastore. Dashboards query that evidence and turn it into KPIs, charts, filters and drill-down tables.
The important design rule is to preserve source truth. Keep original amounts, currencies, account identifiers, dates and provider identifiers intact. Add management classifications and formulas in separate fields. That gives every headline number a route back to the underlying rows.
Design the model before the dashboard
Use a typed Transactions Table for standard fields and add management fields such as cash-flow class, department, project, entity and review status. Use a balance feed in overwrite mode for the latest position or append mode for historical snapshots. Current cash must select the latest balance per account; it must not sum every appended observation. Tag internal transfers with Transfer Matcher so moving money between owned accounts does not inflate both inflow and outflow.
Keep capture, modelling and presentation separate
A feed is a transport definition: source accounts, one data type, destination, mapping and schedule. A BankSync Table is a stored data model with fields, relations, formulas, comments, history and seven layout views. A dashboard Table widget is a presentation surface with formatting, saved views and query results. Treating those as separate layers prevents a convenient chart setting from becoming an undocumented accounting rule.
Choose the right Table view
Grid is the general review surface. Board writes status when a card moves. Calendar and Timeline write date fields when an item moves. Gallery is useful for attachment-led records, List for a calm summary and Form for adding new rows. Views may be shared or personal and store filters, grouping, sorts, visible columns, widths, footer calculations and row colours.
Make aggregation safe
Net cash flow is inflow less outflow over a stated period. Cash on hand comes from balances, not an indefinite transaction sum. Runway and forecast figures add assumptions and should be modelled separately. BankSync dashboards use strict multi-currency aggregation by default. If reporting currency is necessary, preserve native amount and currency, then store the rate, rate date and converted amount separately.
Cash available
Latest usable balance per account, checked for freshness.
Money moving
Inflow, outflow and net flow with transfers tagged.
Why it changed
Trends and categories that link back to source rows.
What needs attention
Exceptions, review status and a named owner.
Build the first useful version
Define the decisions
Write the action each metric should trigger.
Connect in-scope accounts
Start with operating cash and cards.
Create transaction and balance feeds
Choose current-state or history deliberately.
Preview enrichment logic
Clean merchants, classify activity and tag transfers.
Create management fields
Add entity, department, class and review status.
Build KPIs and trends
Keep the first dashboard small.
Add filters and drill-down
Make every total explainable.
Operate the feeds
Review sync health and exceptions regularly.
Build the decision layer
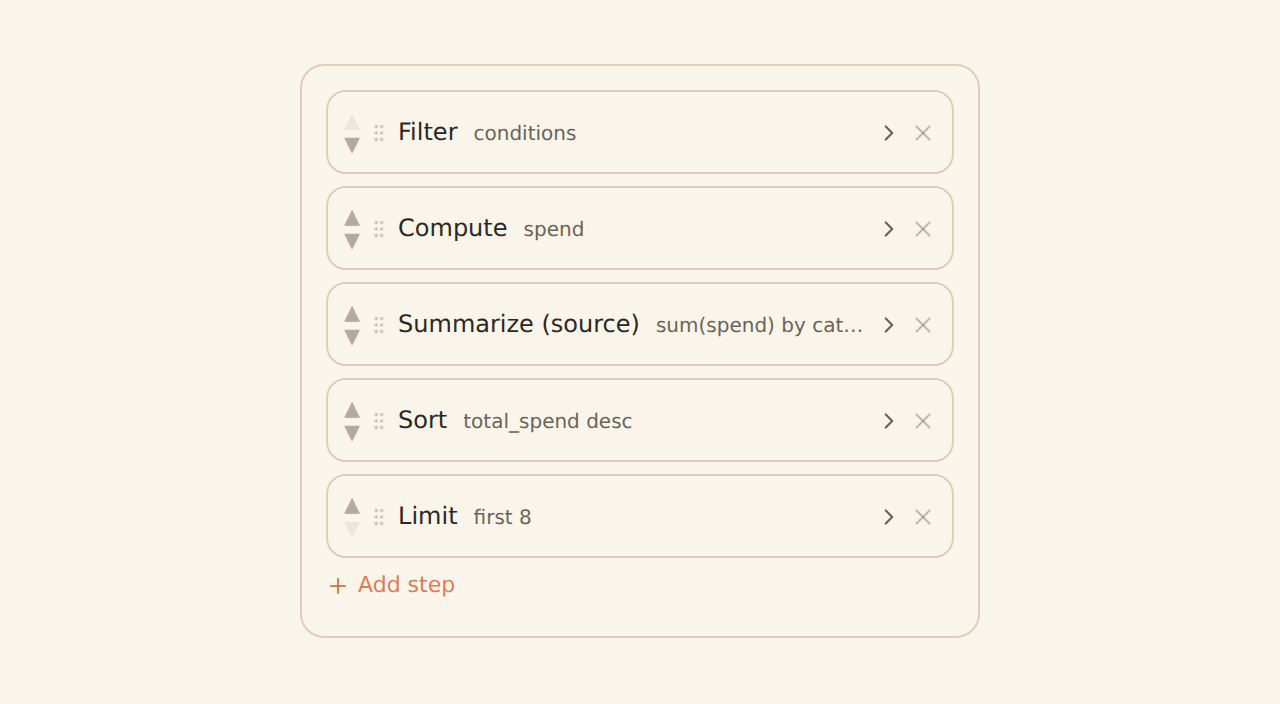
Use KPIs for cash, inflow, outflow and net flow; a monthly area or line chart; bars or a treemap for category composition; and a rich table for transactions. Add date, account and entity filters. Shape data in explicit filter, compute, summarise, sort and limit steps so reviewers can reproduce the number.
Source-applied filters are the default because they recompute aggregates correctly. Browser-applied filtering is useful for presentation but is not a security boundary. Where a dashboard is scoped to a client or entity, use a locked source-applied filter that fails closed.
Enrichments and alerts
Merchant Cleanup can normalise raw descriptors. Memory, Lookup Tables and Rulesets can apply repeatable categories. Transfer Matcher should tag both legs rather than suppress them. Budget can watch category thresholds, Alert can watch a large payment, Anomaly Detector can identify an unusual merchant or burst, and Feed Monitor can flag stale or silent feeds.
The enrichment order matters. Guard steps run before Memory, lookup tables and rules; AI fills remaining blanks; watch enrichments observe the final records. Suppressed records do not reach the destination, teach Memory or fire alerts. Always use Live Preview before enabling a hard Filter, Split or suppression action.
Alert freshness follows feed freshness. A daily feed cannot produce a truly real-time transaction warning. Feed Monitor covers a different failure mode: a source that has not succeeded recently or succeeds while producing no records. Cooldowns, batching and daily caps keep watches actionable.
Limitations and controls
BankSync is an operating data and dashboard layer, not a statutory ledger. Reconciliation, accruals, tax treatment and formal reporting remain in the appropriate accounting workflow. Multi-currency totals require an explicit conversion policy.
Dashboards are in beta by workspace. Public links, embeds and indexed visibility should be used only for intentional public data. Sensitive finance views should normally remain private or workspace-scoped. External-agent dashboard authoring is a staging workflow; open and review anything it builds in the regular editor.
Operating rhythm
Check feed history before trusting a quiet chart. Review low-confidence categories and exceptions on a regular cadence. Document formulas, filters and classification changes. Use row comments and history when a decision needs an audit trail. A good dashboard is not the one with the most widgets; it is the one whose numbers can be explained and acted on.
Copy this build: the Monday-morning cash screen
Imagine a services business with two operating accounts, one tax account and three cards. The finance lead opens one screen at 9 am on Monday. The top row shows available cash, last week's inflow, last week's outflow and net operating flow. A line underneath each KPI shows when its source last synced.
Below that, a 13-week trend shows cash movement without counting transfers between the company's own accounts as revenue or expense. A category chart explains the largest changes. The final panel is a transaction table filtered to uncategorised items, payments above the review threshold and records with comments.
To mimic it, start with only those four decisions. Connect the accounts, build separate transaction and balance feeds, tag internal transfers, add cash-flow class and review-status fields, then create the KPI-to-detail path. Do not add forecasts until the historical view reconciles.
What success looks like after one week
The Monday meeting starts with decisions, not spreadsheet assembly. Every total can be opened into rows, the team knows which exceptions need an owner, and a quiet chart is checked against feed history before anyone assumes nothing happened.