Most brokerages let you download a CSV, but that still leaves you with a manual export, inconsistent columns and a portfolio tracker that is out of date as soon as the file is saved.
A cleaner approach is to connect the brokerage once, send holdings and trades into separate Google Sheets tabs, map the fields you actually use, and run the feeds on a schedule. BankSync supports this workflow for compatible brokerage accounts through a read-only connection.
This guide explains the setup, the data you can expect, the limitations to plan for, and how to structure the spreadsheet so repeated syncs do not break your formulas.
What you can sync from a brokerage
BankSync treats investment data differently from ordinary bank transactions. Each feed carries one data type, so holdings, trades and balances should be modelled separately rather than forced into one mixed table.
Brokerage data available for spreadsheet feeds
| Feed type | Typical data | Best spreadsheet use |
|---|---|---|
| Holdings | Symbol, security name, quantity, current price, market value, cost basis, unrealised gain or loss, settled cash | Current portfolio dashboard, allocation analysis and net-worth reporting |
| Trades | Trade date, symbol, buy or sell type, quantity, price, total, fees, dividends and transfers | Activity log, dividend tracking, tax preparation and trade analysis |
| Balances | Account-level cash and total values where supported | Account summary and historical balance tracking |
| Account details | Brokerage account name and account type | Filtering, consolidation and account-level reporting |
Exact fields and history depend on the brokerage and the data its connection makes available.
Before you start
You need:
- A BankSync account.
- A brokerage login and any required two-factor authentication method.
- A Google account with permission to edit the destination spreadsheet.
- At least one brokerage account that exposes holdings or trade data through the available connection.
Confirm that you can sign in to the brokerage directly before starting. If the broker requires re-authentication, an expired session can leave the connection showing an older snapshot until you reconnect it.
How to sync brokerage holdings to Google Sheets
Connect the brokerage
Open the Banks area in BankSync, choose Connect a new bank, search for the brokerage and select the investment result. Sign in through the secure brokerage connection window, complete any two-factor prompt and grant read-only access.
Connect Google Sheets
Add Google Sheets as an integration and authorise the Google account that owns or can edit the destination spreadsheet. You can also install the BankSync Google Sheets add-on and create the feed from the spreadsheet sidebar.
Create a Holdings feed
Create a new feed, select the connected investment accounts and choose Holdings as the data type. Use a dedicated tab such as Holdings rather than writing directly into a dashboard tab.
Choose the spreadsheet and sheet
Select the destination spreadsheet, choose the exact worksheet and confirm the header row. Keep the synced data tab separate from formulas, charts and manual notes.
Map the fields
Map source fields to Google Sheets column letters. Include Account and, where available, Brokerage so the same table can hold positions from multiple accounts without losing source context.
Choose append or overwrite behaviour
Use overwrite when the sheet should show only the latest portfolio state. Use append when you deliberately want time-stamped snapshots for historical analysis. Holdings are point-in-time data, so the correct choice depends on whether you need current state or a history series.
Schedule and test the feed
Set an available hourly, daily, weekly or monthly cadence, then run the feed manually once. Check the resulting rows, confirm numeric fields are stored as numbers, and review the sync-job result before building formulas on top.
Create a separate Trades feed
If you need buys, sells, dividends, fees or transfers, create another feed using Trades. Send it to its own tab and backfill the available history on the first run.
Recommended Google Sheets structure
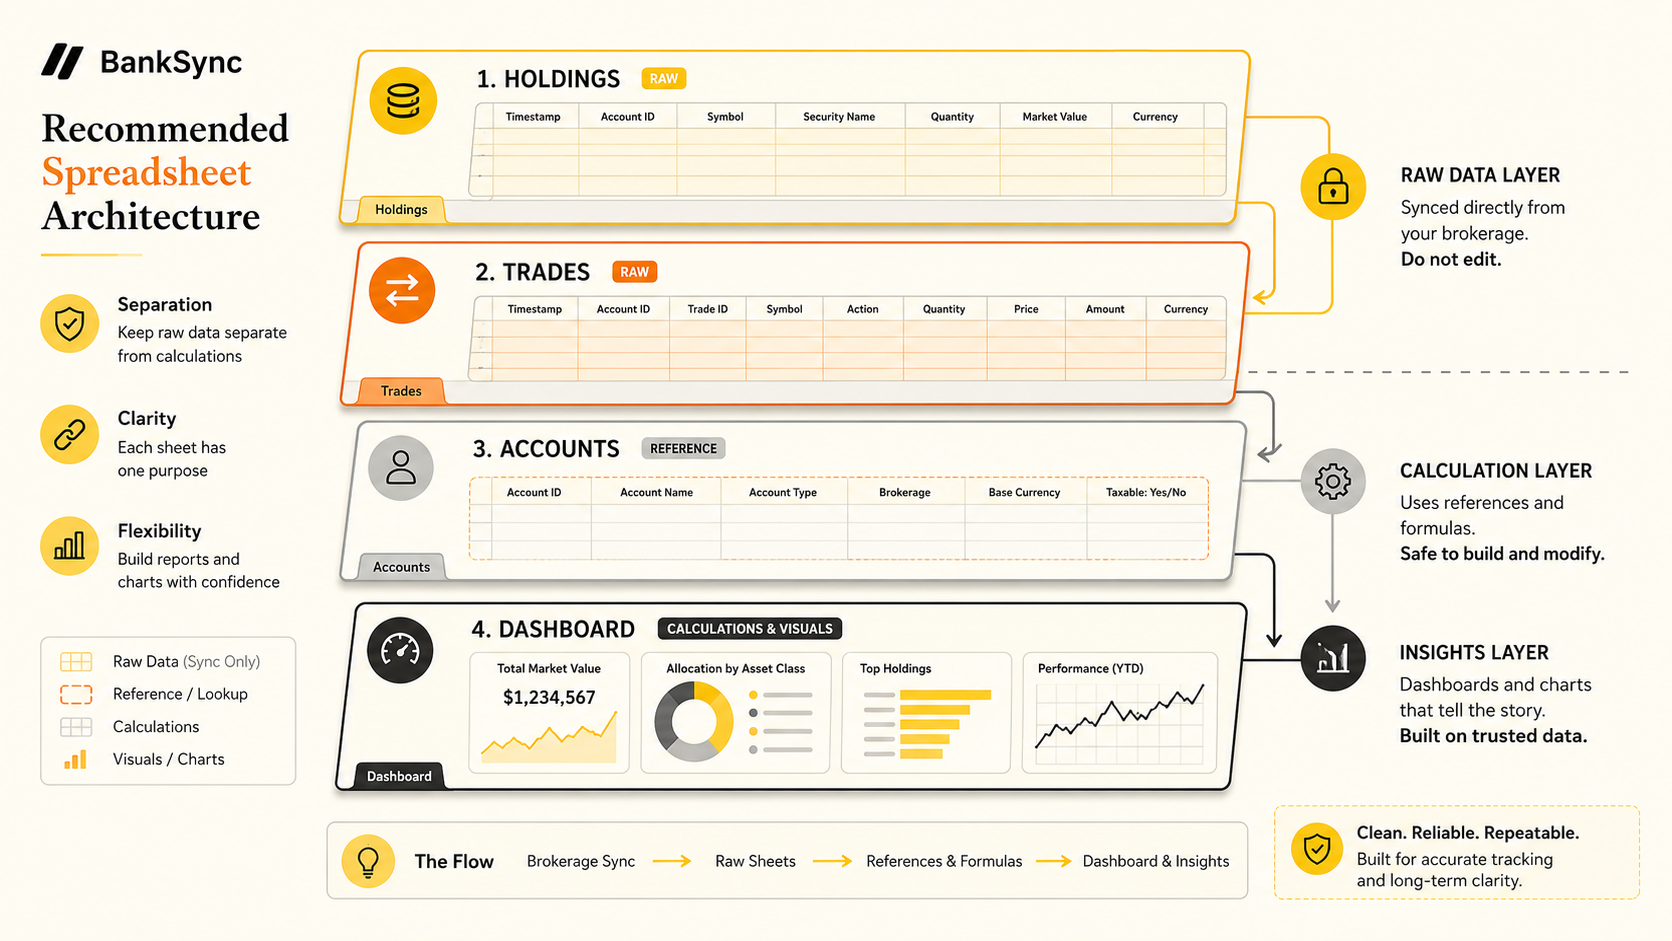
The most reliable workbook separates raw synced rows from calculations. A practical structure is:
- Holdings — current positions or periodic snapshots.
- Trades — buys, sells, dividends, transfers and fees.
- Accounts — optional account-level balances and metadata.
- Dashboard — formulas, pivots and charts that reference the synced tabs.
- Mapping notes — optional documentation for custom fields and account labels.
This separation matters because a re-sync should update data, not overwrite your formulas. It also makes it easier to rebuild a feed without rebuilding the dashboard.
Suggested holdings columns
| Column | Purpose | Example |
|---|---|---|
| As of | Snapshot or sync date | 2026-07-22 |
| Account | Source brokerage account | Individual brokerage |
| Symbol | Security ticker or identifier | AAPL |
| Security name | Readable asset name | Apple Inc. |
| Quantity | Units currently held | 18 |
| Current price | Latest value supplied by the brokerage connection | 213.89 |
| Market value | Current position value | 3850.02 |
| Cost basis | Recorded acquisition cost where available | 3410.00 |
| Unrealised gain/loss | Difference between value and cost basis where available | 440.02 |
| Currency | Position currency | USD |
The actual available field set varies by brokerage. Map only fields your connection exposes and your analysis needs.
Overwrite or append: which should you choose?
For a live portfolio dashboard, overwrite is usually the simpler choice. The holdings tab stays compact and represents the latest state of each position.
Choose append when you want to preserve each snapshot and calculate changes over time. That produces a larger table, but it gives you a dated history for allocation, concentration and account-value analysis.
Trades behave differently. They are event records, so the first run can backfill available history and later runs add new activity. BankSync deduplicates trades using the provider's unique identifier, which helps prevent duplicate rows when date ranges overlap or a run is repeated.
Choosing the right feed design
| Feature | Need | Recommended setup |
|---|---|---|
| Current portfolio only | Holdings feed in overwrite mode | |
| Portfolio history | Holdings feed in append mode | |
| Buys, sells and dividends | Separate Trades feed | |
| Portfolio dashboard | Separate Dashboard tab |
Data freshness and brokerage limitations
A brokerage spreadsheet is only as current as the data the brokerage exposes. Some connections return live positions and balances at sync time; others return the broker's most recent snapshot rather than tick-by-tick market data.
That distinction matters. BankSync can automate retrieval and delivery, but it does not convert delayed brokerage data into a live market-data terminal.
Other limitations to allow for:
- Available brokerages, account types and fields vary.
- Cost basis or unrealised gain may be missing for some accounts.
- Historical trade lookback varies by brokerage.
- A degraded or expired brokerage session may continue returning the last successful snapshot.
- Complex products can expose fewer standardised fields than listed equities or ETFs.
- Holdings, trades and balances remain separate feed types.
When figures stop changing, reconnect the brokerage and run the feed again before assuming there were no portfolio movements.
Useful formulas once the data lands
Once holdings are in a clean table, the spreadsheet can calculate portfolio-level metrics without editing the synced rows.
For example, if market value is in column G:
``text =SUM(Holdings!G:G) ``
To calculate each position's portfolio weight, divide its market value by the total market value:
``text =G2/SUM($G$2:$G) ``
To summarise by account or symbol, use a pivot table rather than hand-built subtotal rows inside the synced sheet. That keeps the destination range predictable and easier to troubleshoot.
When a direct brokerage feed is better than CSV exports
A scheduled feed is most useful when you:
- Track more than one investment account.
- Maintain a recurring portfolio dashboard.
- Need holdings and trade data in a consistent schema.
- Regularly reconcile dividends, fees or transfers.
- Share a reporting workbook with an adviser, accountant or household member.
- Want the spreadsheet to refresh without logging into every brokerage.
A CSV export can still be sufficient for a one-off tax calculation, an unsupported brokerage or a workbook that is updated only once a year. Automation is valuable when the repeated process—not the single export—is the real problem.
Frequently asked questions
Build the spreadsheet around the feed, not the other way around
The strongest setup is deliberately simple: one holdings tab, one trades tab, clear account fields and a separate dashboard. Once that foundation is stable, you can add allocation charts, dividend summaries, tax views or consolidated net-worth reporting without touching the incoming data.
For an end-to-end view of the underlying setup, see BankSync's guides to connecting brokerages, configuring field mappings, creating your first feed and syncing trades.