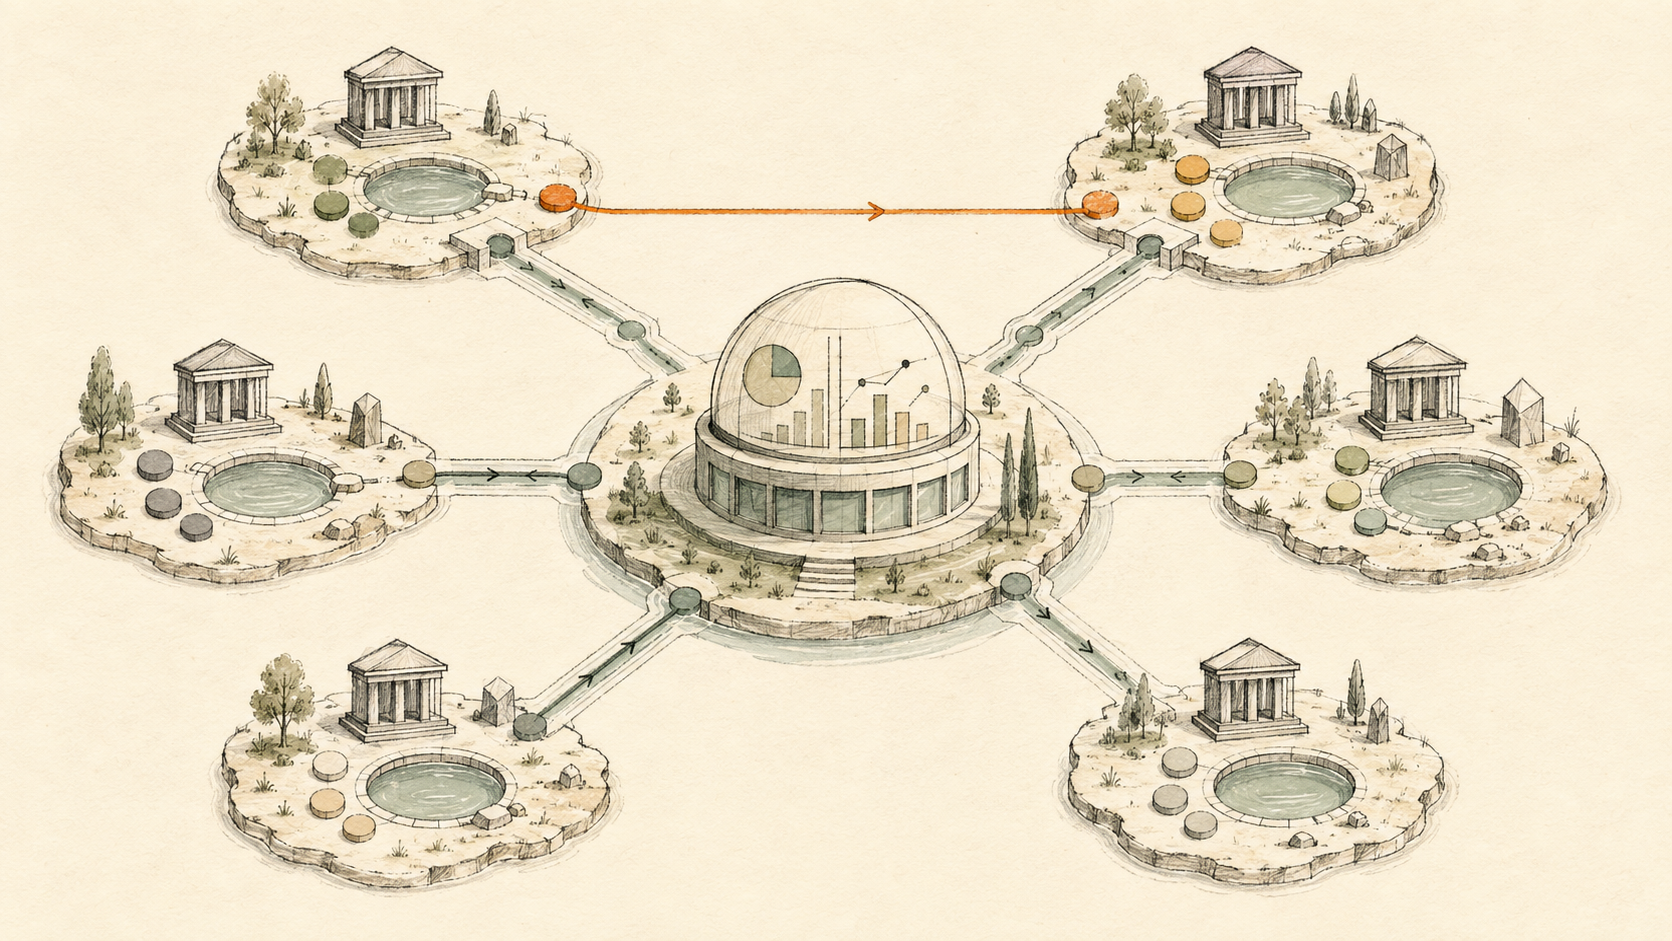
A multi-entity treasury dashboard can consolidate current balances and movements while retaining legal entity, account ownership, currency, restrictions and matched intercompany transfers in the data model.
What the system should answer
It should show group and entity cash positions, available versus restricted cash, currency mix, bank concentration, intercompany movements, largest external movements and source freshness. Every group total should drill to entity and account.
Build below the chart. A BankSync Feed defines selected source accounts, one data type, destination, mapping and schedule. Enrichments transform, guard, watch or learn from records in a documented order. Tables store typed or custom relational data when you choose native storage. Dashboards query that evidence and present KPIs, charts, filters and detail.
Keep source amount, currency, date, account and provider identifier unchanged. Add management classifications, relationships and formulas in separate fields. A reliable dashboard is explainable from the headline number back to the rows and assumptions.
Model boundaries explicitly
Create Entities and Accounts Tables. Entity fields can include legal name, region, reporting currency, parent relation and policy. Account fields can include bank, native currency, purpose, restriction and minimum operating cash. Relate balances and transactions to accounts, then look up the entity. Use a current-position query that selects the latest balance per account.
Relations, lookups, counts, rollups and formulas let a Table become a small finance application without hiding logic in a spreadsheet cell. Stored formula results can be sorted, filtered, charted and queried. Views provide Grid, Board, Calendar, Gallery, Timeline, List and Form layouts; they can be shared or personal.
Aggregate safely
Do not add all currencies or all cash indiscriminately. Preserve native values and model reporting conversion. Tag equal-and-opposite intercompany transfers with a shared pair identifier. Group external cash flow should exclude matched internal movement, while entity views may still show each leg. Strict multi-currency aggregation prevents accidental cross-currency totals. If reporting conversion is required, preserve native amount and currency and add rate, rate date and converted value separately.
Do not confuse Tables
BankSync Tables are the relational datastore. A dashboard Table widget is a presentation surface for query results with rich cell formats and saved presentation views. A stored Table can power every widget kind, not only a table.
Entity view
Native-currency cash, local restrictions, owned accounts, external movement and each side of an intercompany transfer.
Group view
Controlled reporting-currency totals, external flow, concentration and matched internal movements removed from group activity.
Build the group cash model
Create Entities
Record parent, region and reporting policy.
Create the account register
Attach ownership, currency and restrictions.
Connect each institution
Verify coverage by entity.
Build current balance logic
Select the latest account observation.
Tag intercompany transfers
Preserve paired legs.
Model reporting currency
Store rates and dates explicitly.
Build group and entity views
Keep drill-down available.
Lock scoped filters
Fail closed where access is restricted.
Copy this build: the three-company cash map
Imagine a parent company with two subsidiaries, each using different bank accounts and one operating in another currency. A single combined balance would be quick and wrong.
Create Entities and Accounts Tables first. Add legal owner, parent relation, native currency, purpose, restriction and minimum operating cash. Relate balances and transactions through the account to the entity. Select the latest balance for current position.
Tag matched intercompany transfers and preserve both legs. Exclude them from group external flow, but keep them visible in each entity view. Build a group screen with available and restricted cash, entity table, currency mix, bank concentration and intercompany movement table. Lock entity filters where access is scoped.
What success looks like after one week
The group gets one cash map without erasing legal ownership, native currency or internal movement—and a subsidiary view cannot be widened with an ordinary browser filter.
Dashboard and watch design
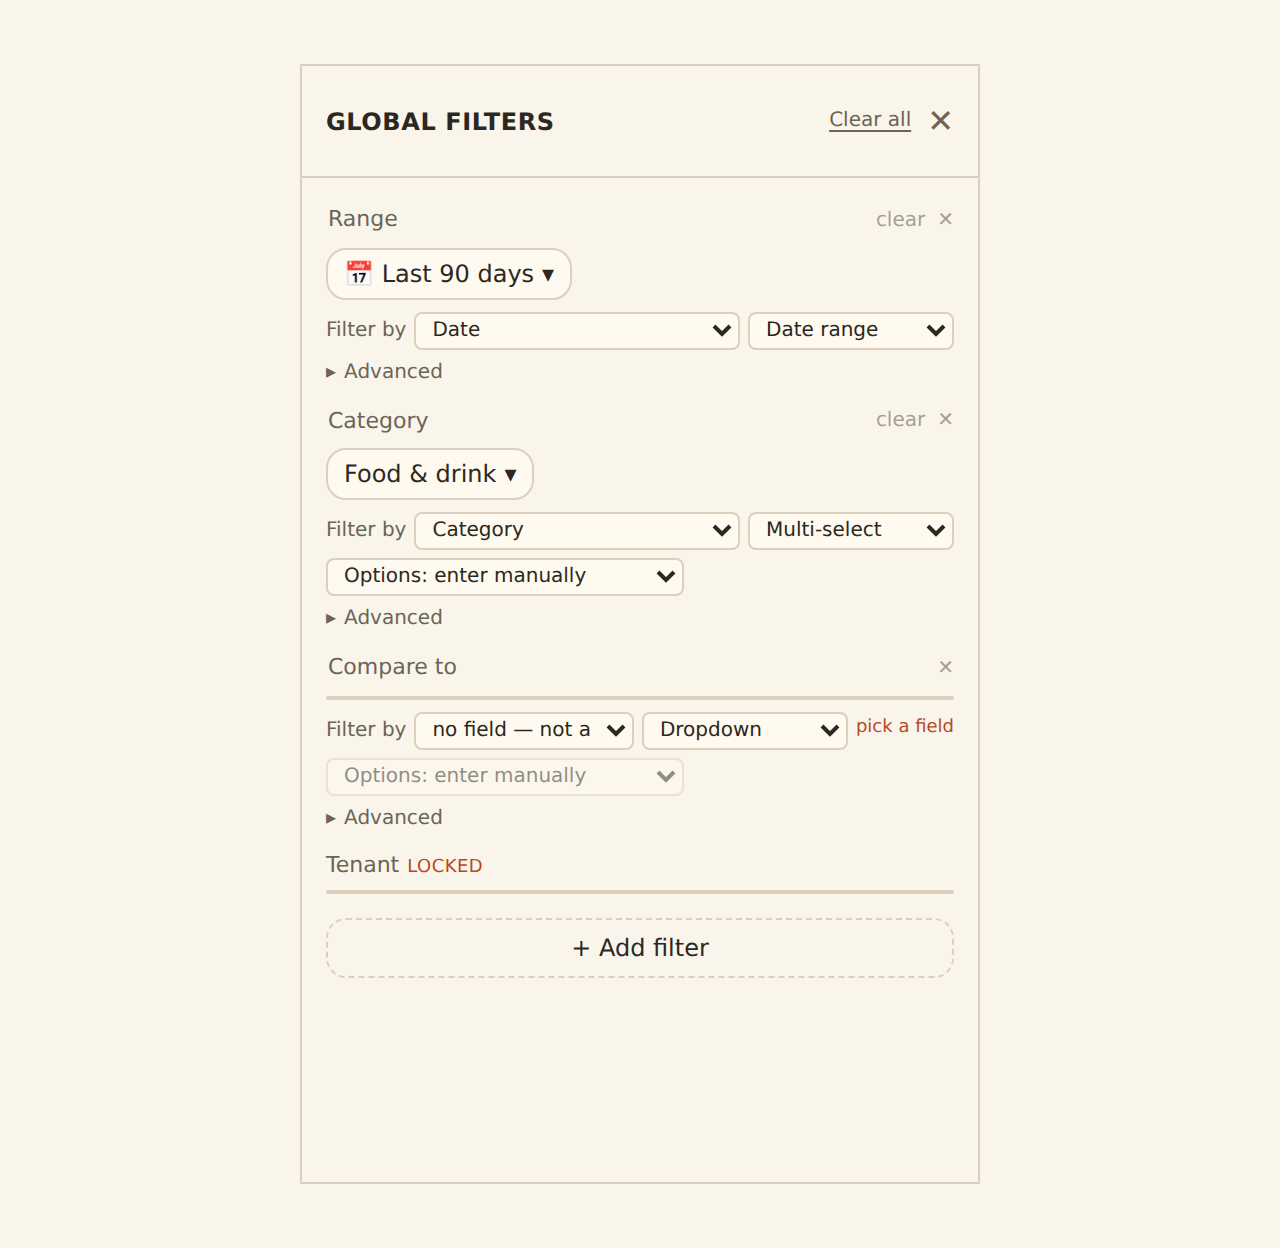
Use KPIs for group available cash and restricted cash, an entity table, currency composition, bank concentration, entity trend and intercompany movement table. Entity filters that protect access must be locked and source-applied. A row click can drive master-detail analysis, but security must not depend on an interaction.
Apply filters at the source when they alter aggregates. Browser filtering is a presentation option, not a security boundary. Locked source filters should fail closed when a dashboard is scoped to an entity or client.
Enrichments and alerts
Transfer Matcher provides a configurable one-to-fourteen-day window, four days by default, and tags rather than suppresses by default. Feed Monitor watches each source. Alert can watch policy-sized cross-entity movements. Lookup Tables and Rulesets can apply entity-specific account policy.
Guard steps run before Memory, lookup tables and rules; AI fills remaining blanks; watch enrichments observe the final rows. Suppressed records do not write, teach Memory or fire alerts. Live Preview is the safety check before hard Filter, Split or suppression behaviour.
Limitations and controls
A data dashboard does not create legal consolidation, cash-pooling authority, transfer-pricing treatment or foreign-exchange policy. Those remain finance and legal decisions. Client Portals may be a better isolation boundary when entities or clients should not share a workspace.
Alert freshness follows the feed schedule. Dashboards, public links and some sharing capabilities are beta by workspace. Keep sensitive finance data private or workspace-scoped. External-agent authoring is a staging workflow and should be reviewed in the normal editor.
Operate the system
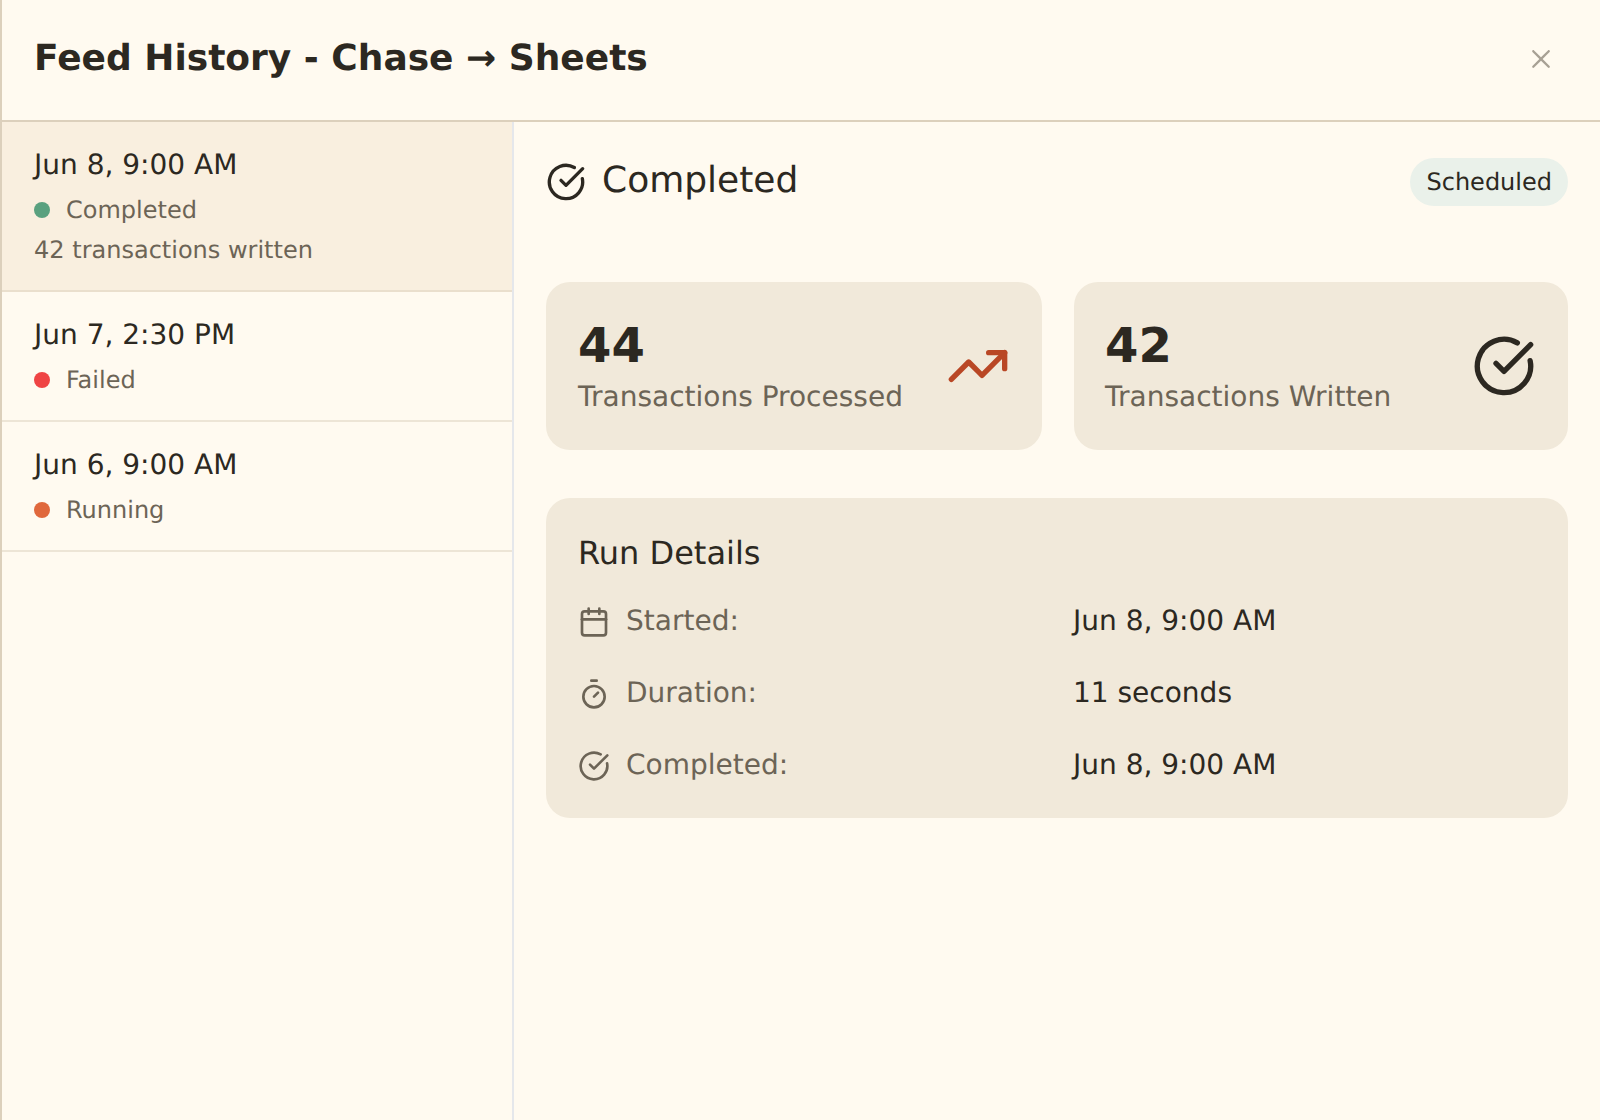
Check feed history before trusting a quiet chart. Assign owners for review queues, model changes and alert response. Use row comments and history for context. Document formulas and filters. The objective is not a perfect model on day one; it is a controlled system that can be improved without losing evidence.