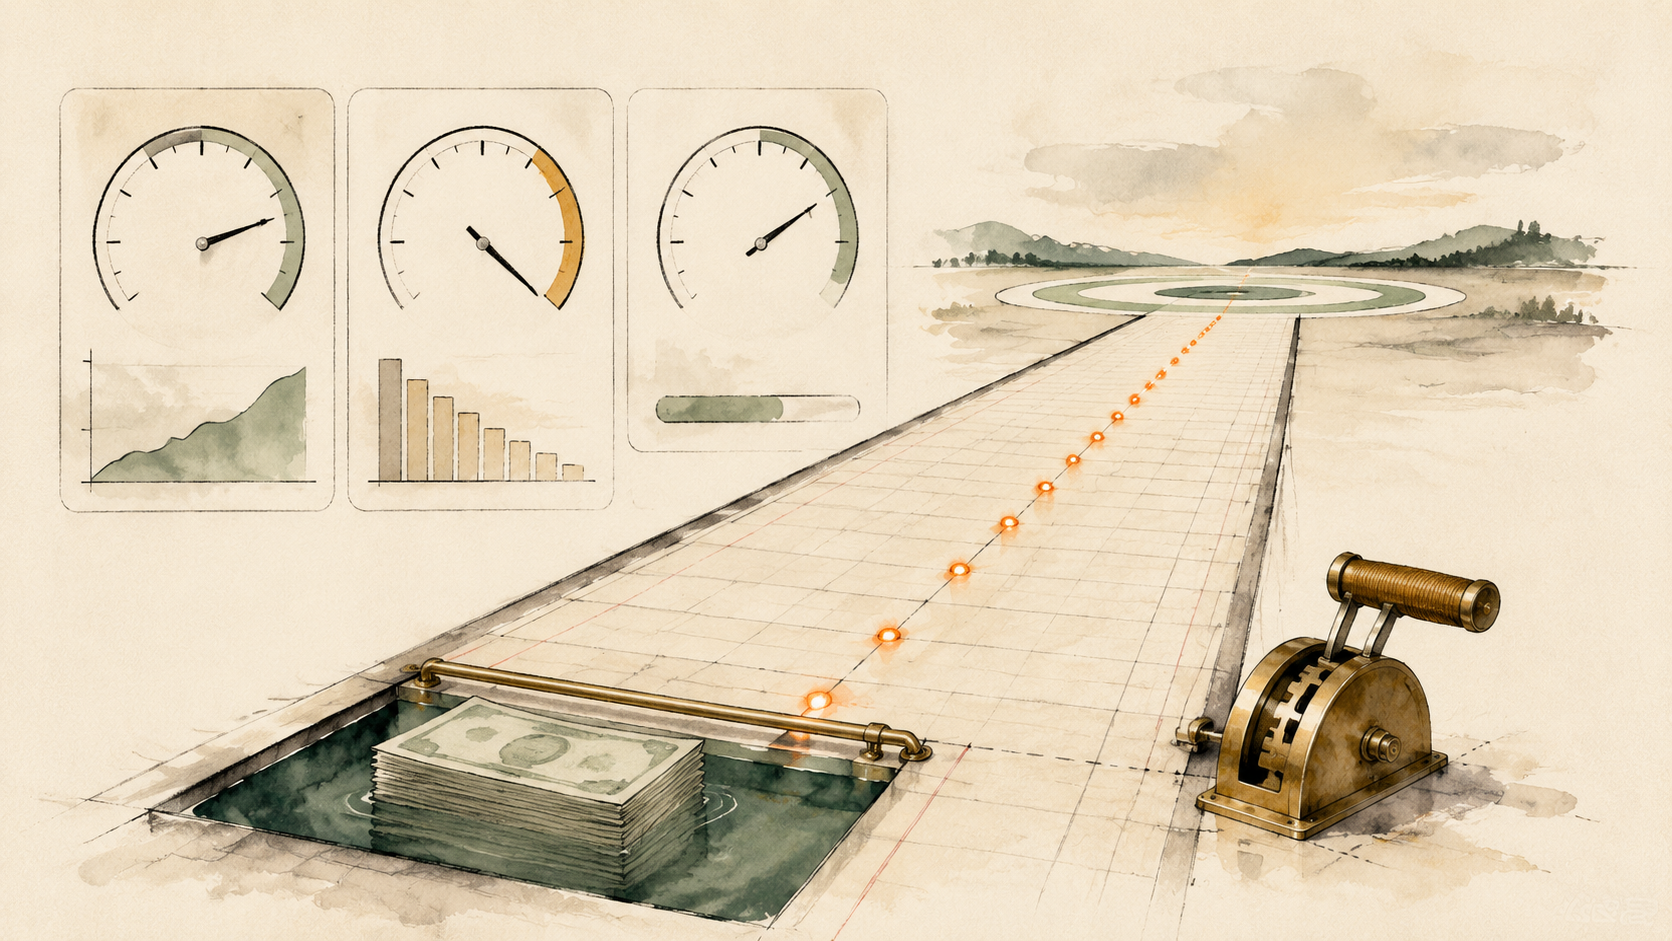
A cash runway dashboard can be built by separating live balances and historical cash movement from an editable scenario Table that stores future payroll, committed costs, expected receipts and one-off assumptions.
What this system should answer
It should show available cash, gross burn, net burn, runway under more than one window, recurring commitments and the assumptions that change the result. A range is usually more honest than a single precise month count.
A reliable build starts below the visual layer. BankSync Feeds collect one data type from selected accounts and send it to one or more destinations. Enrichments transform, guard, watch or learn from records in a defined order. BankSync Tables store typed or custom relational data when you choose a native datastore. Dashboards query that evidence and turn it into KPIs, charts, filters and drill-down tables.
The important design rule is to preserve source truth. Keep original amounts, currencies, account identifiers, dates and provider identifiers intact. Add management classifications and formulas in separate fields. That gives every headline number a route back to the underlying rows.
Design the model before the dashboard
Create a typed Transactions Table with a separate runway classification such as recurring operating, variable operating, payroll, financing, tax, capital expenditure and exceptional. Create a custom Scenario Table with name, start date, opening available cash, payroll, committed software, rent, expected receipts and one-offs. Use formulas for monthly net burn, end cash and runway, with explicit handling when burn is zero or negative.
Keep capture, modelling and presentation separate
A feed is a transport definition: source accounts, one data type, destination, mapping and schedule. A BankSync Table is a stored data model with fields, relations, formulas, comments, history and seven layout views. A dashboard Table widget is a presentation surface with formatting, saved views and query results. Treating those as separate layers prevents a convenient chart setting from becoming an undocumented accounting rule.
Choose the right Table view
Grid is the general review surface. Board writes status when a card moves. Calendar and Timeline write date fields when an item moves. Gallery is useful for attachment-led records, List for a calm summary and Form for adding new rows. Views may be shared or personal and store filters, grouping, sorts, visible columns, widths, footer calculations and row colours.
Make aggregation safe
Available cash should exclude restricted, tax-reserved and minimum-operating balances. Show trailing three- and six-month burn to expose volatility. Treat detected recurrence as evidence, not proof of a contractual future obligation. BankSync dashboards use strict multi-currency aggregation by default. If reporting currency is necessary, preserve native amount and currency, then store the rate, rate date and converted amount separately.
Base case
Current payroll, known recurring costs, conservative expected receipts and the agreed operating cash buffer. This is the working plan the team reviews each month.
Stress case
Receipts delayed, one material cost brought forward and no uncommitted financing. The purpose is to expose the decision date, not to predict a disaster.
Build the runway model
Define available cash
Exclude restricted and reserved balances.
Choose burn windows
Compare trailing three and six months.
Classify history
Separate recurring, payroll, financing and exceptional activity.
Create the Scenario Table
Store future assumptions explicitly.
Add formulas
Calculate burn and runway with edge-case handling.
Build comparison KPIs
Show base, conservative and growth cases.
Add recurring and budget watches
Detect changes to the baseline.
Review monthly
Explain variance and update assumptions deliberately.
Copy this build: a runway model a founder can challenge
Imagine a founder with cash in two accounts, monthly payroll, a dozen recurring software charges and three customer invoices expected this quarter. A single runway number hides too much. Build two visible scenarios instead.
Use current balances for opening available cash. Classify six months of transactions into payroll, recurring operating, variable operating, tax, financing and exceptional. Create a Scenario Table with one row per assumption, including date, category, amount, scenario and note. Do not type assumptions inside chart settings.
The dashboard needs four headline measures: available cash, gross burn, net burn and runway. Below them, show the monthly cash bridge and the exact assumptions in the selected scenario. Add Recurring Registry and a Budget watch so a new subscription or cost increase can challenge the baseline.
What success looks like after one week
When runway changes, the founder can point to the balance, historical burn window or assumption that changed it—and can see the earlier decision date in the stress case.
Build the decision layer
Place available cash, gross burn, net burn and runway at the top. Add a cash bridge, spend by runway class, recurring-cost trend and a table of future assumptions. Use a scenario selector without letting a historical date filter silently rewrite the saved scenario.
Source-applied filters are the default because they recompute aggregates correctly. Browser-applied filtering is useful for presentation but is not a security boundary. Where a dashboard is scoped to a client or entity, use a locked source-applied filter that fails closed.
Enrichments and alerts
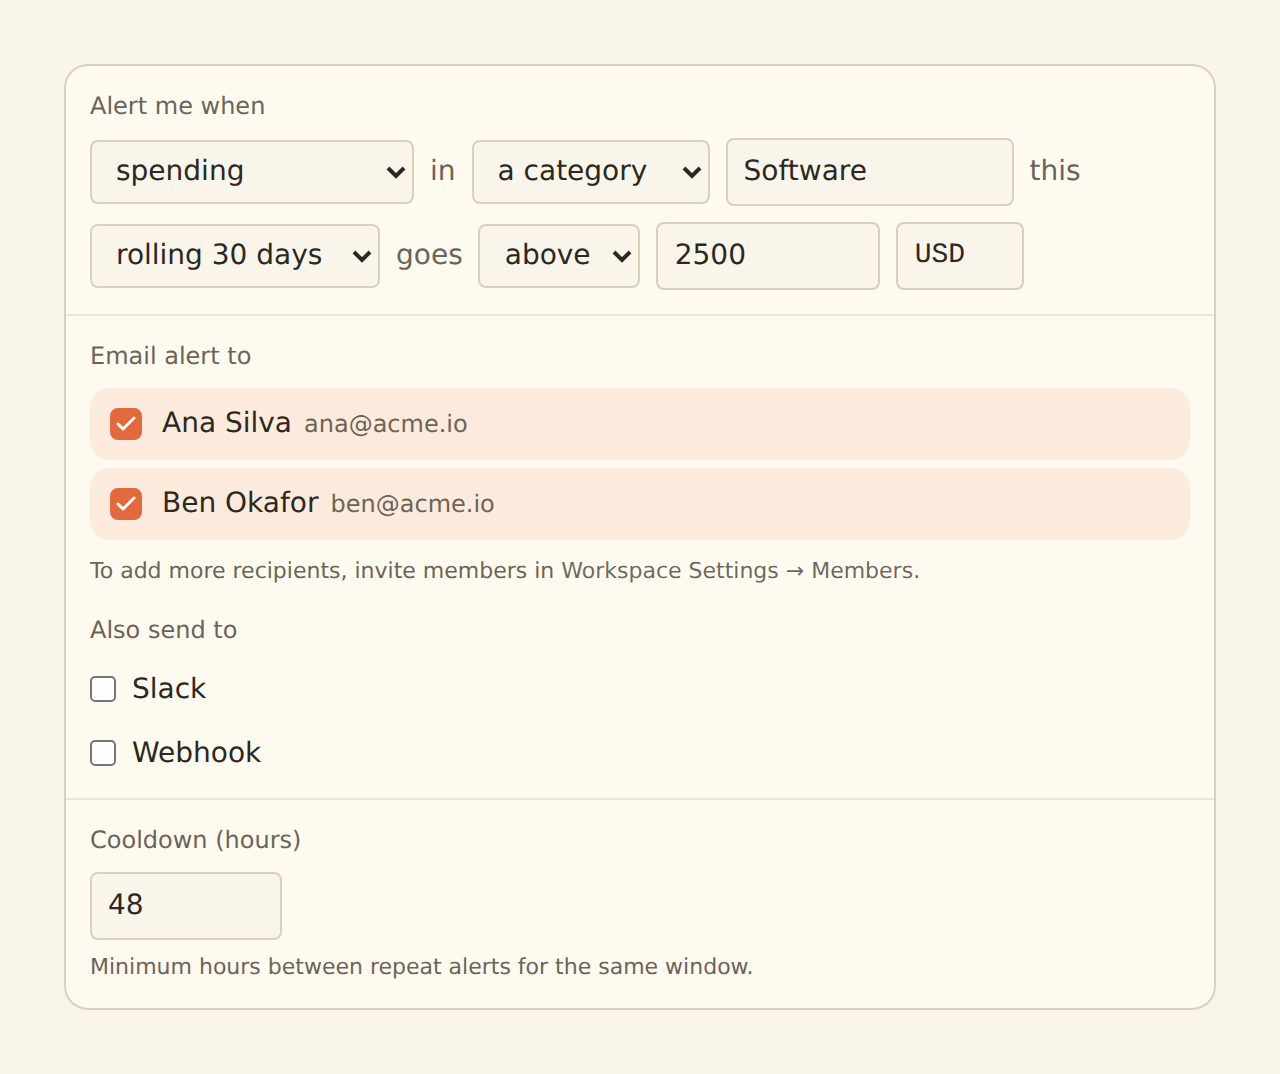
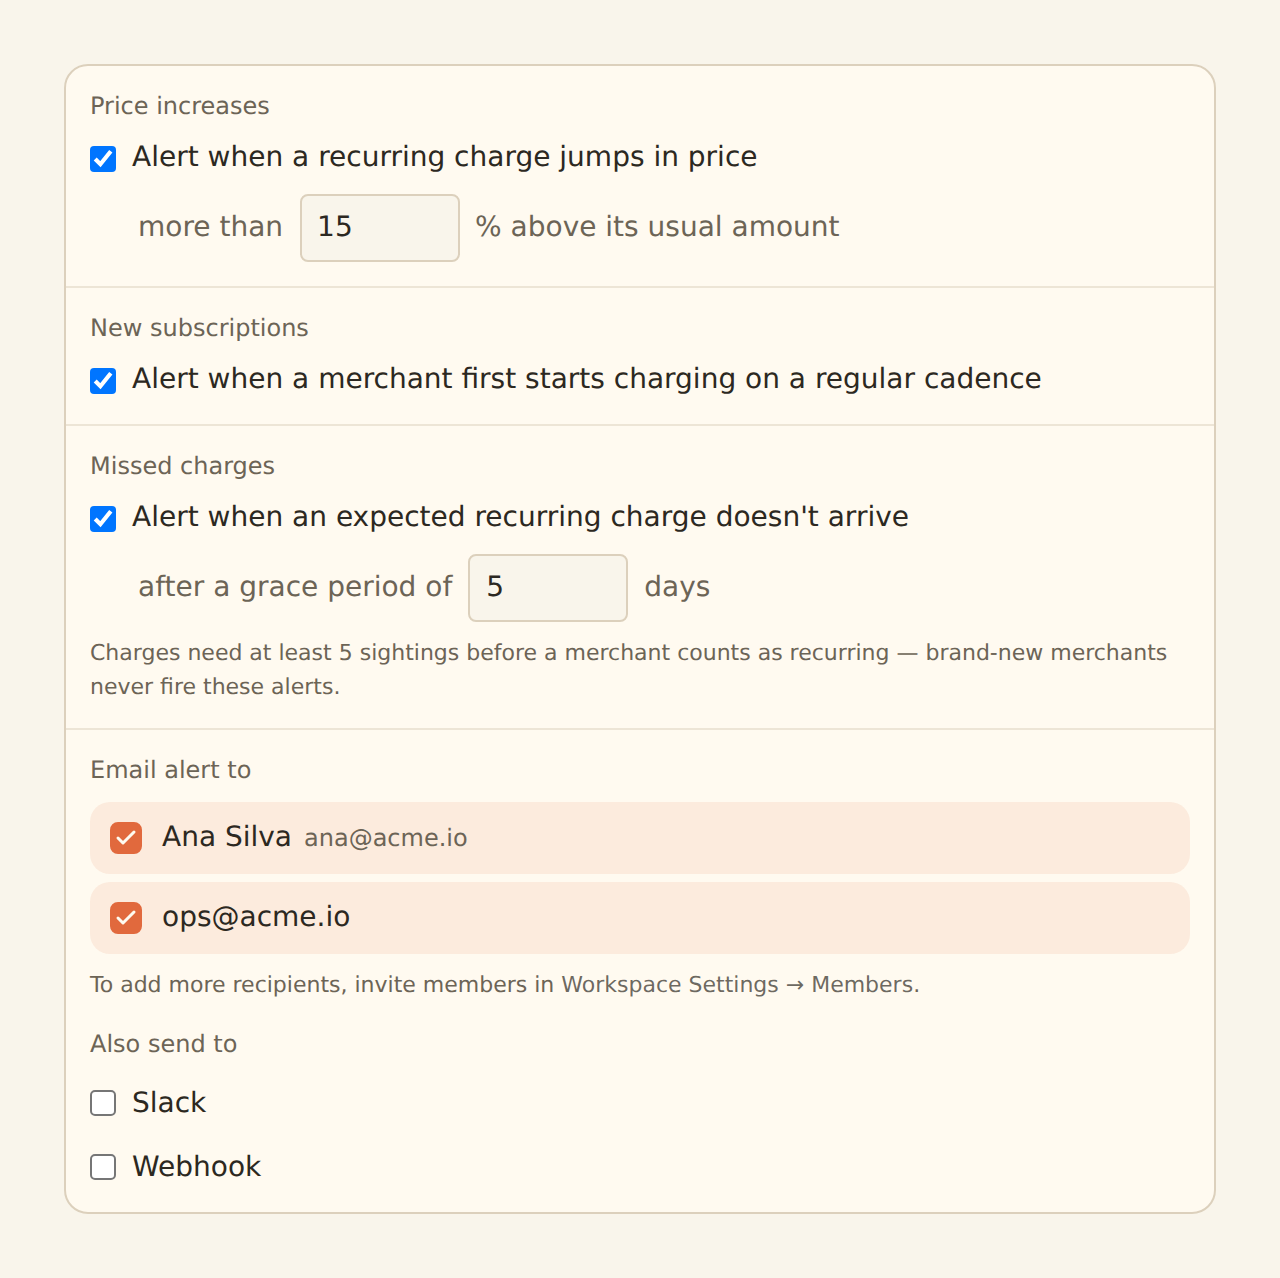
Budget can warn when a category exceeds a rolling or calendar threshold. Recurring Registry can watch established recurring merchants for price increases, new subscriptions and missed charges after sufficient observations. Anomaly Detector can identify a first-time merchant or burst. Feed Monitor protects against an apparently stable dashboard whose source stopped updating.
The enrichment order matters. Guard steps run before Memory, lookup tables and rules; AI fills remaining blanks; watch enrichments observe the final records. Suppressed records do not reach the destination, teach Memory or fire alerts. Always use Live Preview before enabling a hard Filter, Split or suppression action.
Alert freshness follows feed freshness. A daily feed cannot produce a truly real-time transaction warning. Feed Monitor covers a different failure mode: a source that has not succeeded recently or succeeds while producing no records. Cooldowns, batching and daily caps keep watches actionable.
Limitations and controls
Transactions cannot know whether a sales opportunity will close, an invoice will be collected or a hiring plan is approved. Keep expected receipts and planned costs in scenarios and label them as assumptions. A runway dashboard is a decision aid, not a solvency opinion.
Dashboards are in beta by workspace. Public links, embeds and indexed visibility should be used only for intentional public data. Sensitive finance views should normally remain private or workspace-scoped. External-agent dashboard authoring is a staging workflow; open and review anything it builds in the regular editor.
Operating rhythm
Check feed history before trusting a quiet chart. Review low-confidence categories and exceptions on a regular cadence. Document formulas, filters and classification changes. Use row comments and history when a decision needs an audit trail. A good dashboard is not the one with the most widgets; it is the one whose numbers can be explained and acted on.