
Venture capital firms often have sophisticated investment models and surprisingly manual treasury processes.
The fund model may track commitments, deployment pace, reserves, follow-ons, fees and expected distributions. But the cash position used in weekly decisions may still depend on several bank portals, downloaded CSV files and a spreadsheet that is already out of date by the time it is circulated.
That creates a basic modelling problem: the forecast may be logically sound while its opening cash balance and recent actuals are stale.
This guide explains how a venture capital firm can structure a treasury model that connects operational cash data with forward-looking fund assumptions. It is designed for finance leaders, operating partners, fund controllers and investment teams that already work in Excel or Google Sheets and want a more reliable forecasting process.
What a VC treasury model should answer
A venture capital treasury model should make it possible to answer a small set of practical questions quickly:
- How much cash is available now across the fund and management company?
- What cash is committed but not yet paid?
- When are management fees, operating costs and investment payments due?
- How much uncalled capital may need to be drawn, and when?
- How much should remain reserved for follow-on investments?
- What happens if deployments accelerate, exits slip or expenses rise?
- When could a capital call become necessary under each scenario?
These questions span two different systems of record. Bank accounts contain the actual cash movements. The fund model contains expectations about future investments, fees, calls and distributions. The treasury model joins them without confusing one for the other.
Fund model
Tracks commitments, deployment, ownership, reserves, follow-ons, fees, expected exits, capital calls, distributions and return scenarios. These are primarily assumptions and investment decisions.
Treasury forecast
Tracks current cash, scheduled payments, known receivables, operating expenses and near-term liquidity. It should begin with reconciled bank actuals and then layer on approved assumptions.
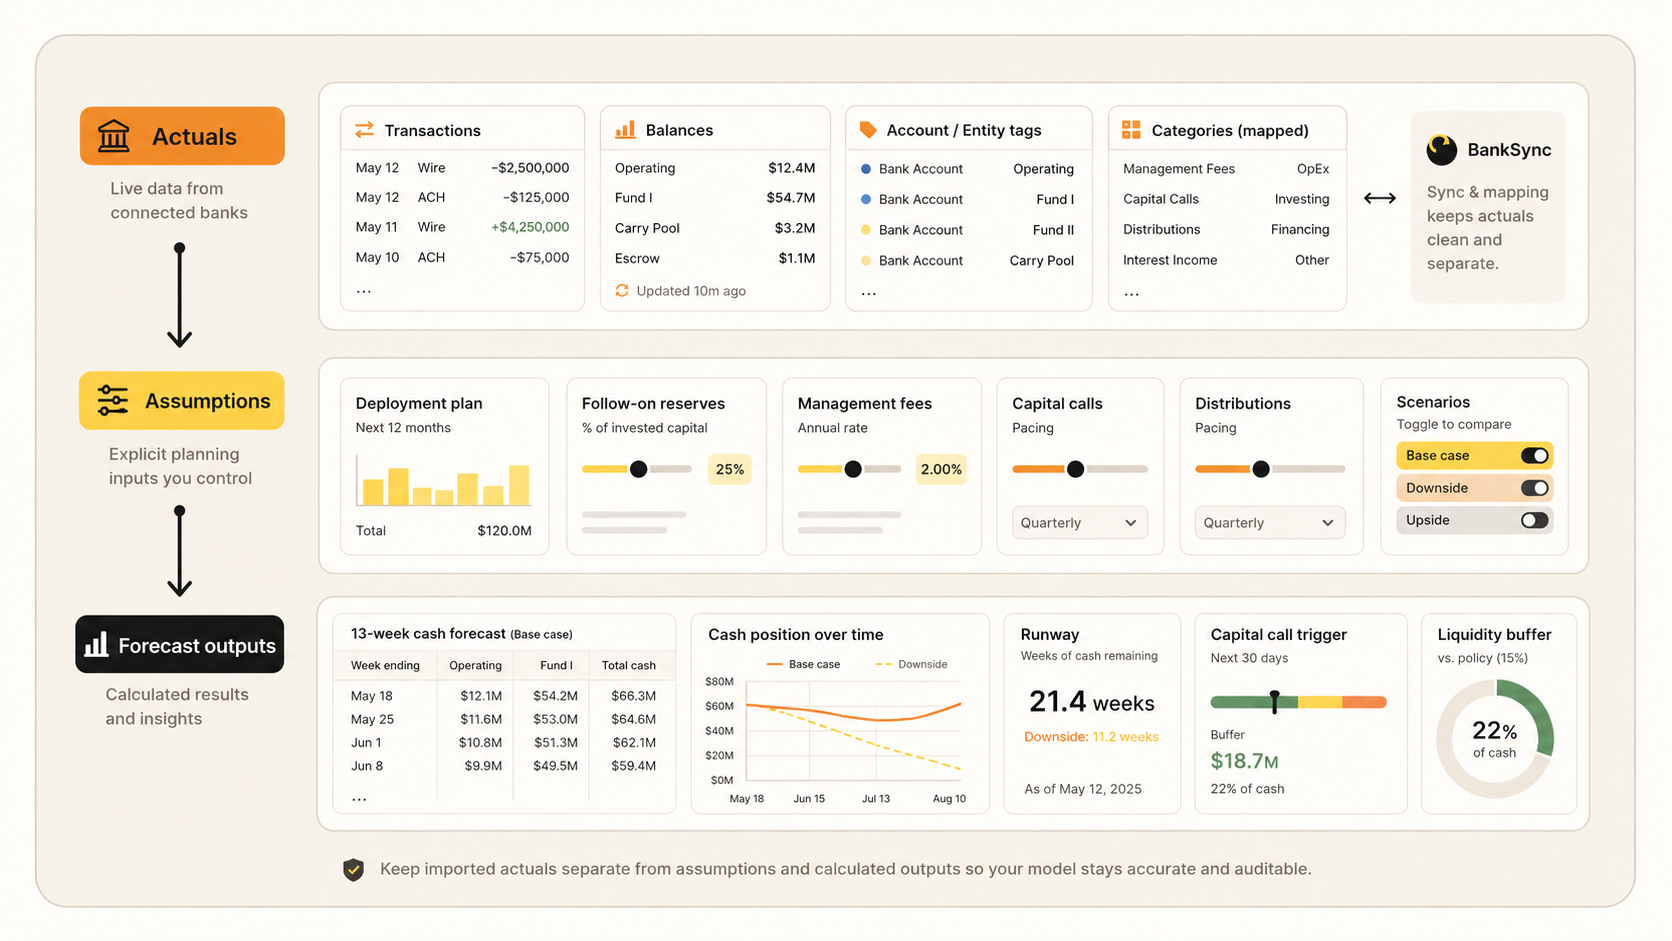
The four layers of a robust VC treasury model
The cleanest structure is a layered workbook rather than a single sheet with formulas, imported transactions and investment assumptions mixed together.
1. Source accounts
Fund bank accounts, management-company accounts, credit facilities and other supported financial accounts.
2. Actuals layer
Normalised balances and transactions with stable account, date, amount, currency and transaction identifiers.
3. Forecast layer
Investment payments, fees, capital calls, distributions, operating expenses and scenario assumptions.
4. Reporting layer
Liquidity runway, variance analysis, reserve coverage, capital-call timing and management reporting.
Start with the right workbook structure
A practical workbook can be built with six core tabs. The labels can change, but the separation of responsibilities matters.
Recommended VC treasury workbook structure
| Tab | Purpose | Typical owner |
|---|---|---|
| Accounts | Account list, entity, fund, bank, currency, liquidity class and minimum operating balance. | Finance |
| Transactions_Raw | Append-only bank transactions from supported connected accounts. | Automated feed |
| Balances_Raw | Latest available account balances and balance dates. | Automated feed |
| Mappings | Merchant, counterparty, entity, expense class, investment and transfer rules. | Finance |
| Assumptions | Deployment plan, reserves, fees, calls, distributions, expenses and scenario switches. | Investment and finance teams |
| Forecast | Weekly or monthly opening cash, inflows, outflows, closing cash, minimum buffer and funding need. | Finance |
| Dashboard | Runway, variance, upcoming payments, unfunded commitments and scenario comparison. | Partners and finance |
Keep raw data, mappings, assumptions and outputs separate so each layer can be reviewed independently.
Preserve the raw data
Do not write manual classifications or forecast formulas directly into the synced transaction table. Treat that table as an append-only source layer.
Add classifications through a separate mapping table or transformation step. This protects the audit trail and reduces the risk that a refresh overwrites manual work.
A useful transaction structure includes:
- stable transaction identifier;
- transaction and posting dates;
- account and entity;
- description and counterparty;
- signed amount;
- currency;
- category;
- investment or portfolio-company tag where applicable; and
- transfer flag.
Transfers between the firm’s own accounts should be excluded from consolidated cash burn. Otherwise, moving cash from one account to another appears as both an outflow and an inflow and can distort operating analysis.
Build the forecast from cash movements, not accounting labels
A treasury forecast is about the timing of cash. It should therefore be organised around actual and expected receipts and payments rather than solely around the accounting chart of accounts.
For a venture firm, the main forecast lines normally include:
Core forecast drivers
Opening available cash
Reconciled cash by entity, fund and currency at the start of the forecast period.
New investments
Expected initial investment payments, including signing and settlement timing.
Follow-on reserves
Expected follow-on funding by portfolio company, probability and timing.
Management fees and expenses
Management-company payroll, professional fees, technology and other operating costs.
Capital calls
Planned or modelled contributions, notice periods and collection assumptions.
Distributions and exits
Expected proceeds shown separately from base liquidity unless sufficiently certain.
Minimum liquidity buffer
The cash floor required for operations, known commitments and execution risk.
Currency movements
Separate local-currency forecasts where the fund operates across currencies.
Use three scenarios, but keep one set of actuals
Scenario planning is valuable only when it is easy to explain what changed.
Keep one reconciled actuals layer, then run separate assumptions for:
- Base case: the team’s current deployment, expense and distribution expectations.
- Conservative case: slower distributions, accelerated portfolio support and higher operating costs.
- Deployment case: faster investment pace or a concentrated period of new and follow-on investments.
Avoid duplicating the whole workbook for each scenario. Store scenario assumptions in a table and use a selector to feed the same forecast logic. This reduces formula drift and makes comparisons easier to audit.
Example scenario design
| Feature | Base case | Conservative case | Deployment case |
|---|---|---|---|
| New investment timing | Current investment plan | Current plan | Payments brought forward |
| Follow-on support | Approved reserve plan | Higher support requirement | Approved reserve plan |
| Distributions | Probability-weighted | Delayed or excluded | Probability-weighted |
| Operating costs | Current budget | Higher contingency | Current budget |
| Capital-call trigger | Minimum cash buffer | Earlier trigger | Triggered by deployment pace |
A practical build process for Excel or Google Sheets
The model does not need to begin as a major systems project. A controlled spreadsheet is often the right interface because finance and investment teams can inspect the assumptions directly.
Build the model in seven steps
Define the entities and accounts
List every fund and management-company account that belongs in the forecast. Record the legal entity, fund, currency, purpose and minimum required balance.
Create raw transaction and balance tables
Use dedicated tabs with stable columns. Keep these tables free from manual formulas and presentation logic.
Connect supported accounts
Use BankSync to connect supported bank accounts and map balance and transaction fields into the raw-data tabs in Excel or Google Sheets. Confirm current institution and regional coverage before relying on a connection.
Build the mapping layer
Classify counterparties, internal transfers, management-company expenses, fund expenses and investment payments. Keep uncertain items in an exception queue for review.
Enter forward commitments
Add expected investment payments, follow-ons, fees, operating costs, capital calls and distributions with dates, owners and confidence levels.
Calculate weekly closing cash
For each entity and currency, calculate opening cash plus expected inflows less expected outflows. Compare the result with the minimum liquidity buffer.
Run a forecast-to-actual review
At each review, compare forecast cash movements with the newly synced actuals. Investigate timing, amount and classification variances, then update assumptions rather than rewriting history.
How BankSync fits into the workflow
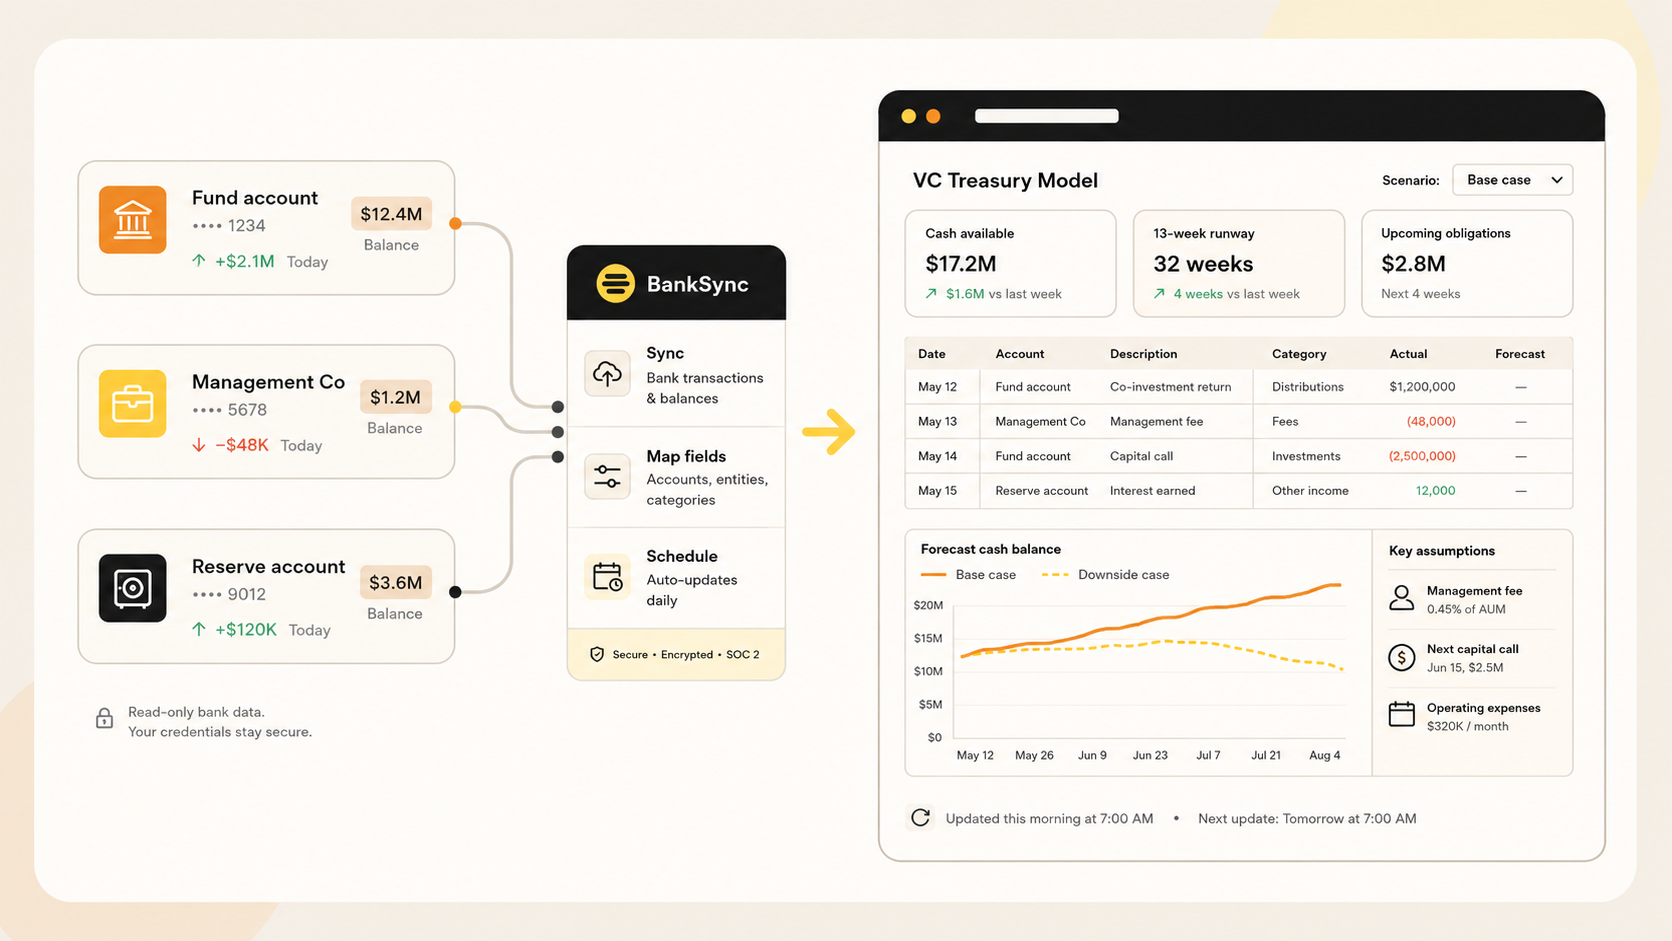
BankSync does not replace fund accounting, portfolio monitoring or the investment team’s deployment model. Its role is narrower and useful: it can reduce the manual work required to keep the bank-actuals layer current.
For supported connections, BankSync can sync financial data into destinations such as Excel and Google Sheets. Field mapping allows the incoming data to fit an existing workbook structure, while scheduled syncing can keep the raw tables updated without repeated CSV exports.
That creates several practical benefits for a venture firm:
- the opening cash position is based on a repeatable feed rather than copied balances;
- transactions can be reconciled against forecast lines more frequently;
- the same raw data can support treasury, expense and management reporting;
- transaction identifiers and account fields help reduce duplicate and cross-entity errors; and
- finance teams can retain their existing spreadsheet logic and reporting format.
For Excel workflows, the workbook generally needs to be stored in Microsoft 365, such as OneDrive or SharePoint, so a cloud service can update it. Google Sheets can be used where collaborative review and browser-based access are more important.
Review the BankSync Excel workflow or see how automatic bank data can feed Google Sheets.
Metrics worth putting on the dashboard
A partner-facing treasury dashboard should be selective. More charts do not necessarily improve the decision.
The most useful measures often include:
Treasury measures that drive decisions
Cash available after restricted balances and operational minimums.
Time until cash falls below the agreed buffer under the selected scenario.
Known investments, fees and operating payments due in the next 30 days.
Available and expected liquidity relative to approved follow-on reserves.
Difference between expected and actual net cash movement for the review period.
Earliest modelled date at which a capital call may be required.
Common modelling mistakes
Mixing fund and management-company cash
The entities may share a reporting pack, but their cash should not be combined without clear elimination and allocation logic. A management-company surplus does not automatically fund a fund obligation.
Treating an expected exit as cash
An exit expectation belongs in the forecast assumptions. It should not be treated like available liquidity until timing and certainty justify it. Conservative scenarios should normally delay or remove uncertain proceeds.
Ignoring settlement timing
A signed term sheet, approved investment or issued capital-call notice is not the same as settled cash. Use expected payment and receipt dates rather than decision dates.
Forecasting only monthly
Monthly forecasts can hide a short-term funding gap. A 13-week weekly forecast is often more useful for operational treasury, while a longer monthly model can support fund strategy.
Overwriting actuals
Once a period is closed, preserve the actual result and record the variance. Replacing the prior forecast destroys the information needed to improve future forecasting.
Extending the model to portfolio monitoring
A venture firm may also want visibility into portfolio-company cash runway. That is a separate governance and permission question.
The firm should not assume access to a portfolio company’s bank data. Where a company voluntarily participates, the cleanest structure is a separate workspace or controlled reporting process in which the company connects its own accounts and shares only the agreed outputs or data.
A portfolio model can then track:
- current cash and monthly net burn;
- runway under the company’s operating plan;
- budget-to-actual variance;
- debt-service and payroll obligations;
- expected fundraising timing; and
- concentration of liquidity risk across the portfolio.
Keep company-level permissions, data and reporting boundaries separate. Consolidated portfolio reporting should aggregate approved metrics without casually exposing every company’s transaction detail.
Frequently asked questions
VC treasury modelling FAQs
The bottom line
The best VC treasury model is not the most complicated workbook. It is the model that begins with reconciled cash, keeps assumptions visible and shows when the firm may need to act.
Separate the actuals, mappings, assumptions and reporting layers. Use weekly liquidity forecasting for near-term decisions and a longer deployment model for fund strategy. Then automate the repeatable part: bringing supported bank transactions and balances into the spreadsheet where the team already works.
That gives partners a clearer view of liquidity without asking finance teams to rebuild the forecast from bank portals and CSV files each week.